Abstract
Two-dimensional nuclear magnetic resonance spectroscopy was used to investigate the flexibility of the threonine side chains in the β-helical Tenebrio molitor antifreeze protein (TmAFP) at low temperatures. From measurement of the 3Jαβ 1H-1H scalar coupling constants, the χ1 angles and preferred rotamer populations can be calculated. It was determined that the threonines on the ice-binding face of the protein adopt a preferred rotameric conformation at near freezing temperatures, whereas the threonines not on the ice-binding face sample many rotameric states. This suggests that TmAFP maintains a preformed ice-binding conformation in solution, wherein the rigid array of threonines that form the AFP-ice interface matches the ice crystal lattice. A key factor in binding to the ice surface and inhibition of ice crystal growth appears to be the close surface-to-surface complementarity between the AFP and crystalline ice, and the lack of an entropic penalty associated with freezing out motions in a flexible ligand.
Keywords: Antifreeze protein, β-helix, nuclear magnetic resonance, side chain dynamics
Antifreeze proteins (AFPs) present in various organisms, including fish (Fletcher et al. 2001), insects (Duman 2001), and plants (Worrall et al. 1998; Sidebottom et al. 2000), help them to survive the freezing conditions of the environments in which they live. The yellow mealworm beetle Tenebrio molitor, for example, produces AFP (abbreviated TmAFP) in its hemolymph while overwintering in the larval stage. AFPs bind to the ice surface, inhibiting ice crystal growth and depressing the freezing point of the solution below the melting point. The separation of the nonequilibrium freezing temperature and the melting temperature in a solution containing ice crystals is referred to as thermal hysteresis (for review, see Jia and Davies 2002). At millimolar concentrations, the TmAFP can account for 5.5°C of thermal hysteresis (Graham et al. 1997). This is much more active (10–100 times) than the well-studied fish AFPs (Davies and Sykes 1997).
Binding to the ice surface is believed to proceed via an adsorption-inhibition mechanism, although the details of this interaction at the molecular level are not understood (Raymond and DeVries 1977). AFP binding to ice is specific and occurs on defined planes. This is supported by observations that AFP solutions are able to shape the ice crystals to produce particular ice crystal morphologies (Houston Jr. et al. 1998). Crystal growth is slowed or stopped completely on the plane to which the AFP binds. For example, fish AFPs shape the ice crystal into a hexagonal bipyramid by binding to the pyramidal plane, whereas insect AFPs can bind to both prism and basal planes, shaping the ice crystal into a hexagonal plate (Graether et al. 2000). Ice etching studies can reveal the specific ice surface bound by an AFP and also support this hypothesis (Knight et al. 1991).
Early attempts to define the nature of the AFP–ice interaction focused on hydrogen bonding of polar side chains to the ice lattice, either through the inclusion of hydrogen bonding side chains into the ice lattice (lattice occupancy; Wen and Laursen 1992) or by a hydrogen bond match with ice surface oxygen atoms (lattice matching; Sicheri and Yang 1995). The models were based on the crystal structure of the α-helical Type I AFP from winter flounder, the best characterized and simplest AFP to study. It is composed of 37 amino acids, with a tandemly repeated 11-amino acid unit with consensus sequence TX2N/DX7, where X is generally alanine (Davies and Hew 1990). The 16.5 Å spacing of the i, i+11 threonine residues matches the 16.7 Å distance of the water molecules on the pyramidal plane. However, further experimentation has led to diminished importance for the hydrogen bonding interaction, because mutation of threonine to serine, preserving the hydroxyl group and therefore the hydrogen bonding ability of the side chain, caused a severe loss in activity, whereas mutation to valine, preserving the methyl group and the shape of the side chain, resulted in a relatively minor loss of activity (Chao et al. 1997; Haymet et al. 1998, 1999; Zhang and Laursen 1998). Additionally, a redefinition of the ice-binding site of this AFP has occurred on the basis of mutation studies in which the alanine 17 to leucine mutant abolished antifreeze activity (Baardsnes et al. 1999). On the basis of these studies and a recent examination of Type III AFP ice-binding (Baardsnes and Davies 2002), a universal ice-binding mechanism relying on hydrophobic and van der Waals interactions is emerging.
The mechanism of ice-binding has also been complicated by questions concerning the relative rigidity or flexibility of the side chains. Upon refinement of the Type I crystal structure, the ice-binding threonine residues were observed to all adopt a rigid side chain conformation with a χ1 of −60° (Sicheri and Yang 1995). Those authors suggested that the rigidity and common orientation of these side chains are critical for the ice-binding mechanism. However, solution NMR studies at low temperatures indicated that the threonine residues of Type I AFP were in fact flexible, and can sample many possible rotameric states prior to ice binding (Gronwald et al. 1996).
The highly active TmAFP is an ideal candidate for this type of mechanistic study. TmAFP is a small (8.4-kD) highly disulfide-bonded, right-handed parallel β-helix consisting of seven tandemly repeated 12 amino acid loops. Its crystal structure revealed an array of threonine residues on the β-sheet side of the protein that all adopted the same χ1 = −60° rotameric conformation, and the spacing of the hydroxyl groups is a near-perfect match to the prism plane of ice and approximates the spacing on the basal plane (Liou et al. 2000b). In addition, the crystal structure also contained bound external water molecules that, along with the threonine hydroxyls, mimic a section of the ice lattice; this was the first time that this has been observed in an AFP structure. Furthermore, this threonine array has been defined as the ice-binding face by extensive mutagenesis (Marshall et al. 2002). The threonines not on the ice-binding face serve as internal controls. We previously solved the NMR solution structure of TmAFP and performed an analysis of the 15N backbone relaxation parameters which revealed it to be a well folded and rigid protein with restricted backbone internal mobility throughout, at both 30°C and 5°C (Daley et al. 2002). In the present study, we investigated the orientations of the threonine side chains in solution to examine the role of flexibility of these side chains in this binding interface, using high-resolution two-dimensional DQF-COSY experiments to measure the 3Jαβ coupling constants. These coupling constants, in combination with NOE data, were used to determine the conformational states of the threonine side chains. These observations are important to the consideration of surface residues, for understanding both antifreeze protein activity and other systems involved in molecular recognition.
Results
The amino acid sequence and structure of TmAFP are shown in Figure 1, A and B▶, respectively. The threonine residues arrayed on the β-sheet side of the protein, which were identified by mutagenesis as the ice-binding residues (Marshall et al. 2002), are highlighted in blue. Those threonine residues that are not part of the ice-binding face are colored red. Threonine 9, which is also not involved in ice binding, is colored green, because coupling constant data could not be obtained for this residue.
Figure 1.
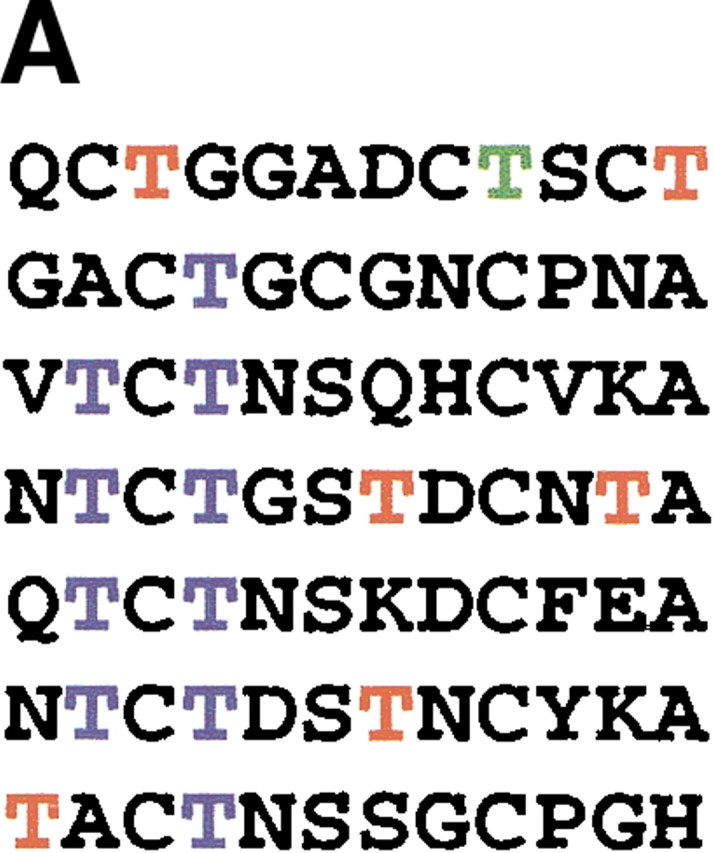
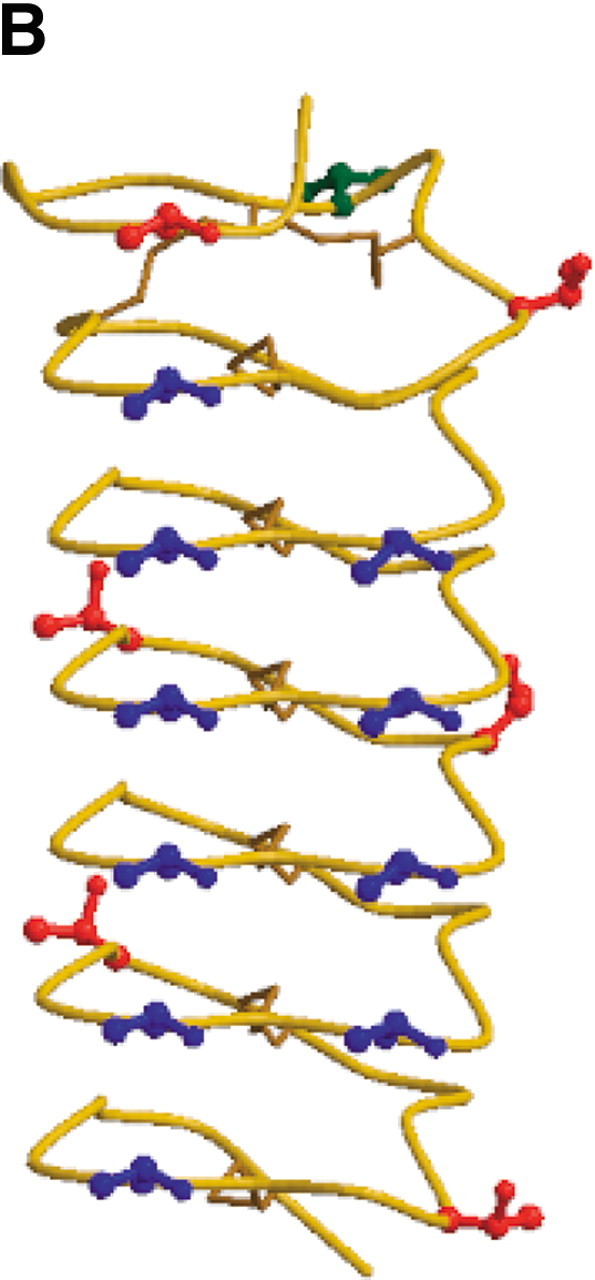
Sequence and structure of the T. molitor AFP isoform used in this study. (A) Amino acid sequence. The 17 threonine residues are colored to emphasize their positions in the protein. The threonines in blue are those that form the ice-binding face; the threonines in red and in green are not part of the ice-binding face. Coupling constant data could not be obtained for T9 (in green). (B) Structure of TmAFP (PDB 1EZG) with threonine side chains displayed in ball-and-stick representation and colored as for the sequence in (A). Figure generated using Molscript (Kraulis 1991) and Raster3D (Merritt and Bacon 1997).
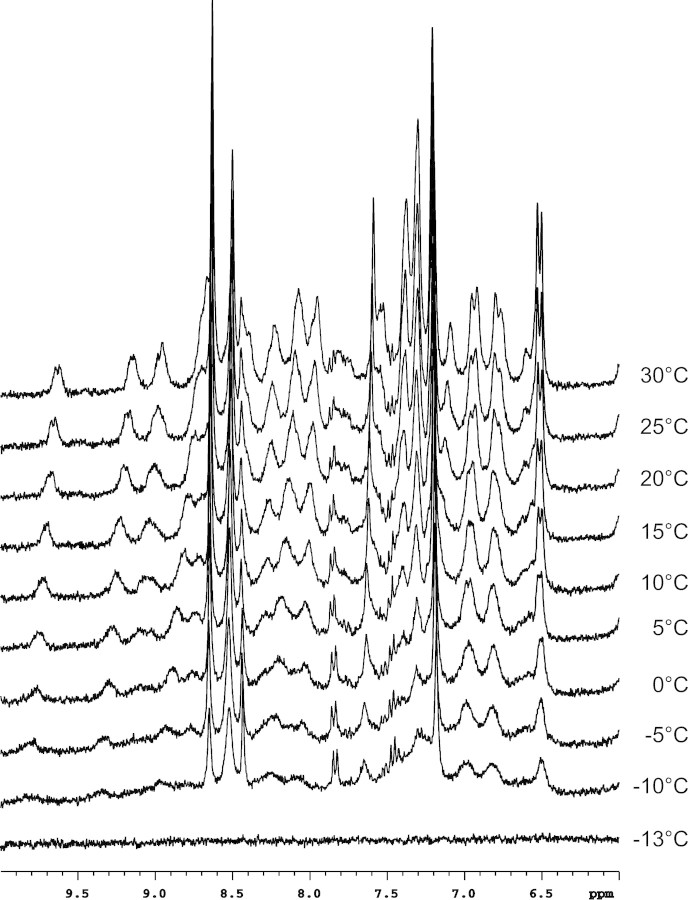
To ensure that there was no change in the structure of TmAFP in normal versus supercooled water, the 1H NMR spectra of TmAFP in D2O as a function of temperature were examined (Fig. 2▶). For clarity, only the amide region from 6 to 10 ppm is displayed, corresponding to the HN resonances of buried residues. This region is a particularly sensitive indicator of protein folding and has been successfully used to assess TmAFP folding (Liou et al. 2000a). As the temperature is decreased, there are no changes in chemical shift, only a line-broadening which is attributable to the increase in solvent viscosity and does not represent a structural change at low temperature. This has been extensively studied using Type I AFP with similar results (Graether et al. 2001). As shown in the final spectrum in Figure 2▶, the sample eventually froze at −13°C, at which point liquid state NMR experiments could no longer be conducted.
Figure 2.
1H NMR spectra at 300 MHz of TmAFP in 100% D2O. Samples were cooled from 30°C to −20°C, as outlined in Materials and Methods.
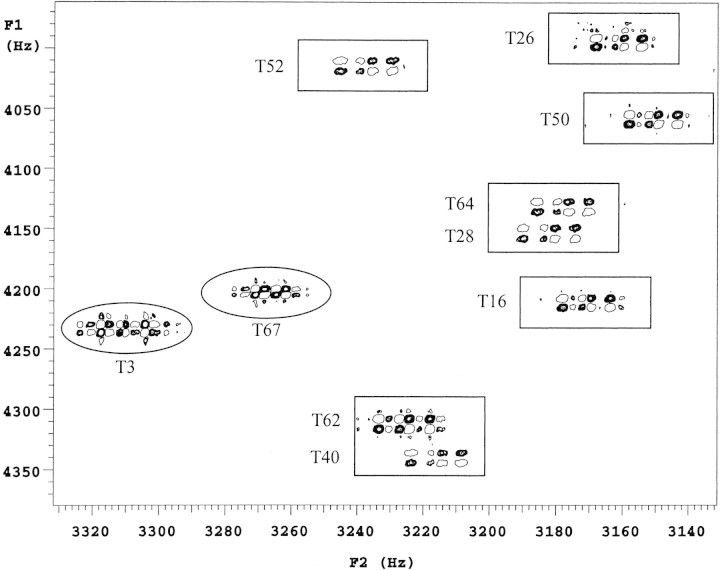
Characterization of the threonine 1H-1H 3Jαβ coupling constants of TmAFP began with the identification of the threonine Hα-Hβ cross-peaks in the DQF-COSY spectrum (Fig. 3▶). The advantages of DQF-COSY are that double quantum filtration is used to eliminate singlet resonances to help simplify the spectrum, and resolution is improved because both the diagonal and cross-peaks are in pure absorption phase. The disadvantage is that it is less sensitive by a factor of two compared to conventional COSY. This was compensated for by making a sample with as high a protein concentration as possible and by collecting the data at the highest available field. Chemical shifts for this protein have been reported (Daley et al. 2002) and are deposited in the BMRB (accession number 5323).
Figure 3.
2D DQF-COSY 1H NMR spectrum at 800 MHz of TmAFP at 30°C in 100% D2O. Part of the Hα-Hβ region containing the threonine cross-peaks is displayed. The boxed threonines are those on the ice-binding face; the circled ones are not.
A cross-peak between a pair of protons is due only to the coupling between them (active coupling), but each proton in the pair may also have couplings to other nuclei (passive couplings). In a phase-sensitive COSY experiment, these are indicated by the active couplings giving rise to splittings that are alternating in phase, whereas the passive couplings split the line without altering the phase. An example of a well resolved cross-peak (T62) and its fine structure are shown in detail in Figure 4A▶. Despite the high digital resolution of these spectra, accurate values for the coupling constants are difficult to obtain directly, especially at the lower temperatures, where the slower molecular tumbling results in increased line-broadening. As linewidths increase, the separation between the antiphase components, that is, the active coupling being measured, becomes increasingly different from the actual splitting (Wüthrich 1986). To minimize this effect, the method of Kim and Prestegard (1989) was used to measure peak-to-peak separations of the extrema in absorptive and dispersive plots of rows through the cross-peaks of interest. From these, an accurate calculation of scalar couplings can be made by analytical solution of the equations for Lorentzian lines. Although the increased linewidths observed at lower temperatures are an issue, this method is highly accurate when the linewidths are less than J, becoming less accurate for linewidths greater than J (Kim and Prestegard 1989). Owing to the extremely stable behavior of TmAFP in solution and at lower temperatures, and the high digital resolution of the spectra, the extracted linewidths range from 2.1 to 4.2 Hz at 30°C, and 5.2 to 8.8 Hz at 5°C. These values for linewidths are similar to those obtained by spectral simulation of one-dimensional spectra. The values of Δ|gn are less than J for those threonine residues on the ice-binding face and on the order of J for the threonines not on the ice-binding face. This implies that the observed 3Jαβ coupling constants are accurate for residues on the ice-binding face and that the smaller values of J (i.e., the residues not on the ice-binding face) are affected by line broadening to a greater degree. This leads to an approximately 0.5 Hz overestimation of the 3Jαβ measurements for the smallest values. A series of simulated cross-peak spectra generated using the program Mathematica (Wolfram 1996), with the 3Jβγ passive coupling set to 7 Hz (to indicate free rotation of the threonine methyl group) and the 3Jαβ active coupling allowed to vary from 3 to 11 Hz, showed that the calculated splitting patterns matched those in the experimental spectrum.
Figure 4.
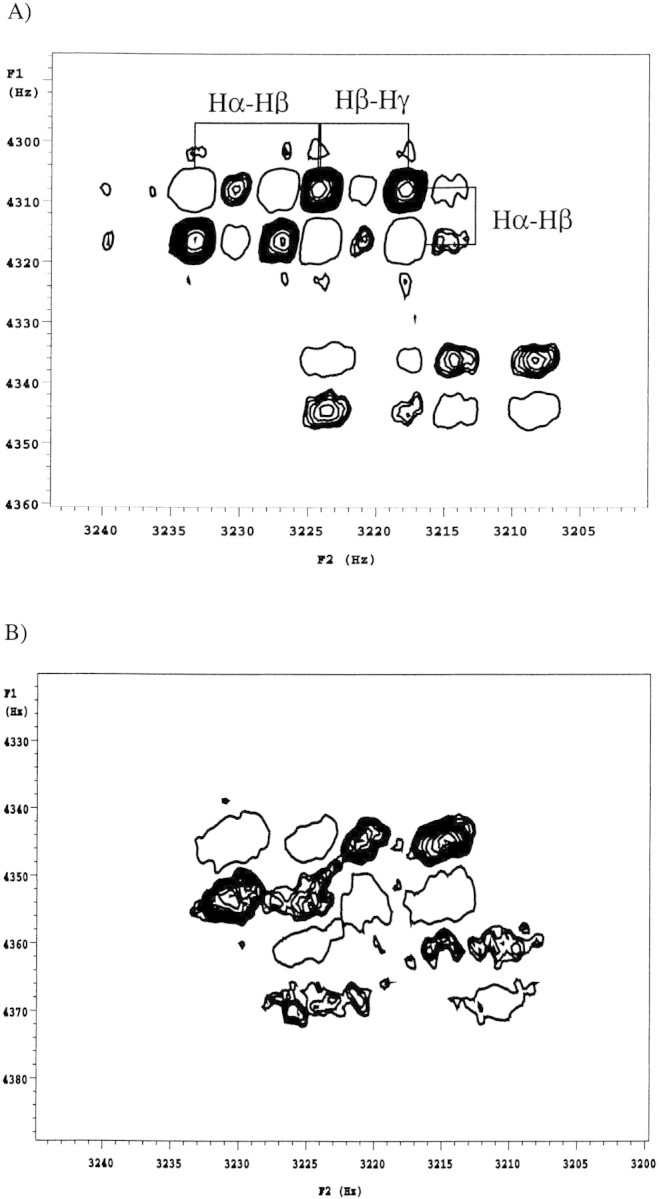
Expansions of the 2D DQF-COSY 1H NMR spectra at 800 MHz of TmAFP at (A) 30°C and (B) 15°C. The region containing the Hα-Hβ cross-peak patterns of T40 (bottom) and T62 (top) are displayed to show the fine splitting of these cross-peaks. To distinguish between positive and negative peaks, the positive peaks are displayed as contoured peaks and the negative peaks are displayed as open circles.
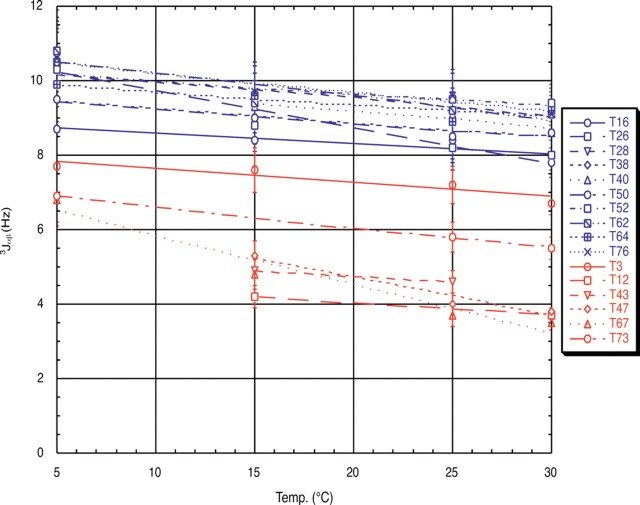
The chemical shifts obtained at the various temperatures did not change significantly; however, the coupling constants displayed a marked difference depending on their location in the protein and increased significantly as the temperature was lowered. The observed coupling constants and their temperature dependence are summarized by the graph in Figure 5▶. The threonine residues can clearly be separated into two distinct populations on the basis of these measured coupling constants. These are displayed as the blue (on the ice-binding face) and red (not on the ice-binding face) populations on the graph.
Figure 5.
Plot of 3Jαβ of each threonine residue as a function of temperature. The two observed populations correspond to those threonines on the ice-binding surface, in blue, and the threonines not on the ice-binding surface, in red.
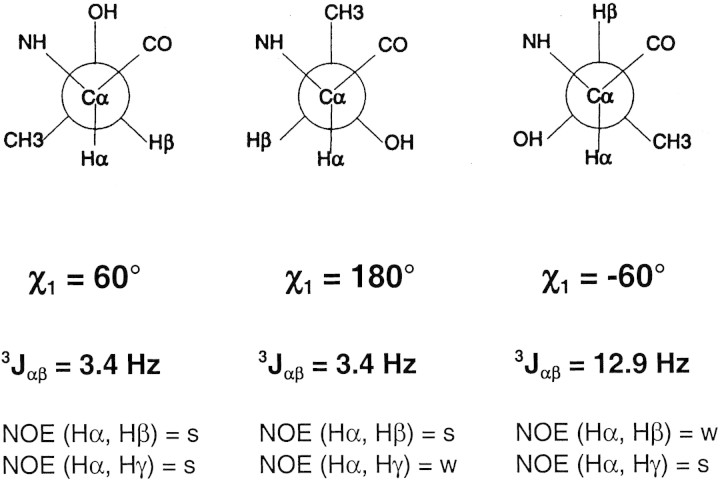
The measured coupling constants are used to calculate the occupancy of a specific rotamer conformation on the basis of the expected coupling constants. In Figure 6▶, the expected coupling constants are displayed for the three staggered rotamer conformations of threonine. A side chain which does not have a fixed conformation, but instead undergoes rotation that is fast on the NMR time scale will have an average coupling constant of about 6.6 Hz.
Figure 6.
Correlation of the 3Jαβ coupling constants and the corresponding NOE intensities with the χ1 side chain torsion angles for the three most populated threonine rotamer conformations. The threonine side chain is shown in the Newman projection with the Cα in front and the Cβ in the back.
The observed 3Jαβ coupling constants of T3 (6.7 Hz) and T73 (5.5 Hz) at 30°C are very close to this expected value for unrestricted rotation and suggest either an equal population of all three rotamers or averaging between a gauche and the trans rotamer. Using T52, from one of the central loops of the ice-binding face as a representative ice-binding threonine, a coupling constant of 9.4 Hz is observed at 30°C. This value increases to an observed coupling constant of 10.8 Hz at 5°C. In the following equation, P1, P2, and 1−P1−P2 describe the fractional occupancy of the side chain in the +60°, 180°, and −60° conformations, respectively.
 |
(1) |
Solving this equation shows that the side chain of T52 populates the χ1 = −60° conformation 63% of the time at 30°C. At 5°C, this increases to 73% population of the χ1 = −60° rotamer. These calculations were performed for all of the observed coupling constants at all four temperatures, and these results are displayed in Table 1▶. The NOE analysis, as described in the Materials and Methods section, corroborates this observation of restricted rotation for the threonines on the ice-binding face.
Table 1.
Percent population of the χ1 = −60° rotamer conformation
| Residue | 30°C | 25°C | 15°C | 5°C |
|---|---|---|---|---|
| Type I AFPa | ||||
| T2 | 39 | |||
| T13 | 54 | |||
| T24 | 54 | |||
| T35 | 34 | |||
| TmAFP | ||||
| T3b | 35 | 40 | 44 | 45 |
| T12c | 3 | — | 9 | — |
| T43c | — | 13 | 16 | — |
| T47c | 5 | 7 | 20 | — |
| T67c | 1 | 4 | 15 | 36 |
| T73b | 22 | 25 | — | 37 |
| T16 | 46 | 53 | 53 | 56 |
| T26 | 48 | 50 | 57 | 75 |
| T28 | 62 | 60 | 63 | 74 |
| T38 | 55 | 54 | 59 | 64 |
| T40 | 55 | 60 | 62 | — |
| T50 | 55 | 54 | 59 | 64 |
| T52 | 63 | 64 | 65 | 73 |
| T62 | 60 | 61 | 63 | 78 |
| T64 | 61 | 58 | 65 | 69 |
| T76 | 61 | 65 | 67 | 76 |
a Values for Type I AFP are from Gronwald et al. 1996.
b Values are consistent with free rotation of the sidechain.
c Values are consistent with the χ1 = +60° rotamer conformation.
In contrast, for T47, only five residues prior to T52 but not an ice-binding residue, a coupling constant of only 3.8 Hz is observed at 30°C. This corresponds very nearly to complete occupancy of either the χ1 = 180° or +60° rotamer, with only 5% population of the χ1 = −60° rotamer. The NOE analysis in this case supports the χ1 = +60° rotamer, as the NOE ratio is close to 1. Upon lowering the temperature to 15°C, the coupling constant does increase to 5.3 Hz, indicating that population of the χ1 = −60° rotamer is increasing at the expense of χ1 = +60°, suggesting the occurrence of rotameric averaging at the lower temperatures for the non-ice-binding threonine residues. This cannot be distinguished on the basis of the NOE analysis, because both a χ1 = +60° and a freely rotating side chain will have an NOE ratio of approximately 1. Nevertheless, it can be generally stated that the coupling constants for the ten threonines comprising the ice recognition surface populate the χ1 = −60° rotamer to a greater degree than the remaining threonines, which correspond to either an average of more than one conformation, or to preference for the χ1 = +60° rotamer.
Discussion
Although the ability of AFPs to bind ice and inhibit its growth is well known, it is not well understood. Study of the molecular mechanism by which these proteins adsorb to ice are hindered by two main factors: first, the wide structural variation of AFPs for which structures have been solved, and second, the unique characteristics of the AFP–ice interaction which make it difficult to examine directly. The structural diversity of AFPs and the inability to deduce any sequence similarity between different AFP types means that putative ice-binding faces have been proposed based on mutation studies. The only features these varied sites appear to share is the relative flatness of the interaction surface of the protein, and in the case of Type I and the insect AFPs, the evenly spaced ranks of threonine that match the ice lattice. As well, a significant proportion of the surface area of the protein is involved in the binding interface, and the ice-binding sites generally appear to contain more hydrophobic and less polar amino acid side chains than the rest of the protein. Mutation studies of Type I and Type III fish AFPs and the β-helical insect AFPs have been very revealing, however. Mutations that introduce large side chains on the ice-binding surface sterically block the AFP–ice interaction, but are well tolerated elsewhere on the protein (Marshall et al. 2002). Mutations that decrease the size of the side chain are also deleterious; however, mutations that are isosteric, that is, those that do not change the shape or size of the side chain, are generally neutral (Baardsnes and Davies 2002). This suggests that loss of shape complementarity and with it, the hydrophobic and van der Waals contacts, is an important factor contributing to the ability of these proteins to bind to ice. Mechanistically, for the adsorption-inhibition model of crystal growth to explain the observed properties of AFPs, the proteins must bind irreversibly. Therefore the antifreeze must fit almost perfectly to the ice in order to prevent water molecules from entering the interface (Knight and Wierzbicki 2001). This can explain why any mutation that disrupts the "snugness" of the binding interface, whether larger or smaller, will have negative effects on ice-binding and thermal hysteresis.
In order to elucidate the molecular mechanism of ice binding, it is necessary to characterize the conformations of the critical side chains. The NMR analyses of TmAFP indicate that the ice-binding threonine residues have a clear preference for the χ1 = −60° rotamer conformation at all temperatures studied and that this preference becomes more pronounced at the lower temperatures, where the AFP is closer to physiologically relevant conditions. The threonine residues that are not on the ice-binding surface do not display this preferred conformation. This indicates that the TmAFP adopts a unique preformed ice-binding structure in solution prior to recognition of the ice surface. The rigidity of the side chains in the binding site reduces the entropic barrier to binding, as the side chains do not have to reposition themselves prior to ice binding. This experimental observation that the key binding side chains of TmAFP position themselves in the rotamer conformation they adopt in the interface supports the hypothesis proposed based on molecular dynamics simulations of proteins both alone and in complex that this allows biological recognition to proceed on a feasible time scale and yields an intermolecular affinity that reduces the entropic penalty of binding (Kimura et al. 2001). The flexibility and free rotation of the threonine residues not on the ice-binding face may help prevent the structuring of water molecules on the other side of the protein and prevent its engulfment.
The β-helical structure of TmAFP provides the ideal scaffold to form this rigid ice-binding conformation. The repetitiveness of the primary amino acid sequence is reflected in the three-dimensional loop structure allowing a rigid array of threonine residues to perfectly match the ice crystal lattice. Notably, the χ1 = −60° rotamer conformation is a commonly preferred rotamer in β-sheet secondary structure, due to favorable hydrogen bonding effects with the backbone (Dunbrack Jr. and Karplus 1994).
The inability to directly observe the molecular interaction of AFP and ice requires the use of various methods to indirectly probe the surface interaction. Computational docking studies and molecular dynamics simulations are commonly used ways to examine this interface; however, the potential flexibility of protein surface side chains has posed a challenge for correct modeling. In the present study, we show that the threonine side chains in the ice-binding face are not particularly flexible, and furthermore, we determined the rotamer conformation most preferred by these side chains. This knowledge will contribute to the ability to perform more accurate molecular dynamics simulations and docking studies. Finally, the indirect probe we employed, specifically solution-state NMR experiments to study protein dynamics, has proven very useful in characterizing the rigid nature of the AFP–ice interface and the behavior of the side chains in particular. Clearly the intimate surface-to-surface complementarity between TmAFP and crystalline ice is a key factor in binding.
Materials and methods
NMR spectroscopy
An unlabeled sample of TmAFP isoform 2–14 previously prepared was used for all experiments described. This sample was prepared by dissolving the lyophilized protein in 100% D2O, with 0.1 mM DSS added for internal referencing. The final protein concentration was approximately 2 mM and the pH was adjusted to 5.6 with microliter aliquots of 100 mM NaOD or DCl as required. For the freezing experiment, a medium-walled tube (524-PP-8, Wilmad) was used to prevent tube breakage.
The freezing experiment was collected on a Varian Unity 300 MHz spectrometer using an indirect detection probe. The 1H 1D NMR spectra were collected over a temperature range of 30°C to −20°C in 1°C decrements. After each temperature change, the sample was allowed to equilibrate for 30 min. For each temperature point, 16,000 complex data points were acquired with 256 transients using a spectral width of 4000 Hz. The 90° pulse width was calibrated to 7.5 μsec.
The 2D DQF-COSY (Rance et al. 1983) and NOESY (Jeener et al. 1979) spectra were acquired at 30°C on a Varian INOVA 800 MHz spectrometer equipped with a 5-mm triple resonance probe and x, y, and z-axis pulsed field gradients. For the DQF-COSY experiment, a spectral width of 7000 Hz was used in both dimensions. The acquired data consisted of 8192 F2 × 1024 F1 complex data points. The data were zero-filled to give a spectrum after transformation that contained 16,384 × 4096 data points. The 2D NOESY spectrum was acquired with a spectral width of 10,000 Hz in both dimensions and a mixing time of 100 msec. The data consisted of 8192 F2 × 512 F1 complex data points and were zero-filled to give a spectrum that contained 16,384 × 4096 data points after transformation.
All 2D DQF-COSY spectra collected for measurement of 3Jαβ coupling constants were also measured on the Varian INOVA 800 MHz spectrometer. Spectra were acquired at 5°C, 15°C, 25°C, and 30°C with a spectral width of 2000 Hz in F2 and 2400 Hz in F1. Temperature calibration of the spectrometer indicates the reported temperatures are within 0.5°C from 5°C to 20°C and within 0.1°C from 25°C to 30°C. The data consisted of 8192 F2 × 1024 F1 complex data points. The spectra were processed with 16,384 × 4096 data points using an unshifted sine bell window function in combination with line broadening in both dimensions. All NMR data processing, including the integration of the NOEs, was performed using the Varian VNMR 6.1B processing software on a Sun Blade 100 workstation.
Determination of 3Jαβ coupling constants
The 3Jαβ coupling constants of the threonine residues were determined at four temperatures from the peak separation of the DQF-COSY Hα-Hβ cross-peaks. Even with the high digital resolution of the spectra, it is difficult to obtain accurate values for coupling constants directly from the observed splitting, as the separation between antiphase components becomes increasingly different from the actual splitting with increasing linewidths (Wüthrich 1986). Slower molecular tumbling at decreased temperatures causes this effect to become more pronounced at the lower temperatures measured. For this reason we used the method of Kim and Prestegard (1989), which allows accurate calculation of scalar couplings by the measurement of peak-to-peak separations of the extrema in absorptive and dispersive plots of rows through the cross-peaks of interest. These peak-to-peak separations were measured along the higher resolution F2 axis in the opposite trace orientation from that displayed in Figure 4A▶ to reduce partial overlap in the multiplet.
Determination of χ1 side chain torsion angles
The χ1 side chain torsion angles are obtained by the analysis of the pattern of 3Jαβ coupling constants and the relative intensities of the intraresidue NOEs involving the Hα and two Hβ protons (Karplus 1959, 1963; Clore and Gronenborn 1989). Figure 6▶ displays the necessary information for determining these angles for the simpler case of threonine residues, which have only one Hβ proton. From the observed coupling constant, it is possible to calculate the occupancy of a specific rotamer conformation on the basis of the expected coupling constants for the different staggered rotamers.
 |
(2) |
where Pi is the fractional occupancy of a conformation corresponding to the coupling constant Ji. For a side chain which is not fixed into one conformation, an average coupling constant will be obtained if the rotation is fast on the NMR time scale. In the case of a threonine side chain with no rotamer preference, a 3Jαβ of 6.6 Hz would be obtained. In addition to the information about preferred rotameric states obtained from coupling constant analyses, the ratio of NOE intensities of the α-, β-, and γ-protons provides further evidence. The NOE ratio is defined by:
 |
(3) |
The Hα-Hγ NOE is divided by 3 to account for the three threonine methyl protons as compared to the one β-proton. As outlined in Figure 6▶, an NOE ratio significantly less than 1 corresponds to a χ1 of −60°, whereas an NOE ratio significantly greater than 1 corresponds to a χ1 of 180°. An NOE ratio of approximately 1 corresponds to either a χ1 of +60° or to a freely rotating side chain.
Acknowledgments
We thank Dr. Peter L. Davies for the unlabeled Tm 2–14 protein we used in this study, Dr. Steffen Graether for assistance with the freezing experiments, and Gerry McQuaid for maintenance of the NMR spectrometers. We also thank the Canadian National High Field NMR Centre (NANUC) for their assistance and use of the facilities. The operation of NANUC is funded by the Canadian Institutes of Health Research (CIHR), the Natural Science and Engineering Research Council of Canada (NSERC), and the University of Alberta. This work was supported through grants from the CIHR and the Protein Engineering Network of Centres of Excellence (PENCE) to B.D.S. M.E.D. is supported by a CIHR Doctoral Research Award.
The publication costs of this article were defrayed in part by payment of page charges. This article must therefore be hereby marked "advertisement" in accordance with 18 USC section 1734 solely to indicate this fact.
Abbreviations
AFP, antifreeze protein
DQF-COSY, double quantum filtered correlated spectroscopy
NMR, nuclear magnetic resonance
NOE, nuclear Overhauser enhancement
NOESY, nuclear Overhauser effect spectroscopy
3Jαβ, 3-bond scalar coupling constant between spins Hα and Hβ
Article and publication are at http://www.proteinscience.org/cgi/doi/10.1110/ps.0369503.
References
- Baardsnes, J. and Davies, P.L. 2002. Contribution of hydrophobic residues to ice binding by fish type III antifreeze protein. Biochim. Biophys. Acta 1601 49–54. [DOI] [PubMed] [Google Scholar]
- Baardsnes, J., Kondejewski, L.H., Hodges, R.S., Chao, H., Kay, C., and Davies, P.L. 1999. New ice-binding face for type I antifreeze protein. FEBS Lett. 463 87–91. [DOI] [PubMed] [Google Scholar]
- Chao, H., Houston Jr., M.E., Hodges, R.S., Kay, C.M., Sykes, B.D., Loewen, M.C., Davies, P.L., and Sönnichsen, F.D. 1997. A diminished role for hydrogen bonds in antifreeze protein binding to ice. Biochemistry 36 14652–14660. [DOI] [PubMed] [Google Scholar]
- Clore, G.M. and Gronenborn, A.M. 1989. Determination of three-dimensional structures of proteins and nucleic acids in solution by nuclear magnetic resonance spectroscopy. Crit. Rev. Biochem. Mol. Biol. 24 479–557. [DOI] [PubMed] [Google Scholar]
- Daley, M.E., Spyracopoulos, L., Jia, Z., Davies, P.L., and Sykes, B.D. 2002. Structure and dynamics of a β-helical antifreeze protein. Biochemistry 41 5515–5525. [DOI] [PubMed] [Google Scholar]
- Davies, P.L. and Hew, C.L. 1990. Biochemistry of fish antifreeze proteins. FASEB J. 4 2460–2468. [DOI] [PubMed] [Google Scholar]
- Davies, P.L. and Sykes, B.D. 1997. Antifreeze proteins. Curr. Opin. Struct. Biol. 7 828–834. [DOI] [PubMed] [Google Scholar]
- Duman, J.G. 2001. Antifreeze and ice nucleator proteins in terrestrial arthropods. Annu. Rev. Physiol. 63 327–357. [DOI] [PubMed] [Google Scholar]
- Dunbrack Jr., R.L. and Karplus, M. 1994. Conformational analysis of the backbone-dependent rotamer preferences of protein sidechains. Nat. Struct. Biol. 1 334–340. [DOI] [PubMed] [Google Scholar]
- Fletcher, G.L., Hew, C.L., and Davies, P.L. 2001. Antifreeze proteins of teleost fishes. Annu. Rev. Physiol. 63 359–390. [DOI] [PubMed] [Google Scholar]
- Graether, S.P., Kuiper, M.J., Gagné, S.M., Walker, V.K., Jia, Z., Sykes, B.D., and Davies, P.L. 2000. β-helix structure and ice-binding properties of a hyperactive antifreeze protein from an insect. Nature 406 325–328. [DOI] [PubMed] [Google Scholar]
- Graether, S.P., Slupsky, C.M., Davies, P.L., and Sykes, B.D. 2001. Structure of type I antifreeze protein and mutants in supercooled water. Biophys. J. 81 1677–1683. [DOI] [PMC free article] [PubMed] [Google Scholar]
- Graham, L.A., Liou, Y.-C., Walker, V.K., and Davies, P.L. 1997. Hyperactive antifreeze protein from beetles. Nature 388 727–728. [DOI] [PubMed] [Google Scholar]
- Gronwald, W., Chao, H., Reddy, D.V., Davies, P.L., Sykes, B.D., and Sönnichsen, F.D. 1996. NMR characterization of side chain flexibility and backbone structure in the type I antifreeze protein at near freezing temperatures. Biochemistry 35 16698–16704. [DOI] [PubMed] [Google Scholar]
- Haymet, A.D.J., Ward, L.G., Harding, M.M., and Knight, C.A. 1998. Valine substituted winter flounder ‘antifreeze’: Preservation of ice growth hysteresis. FEBS Lett. 430 301–306. [DOI] [PubMed] [Google Scholar]
- Haymet, A.D.J., Ward, L.G., and Harding, M.M. 1999. Winter flounder "antifreeze" proteins: Synthesis and ice growth inhibition of analogues that probe the relative importance of hydrophobic and hydrogen-bonding interactions. J. Am. Chem. Soc. 121 941–948. [Google Scholar]
- Houston Jr., M.E., Chao, H., Hodges, R.S., Sykes, B.D., Kay, C.M., Sönnichsen, F.D., Loewen, M.C., and Davies, P.L. 1998. Binding of an oligopeptide to a specific plane of ice. J. Biol. Chem. 273 11714–11718. [DOI] [PubMed] [Google Scholar]
- Jeener, J., Meier, B.H., Bachmann, P., and Ernst, R.R. 1979. Investigation of exchange processes by two-dimensional NMR spectroscopy. J. Chem. Phys. 71 4546–4553. [Google Scholar]
- Jia, Z. and Davies, P.L. 2002. Antifreeze proteins: An unusual receptor-ligand interaction. Trends Biochem Sci. 27 101–106. [DOI] [PubMed] [Google Scholar]
- Karplus, M. 1959. Contact electron-spin coupling of nuclear magnetic moments. J. Chem. Phys. 30 11–15. [Google Scholar]
- ———. 1963. Vicinal proton coupling in nuclear magnetic resonance. J. Am. Chem. Soc. 85 2870–2871. [Google Scholar]
- Kim, Y. and Prestegard, J.H. 1989. Measurement of vicinal couplings from cross peaks in COSY spectra. J. Magn. Reson. 84 9–13. [Google Scholar]
- Kimura, S.R., Brower, R.C., Vajda, S., and Camacho, C.J. 2001. Dynamical view of the positions of key side chains in protein-protein recognition. Biophys. J. 80 635–642. [DOI] [PMC free article] [PubMed] [Google Scholar]
- Knight, C.A. and Wierzbicki, A. 2001. Adsorption of biomolecules to ice and their effects upon ice growth. 2. A discussion of the basic mechanism of "antifreeze" phenomena. Cryst. Growth Des. 1 439–446. [Google Scholar]
- Knight, C.A., Cheng, C.C., and DeVries, A.L. 1991. Adsorption of α-helical antifreeze peptides on specific ice crystal surface planes. Biophys. J. 59 409–418. [DOI] [PMC free article] [PubMed] [Google Scholar]
- Kraulis, P.J. 1991. Molscript—A program to produce both detailed and schematic plots of protein structures. J. Appl. Crystallogr. 24 946–950. [Google Scholar]
- Liou, Y.-C., Daley, M.E., Graham, L.A., Kay, C.M., Walker, V.K., Sykes, B.D., and Davies, P.L. 2000a. Folding and structural characterization of highly disulfide-bonded beetle antifreeze protein produced in bacteria. Protein Expr. Purif. 19 148–157. [DOI] [PubMed] [Google Scholar]
- Liou, Y.-C., Tocilj, A., Davies, P.L., and Jia, Z. 2000b. Mimicry of ice structure by surface hydroxyls and water of a β-helix antifreeze protein. Nature 406 322–324. [DOI] [PubMed] [Google Scholar]
- Marshall, C.B., Daley, M.E., Graham, L.A., Sykes, B.D., and Davies, P.L. 2002. Identification of the ice-binding face of antifreeze protein from Tenebrio molitor. FEBS Lett. 529 261–267. [DOI] [PubMed] [Google Scholar]
- Merritt, E.A. and Bacon, D.J. 1997. Raster3D: Photorealistic molecular graphics. Methods Enzymol. 277 505–524. [DOI] [PubMed] [Google Scholar]
- Rance, M., Sørensen, O.W., Bodenhausen, G., Wagner, G., Ernst, R.R., and Wüthrich, K. 1983. Improved spectral resolution in COSY 1H NMR spectra of proteins via double quantum filtering. Biochem. Biophys. Res. Commun. 117 479–485. [DOI] [PubMed] [Google Scholar]
- Raymond, J.A. and DeVries, A.L. 1977. Adsorption inhibition as a mechanism of freezing resistance in polar fishes. Proc. Natl. Acad. Sci. 74 2589–2593. [DOI] [PMC free article] [PubMed] [Google Scholar]
- Sicheri, F. and Yang, D.S.C. 1995. Ice-binding structure and mechanism of an antifreeze protein from winter flounder. Nature 375 427–431. [DOI] [PubMed] [Google Scholar]
- Sidebottom, C., Buckley, S., Pudney, P., Twigg, S., Jarman, C., Holt, C., Telford, J., McArthur, A., Worrall, D., Hubbard, R., et al. 2000. Heat-stable antifreeze protein from grass. Nature 406 256. [DOI] [PubMed] [Google Scholar]
- Wüthrich, K. 1986. NMR of proteins and nucleic acids. J. Wiley, New York.
- Wen, D. and Laursen, R.A. 1992. A model for binding of an antifreeze polypeptide to ice. Biophys. J. 63 1659–1662. [DOI] [PMC free article] [PubMed] [Google Scholar]
- Wolfram, S. 1996. Mathematica version 3.0. Wolfram Research Inc. http:\\www.wolfram.com.
- Worrall, D., Elias, L., Ashford, D., Smallwood, M., Sidebottom, C., Lillford, P., Telford, J., Holt, C., and Bowles, D. 1998. A carrot leucine-rich-repeat protein that inhibits ice recrystallization. Science 282 115–117. [DOI] [PubMed] [Google Scholar]
- Zhang, W. and Laursen, R.A. 1998. Structure-function relationships in a type I antifreeze polypeptide: The role of threonine methyl and hydroxyl groups in antifreeze activity. J. Biol. Chem. 273 34806–34812. [DOI] [PubMed] [Google Scholar]


