

Abstract
S-adenosyl-L-methionine-dependent methyltransferases (MTs) are abundant, and highly conserved across phylogeny. These enzymes use the cofactor AdoMet to methylate a wide variety of molecular targets, thereby modulating important cellular and metabolic activities. Thermotoga maritima protein 0872 (TM0872) belongs to a large sequence family of predicted MTs, ranging phylogenetically from relatively simple bacteria to humans. The genes for many of the bacterial homologs are located within operons involved in cell wall synthesis and cell division. Despite preliminary biochemical studies in E. coli and B. subtilis, the substrate specificity of this group of more than 150 proteins is unknown. As part of the Midwest Center for Structural Genomics initiative (www.mcsg.anl.gov), we have determined the structure of TM0872 in complexes with AdoMet and with S-adenosyl-L-homocysteine (AdoHcy). As predicted, TM0872 has a typical MT domain, and binds endogenous AdoMet, or co-crystallized AdoHcy, in a manner consistent with other known MT structures. In addition, TM0872 has a second domain that is novel among MTs in both its location in the sequence and its structure. The second domain likely acts in substrate recognition and binding, and there is a potential substrate-binding cleft spanning the two domains. This long and narrow cleft is lined with positively charged residues which are located opposite the S+-CH3 bond, suggesting that a negatively charged molecule might be targeted for catalysis. However, AdoMet and AdoHcy are both buried, and access to the methyl group would presumably require structural rearrangement. These TM0872 crystal structures offer the first structural glimpses at this phylogenetically conserved sequence family.
Keywords: X-ray crystal structure, methyltransferase, AdoMet, AdoHcy, cell division, MraW
Thermotoga maritima protein 0872 (TM0872) is a putative S-adenosyl-L-methionine-dependent methyltransferase (AdoMet-dependent MT). MTs are abundant, and highly conserved across phylogeny. These enzymes use AdoMet to methylate a wide variety of molecular targets, including DNA, RNA, proteins, and small molecules, thereby modulating important cellular and metabolic activities. Produced from methionine and ATP by S-adenosylmethionine synthetase, AdoMet is the predominant methyl donor in the cell, and the exclusive methyl donor for DNA-MTs. In addition to the methylated acceptor, the AdoMet-dependent reaction also yields S-adenosyl-homocysteine (AdoHcy), which must be replaced by AdoMet prior to the next cycle of substrate binding and methylation. Based on sequence homology, TM0872 belongs to the Cluster of Orthologous Groups (COG) designated COG0275, whose 34 members contain a signature AdoMet binding sequence common to all known AdoMet-dependent MTs (Tatusov et al. 1991). Support for the prediction that the members of this family of proteins are MTs is the demonstration that the E. coli homolog, MraW, binds AdoMet in vivo (Carrión et al. 1999).
The substrate for the methylation reaction of COG0275 members has not been determined, but is expected to be conserved. TM0872 sequence homologs are found in many bacteria and in eukaryotes such as Arabadopsis, Drosophila, mice, and humans. Except for the small number of residues believed to mediate AdoMet binding, the TM0872 sequence family contains no significant sequence homology to the numerous characterized MTs with varied MT substrate specificities. However, in E. coli, MraW is located in an operon that encodes genes involved in cell wall metabolism and cell division, suggesting that the target of MraW may be involved in these cellular events. Other proteins in the same operon have been characterized, and include the peptidoglycan biosynthesis enzymes ftsI, MurE, MurD, MurG, MurC, MraY, and ddIB, and the cell division proteins ftsL, ftsW, ftsQ, ftsA, ftsZ, and mraZ. Interestingly, low levels of AdoMet result in a partial cell division block in E. coli (Newman et al. 1998).
As part of the Midwest Center for Structural Genomics (MCSG) initiative (www.mcsg.anl.gov), we have determined two crystal structures of TM0872, one in complex with AdoMet, and the other with AdoHcy, each at 1.9 Å resolution. As predicted, the structure of TM0872 reveals a typical AdoMet binding domain, which binds endogenous AdoMet or co-crystallized AdoHcy in a manner consistent with other known MT structures. In addition, there is a unique second domain, which presumably facilitates selection of the unknown methyl acceptor. We also identified a potential substrate-binding cleft spanning the AdoMet domain and the unique second domain. However, the conformation of the protein in our structures is inconsistent with methyl group transfer. AdoMet and AdoHcy are both largely buried, and access to the reactive methyl group would presumably require structural rearrangement.
Results and Discussion
TM0872 belongs to a large sequence family of predicted AdoMet-dependent MTs. These proteins contain a small number of conserved residues known to bind AdoMet in other MTs, and one member, the E. coli homolog MraW, binds AdoMet in vivo (Carrión et al. 1999). The substrate specificity of this group of more than 150 proteins is unknown. Sequence family members, identified by PSI-BLAST (Altschul et al. 1997) analysis, share 30%–43% identity, but show no significant sequence similarity to other MTs. The TM0872 crystal structures presented here offer the first structural glimpses of this phylogenetically conserved sequence family.
Model completeness and quality
Seleno-L-methionine-substituted TM0872 was co-crystallized with AdoHcy for structure determination using MAD phasing (Hendrickson et al. 1985). AdoHcy (0.3 mM) was added because the protein was suspected to be an AdoMet-dependent MT. Because the protein copurified with AdoMet or a mixture of AdoMet and AdoHcy (see below), these crystals are likely to contain a mixture of AdoHcy and AdoMet. The crystal belongs to the cubic space group P213 with cell dimensions a=b=c= 133.4 Å, and α=β=γ= 90 degrees. There are two polypeptides per asymmetric unit. In general, the density for molecule A is better defined than for molecule B, perhaps due to differences in crystal packing. Molecule A makes extensive crystal contacts; molecule B does not. Molecule A residues Se-Met A1 and A295–A299 at the C terminus were disordered, and therefore were not included in the model. Molecule B residues B1–B8, loop residues B274–B280, and C-terminal residues B293–B299 were also not incorporated, due to poor electron density in these regions. In addition, two residues that precede Se-Met 1 and derive from the fusion protein were not observed in either A or B molecules. Residues with incomplete side-chain density were modeled as alanines. These include residues A2, B14, B15, B23–B26, B35, B69, B238, B272, B282, B284, B287, and B292. According to PROCHECK analysis (Laskowski et al. 1993), 87.2% of the protein is in the most favored Ramachandran plot region, and two residues, Asp 24 from A and Glu 23 from B, are in the disallowed region. The final Rwork is 19.7, and Rfree is 21.2. Representative electron density is shown in Figure 1▶. The electron density indicates that the complex is predominately AdoHcy, and the ligand was modeled as AdoHcy. The final 1.9 Å TM0872-AdoHcy model contains 569 protein residues, two AdoHcy molecules, two sulfate ions, and 367 water molecules.
Figure 1.
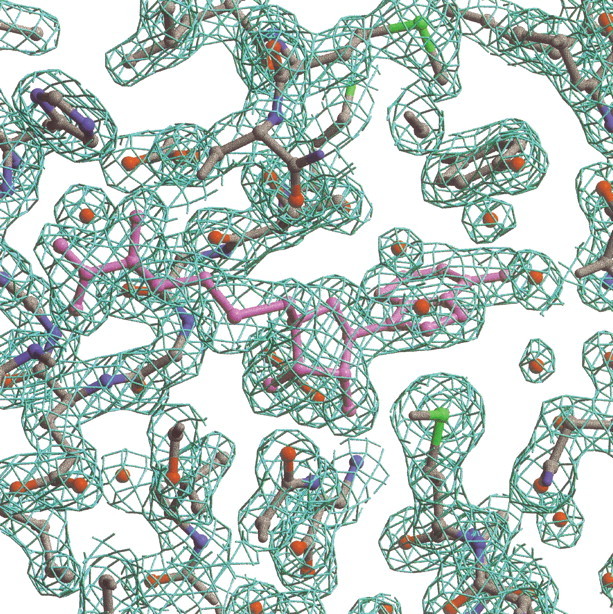
Representative electron density for TM0872-AdoHcy at 1.9 Å resolution. AdoHcy (pink) is in the center. The map was calculated with amplitudes 2Fo-Fc and contoured at 1.5 σ.
The TM0872-AdoMet model was determined by molecular replacement using the AdoHcy complex as a search model. The crystal, with cell dimensions a=b=c= 133.96 Å, and α=β=γ= 90.0 degrees, contained AdoMet or a mixture of AdoMet and AdoHcy that copurified with the protein. The electron density indicated that the ligand in this complex was predominately AdoMet, and was modeled as such. The final 1.9 Å TM0872-AdoMet model contains 562 residues, two AdoMet molecules, two sulfate ions, and 349 water molecules. The crystal contacts seen in the TM0872-AdoHcy model are maintained, again leading to a better defined density for molecule A compared to molecule B. Poor electron density prohibited assignment of molecule A residues A1–A7 and A295–A299 at the C terminus, as well as molecule B residues B1–B8, loop residues B274–B280, and C-terminal residues B293–B299. As for TM0872-AdoHcy, the residues preceding the N terminus were not observed in molecules A and B. Residues modeled as alanines due to incomplete side-chain density include those listed for the TM0872-AdoHcy final model, plus B90 and B95. PROCHECK assessment of model quality assigns 90.2% of the protein to the most favored Ramachandran plot region, and no residues to the disallowed region. The final Rwork is 20.5, and Rfree is 22.6. A summary of data collection and refinement statistics is given in Table 1▶.
Table 1.
Summary of data collection and refinement statistics for the crystal structures TM0872-AdoHcy and TM0872-AdoMet
| Crystal details | TM0872-AdoHcy complex | TM0872-AdoMet complex | ||
|---|---|---|---|---|
| Unit cell parameters | a,b,c = 133.4 Å, α,β,γ = 90.30° | a,b,c = 133.96 Å, α,β,γ = 90.0° | ||
| Space group | P213 (#198) | P213 (#198) | ||
| MW of 301 a.a. Se-Met protein | 35,556 Da | 35,556 Da | ||
| Protein Molecules per A.U. | 2 | 2 | ||
| Se-Met per A.U. | 10 | 10 | ||
| Collection and reduction | ||||
| Wavelength (Å) | Edge | Peak | High | Single Wavelength |
| 0.9787 | 0.9785 | 0.9537 | 0.9785 | |
| Resolution limit (Å) | 1.90 | 1.90 | 1.95 | 1.90 |
| No. of total reflections | 876,154 | 854,224 | 876,520 | 1,623,397 |
| No. of unique reflections | 62,517 | 62,341 | 57,755 | 63,197 |
| % completeness (last shell) | 99.9 (99.3) | 99.9 (99.7) | 100.0 (99.9) | 99.8 (99.9) |
| I/σ (last shell) | 19.9 (4.0) | 22.0 (4.7) | 25.1 (5.6) | 29.0 (4.7) |
| % Rmerge (last shell) | 8.0 (39.6) | 7.2 (34.1) | 6.7 (35.4) | 7.9 (38.6) |
| Figure of Merit | 0.49 | N/A | ||
| Refinement | ||||
| Resolution range (Å) | 20-1.9 | 20-1.9 | ||
| No. unique reflections | 60,592 | 63,068 | ||
| % Rwork (% Rfree) | 19.7 (21.2) | 20.5 (22.6) | ||
| Rmsd | bonds 0.008 Å, angles 1.3° | bonds 0.007 Å, angles 1.2° | ||
| No. of protein residues | 569 of 602 | 562 of 602 | ||
| No of other molecules | 367 waters, 2 sulfates, 2 AdoHcy | 349 waters, 2 sulfates, 2 AdoMet | ||
| Mean B factor (Å2) | 37.20 | 40.5 | ||
TM0872 topology
As predicted, the TM0872 structure reveals a typical seven β-strand α/β core AdoMet binding domain. In addition, there is a unique second domain, which is inserted in the middle of the protein sequence and is thought to affect target selectivity. A ribbon diagram of the TM0872-AdoHcy complex is given in Figure 2▶ (molecule A is shown in Fig. 2▶ and all subsequent figures). The order of β-strands in MT domains is β3-β2-β1-β4-β5-β7-β6 (Cheng 1995). The MT domain is very similar to the Rossman-fold nucleotide-binding domain, except that it contains an antiparallel β7-strand inserted between strands β5 and β6 (Bujnicki 1999). The AdoMet domain of TM0872 (residues 8–105 and 217–294) is similar to other MTs and Rossman-fold proteins, according to DALI structure searches (Holm and Sander 1993). MTs scored the highest, with Z scores between 17.0 and 9.1, whereas NAD-dependent dehydrogenases and reductases gave a Z score of less than 10.0.
Figure 2.
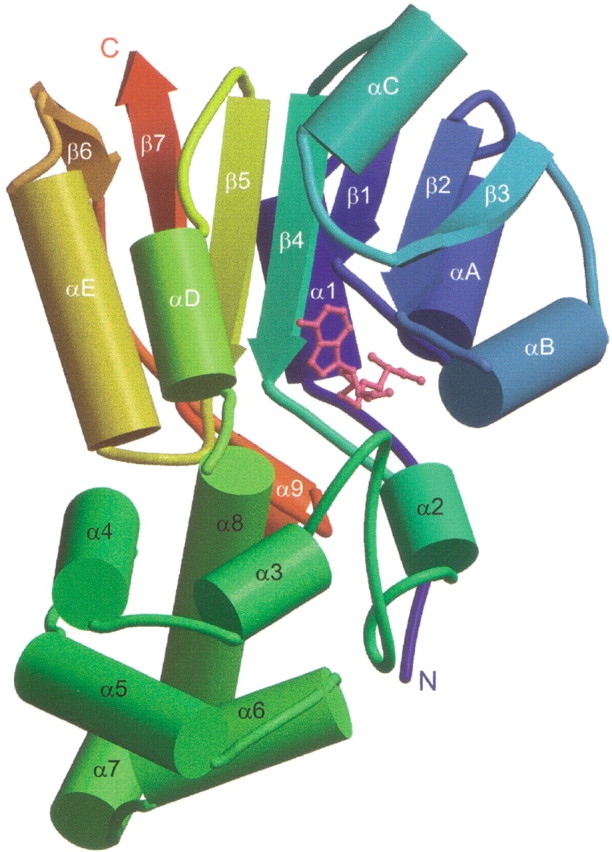
Ribbon drawing of TM0872-AdoHcy. α Helices are drawn as cylinders. The protein is colored blue to red from N to C terminus. AdoHcy, colored pink, binds in the cleft between the two domains. The secondary structural elements common among MT domains are labeled β1–β7 and αA–αE, consistent with standard nomenclature. α Helices α2–α8, located in the second domain, are unique to TM0872.
Outside the core α/β AdoMet domain, there are notable topological differences among MT structures. For example, the α-helix between β1 and β4 originates from the N terminus in TM0872 (α1), but consists of C-terminal residues in some MTs. In addition, TM0872 and rat catechol-O MT (Vidgren et al. 1994) have relatively simple AdoMet domains, whereas others may have additional α-helices and/or β-strands flanking the central β-sheet. The length of the β-strands can also differ; β6 of TM0872 is greatly reduced in length, resulting in an extensive random coil region before and after this short β-strand.
TM0872 has a second domain that is novel among MTs in both its location in the sequence and its structure. We presume that this domain facilitates selection of the unknown methyl acceptor. The roughly 110-amino-acid (aa) domain is inserted between β4 and β5 of the AdoMet domain, which is simply a loop connection or a single α-helix in all other MT structures known to date (Martin and McMillan 2002). Of the known MT structures, the recognition domains are most often inserted at the N or C terminus of the protein. However, more complex topological arrangements are also possible. For instance, the recognition domain of mycolic acid cyclopropane synthases from M. tuberculosis consists of α-helices inserted after β5 and β6 of the AdoMet domain (Huang et al. 2002). The second domain of TM0872 is also unusual in its structure. A DALI search of the PDB database using this α-helical domain (α2–α8) identifies no structures with significant similarity.
TM0872 AdoMet binding motifs and specific interactions
The superposition of TM0872-AdoMet with other MT complexes shows that the ligands superimpose to the same degree as the AdoMet domains. Specifically, AdoMet is oriented to interact with protein residues near the C terminus of β-strands 1 through 4. Although there is a strong spatial correlation of AdoMet binding regions, the sequence identity of specific residues contacting AdoMet varies among different MT sequence families. The TM0872 sequence family appears to have little sequence conservation with other MTs. Even so, we have identified four AdoMet-binding motifs that have spatial and functional homology with other MTs.
AdoHcy-TM0872 interactions are shown in Figure 3▶, and described in Table 2▶. Motif I is the most common AdoMet binding signature, a glycine-rich loop region between β1 and αA with consensus 30DxTxGxG/AGH38. This region forms the binding pocket surrounding the L-homocysteine portion of AdoHcy. In the case of TM0872, Glu 35, Gly 36, Gly 37, and His 38 all make hydrogen bonds to the carboxylate moiety of AdoHcy via their backbone NH group. Commonly, other MT structures also contain an acidic residue at the end of β2, which forms hydrogen bonds with the ribose hydroxyls of AdoHcy. In TM0872, the key motif II residue is Asp 55, which interacts strongly with O2′ and O3′ hydroxyls and is found within the consensus sequence 55DxD57. Val 56 is in Van der Waals contact with the adenine ring. Although this residue is often a hydrophobic residue performing the same function in other MTs, it is most often an arginine or glutamine in other TM0872 family members. Asp 57 does not directly interact with AdoHcy, but instead may act in a supportive role by orienting Asp 55 and the conserved Gln 110, which hydrogen-bonds to the O2′ hydroxyl group of AdoHcy. Motif III binds the adenine ring, and is located in the β3–αC loop region. Ser 81 and Tyr 82 satisfy the motif III criteria, although the only sequence conservation (among TM0872 family members) consists of a tyrosine or phenylalanine residue at position 82. The OγH of Ser 81 and the mainchain NH of Tyr 82 form hydrogen bonds to N1 and N6 of adenine, respectively. In addition, the Tyr 82 ring and the adenine ring form a π-stacking interaction. Motif IV, with the consensus sequence 103DLGxS107, consists of residues from β4 (Asp 103 and Leu 104), and the loop connecting the AdoMet and "recognition" domains (Gly 105–Ser 107). These residues form the binding pocket around the amino acid of AdoHcy, and Asp 103 forms a hydrogen bond with the NH3 of AdoHcy.
Figure 3.

AdoMet and AdoHcy protein complexes. (A) Ball-and-stick drawings of TM0872 ligand interactions. For ease in comparison, protein–ligand complexes have been superimposed using protein Cα positions. Important protein residues are labeled according to their one-letter abbreviation. Protein oxygen atoms and waters are colored red, and protein nitrogen atoms blue. Dashed lines represent hydrogen bonds between AdoHcy (pink) and TM0872 (gray). Also shown are AdoMet in solid green, and the protein residues (green), which differ significantly in their position in the two crystal complexes. (B) Ball-and-stick drawings of ligands are combined with simulated annealing omit density for each. For simplicity, only AdoMet, AdoHcy, and WAT 93 are shown. After omitting AdoMet or AdoHcy and WAT 93 from the model, maps were calculated with coefficients Fo-Fc and are contoured at 3.0 σ. SA-omit density is shown in light green for AdoMet and in plum for AdoHcy and WAT 93.
Table 2.
Interactions between TM0872 and AdoHcy in the co-crystallized complex
| AdoHcy atoms | Interatomic distances in Å | Atoms in TM0872 | Motif | Region in TM0872 |
|---|---|---|---|---|
| O (COO−) | 2.66 | NE2 of H8 | N | N terminus |
| O (COO−) | 3.15 | N of E35 | I | Loop β1-αA |
| O (COO−) | 3.32 | N of G36 | I | Loop β1-αA |
| O (COO−) | 3.09 | N of G37 | I | αA |
| OXT (COO−) | 3.32 | N of G37 | I | αA |
| OXT (COO−) | 3.16 | N of H38 | I | αA |
| NH3 | 2.88 | OD2 of D103 | IV | β4 |
| NH3 | 2.87 | WAT 13 | — | — |
| O2′ | 2.65 | OD1 of D55 | II | End of β2 |
| O2′ | 3.04 | NE2 of Q110 | — | α2 |
| O3′ | 2.57 | OD2 of D55 | II | End of β2 |
| O4′ | 3.15 | WAT 153 | — | — |
| N1 | 2.93 | N of Y82 | III | Loop β3-αC |
| N6 | 3.03 | OH of S81 | III | Loop β3-αC |
| N6 | 3.27 | WAT 32 | — | — |
| N7 | 3.02 | WAT 82 | — | — |
| N7 | 2.81 | WAT 32 | — | — |
| Hydrophobic interactions | ||||
| Adenine ring | V56 | II | Loop β2-αB | |
| Adenine ring | Y82 | III | Loop β3-αC | |
| Adenine ring and ribose | M130 | — | Loop 2-α3 | |
AdoHcy is held in place by several residues that are unique to the TM0872 family. N-terminal residues with the sequence 8HxxV11 border the carboxylate moiety of AdoHcy. His 8, the first conserved residue in the TM0872 sequence family, makes a strong hydrogen bond to the carboxylate of AdoHcy with its backbone NH. Located in the short helix (α2) at the beginning of the second domain, the side chain of Gln 110 reaches across the domain divide to contact the ribose O2′ hydroxyl. Found among a well conserved stretch of amino acids in the long α2–α3 loop (126LDMRM130), Se-Met 130 is in van der Waals contact with both the adenine and ribose. In addition, residues Asn 216, Glu 218, and Asn 221 help establish the adenine-binding pocket. Residues Asn 216 and Glu 218 are part of a conserved stretch of amino acids starting in α8, and ending in αD of the AdoMet domain. The consensus sequence is 208FQA/GxRIxI/VNxEL219. Last, conserved Arg 282 from the α9–β7 loop (consensus N280xRAxSA/SxxR289) lies closely below Cα of L-homocysteine.
The interactions described above hold for the TM0872-AdoMet complex, with few exceptions. These differences are shown in Figure 3A▶. His 8 and Arg 282 move significantly. Unlike the AdoHcy-protein complex, His 8 does not form a hydrogen bond with AdoMet, and Arg 282 now lies close to the S+-CH3 bond rather than the Cα position. Motif IV residues Asp 103 to Ser 107, which lie directly across from the S+-CH3 bond, move to accommodate the methyl group. The backbone carbonyl of Leu 104 is rotated toward the S+-CH3 bond, perhaps to assist the carbonyl oxygens of Asp 103 and Gly 105 in stabilizing the positive charge on the sulfur. Asp 103 and Arg 282 side chains move into direct hydrogen-bonding distance rather than coordinating indirectly via WAT 93. In the AdoHcy complex, WAT 93 is 3.5 Å away from the ligand sulfur. This position is not sterically allowed, and is not observed, in the complex that is predominately AdoMet. The two different complexes have been described as AdoHcy and AdoMet complexes. However, in both cases the crystals are likely to contain mixtures of AdoMet and AdoHcy. As is apparent from the original and final simulated annealing (SA) omit maps, the predominant species crystallized from the endogenous mixture is AdoMet. On the other hand, the protein incubated and crystallized in the presence of 0.3 mM AdoHcy clearly does not have significant density for the methyl group (Fig. 3B▶).
TM0872 sequence family alignment and conservation mapping
A Clustal X (Jeanmougin et al. 1998) alignment for TM0872 and a diverse set of prokaryotic and eukaryotic homologs is shown in Figure 4▶. The conserved AdoMet binding regions are marked, and the level of conservation of residues among COG0275 members (COG0275 alignment not shown) is indicated. The sequence alignment begins with the first conserved residue, His 8 in the TM0872 sequence. Most proteins have fewer than 20 amino acids prior to His 8, although A. thaliana has 80 extra residues. The C-termini, shown in their entirety, are of similar length. The insertions and deletions among members are all located in TM0872 loop regions. Most of these consist of only a few amino acids; however, the region around β6 varies by as much as 43 aa in length. TM0872 has the fewest number of residues in this region, and the eukaryotic proteins have the most. The sequence conservation among TM0872 family members is generally distributed throughout the length of the sequence.
Figure 4.
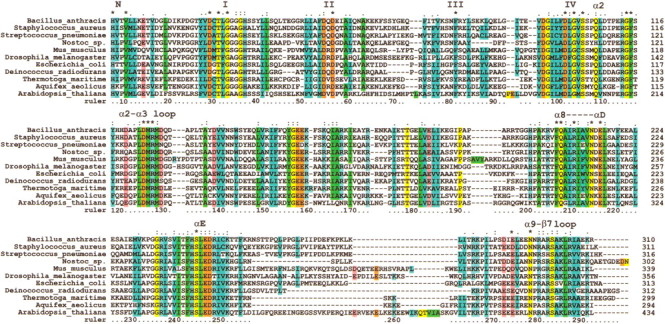
A Clustal X sequence alignment for TM0872 and a diverse set of prokaryotic and eukaryotic homologs. The sequence ruler corresponds to TM0872 sequence numbering. Previously discussed conserved AdoMet binding regions are marked above the residues in which they appear. Numbers I, II, III, and IV correspond to motifs I to IV. Other AdoMet binding regions (N, α2, etc.) are named according to the secondary structural element name in which they appear. Symbols above residues distinguish the level of conservation of that residue among COG0275 members (COG0275 alignment not shown). An asterisk (*) marks invariant residues, whereas a colon (:) identifies residues with greater than 90% identity. A period indicates residues with greater than 80% identity or type (i.e. hydrophobic).
Conserved residues with greater than 90% identity are mapped onto TM0872-AdoHcy in Figure 5A▶–D. In the ribbon drawings 5A and 5B, AdoHcy can be seen extending almost the entire width of the protein. The conserved residues are largely clustered around the AdoHcy and the general region between the two domains. Only 20 of the 60 conserved residues have been assigned a role in forming the binding pocket of AdoMet. The other residues likely have additional, conserved roles. In the absence of a known substrate for the methyltransferase, we can only speculate as to the importance of the remaining conserved amino acids. Nonetheless, most of these 40 conserved residues cluster in the domain interface and putative "recognition domain."
Figure 5.
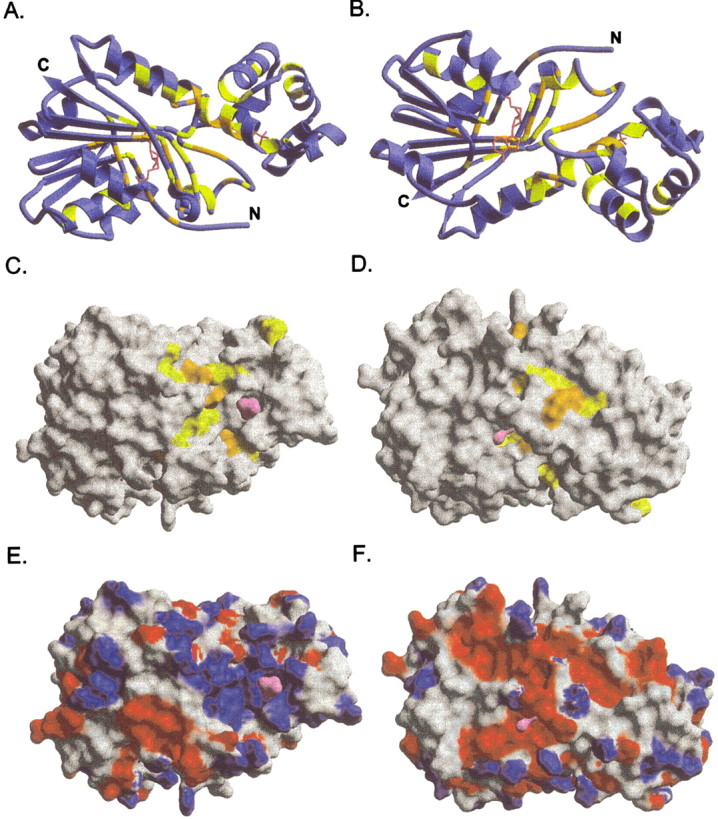
TM0872-AdoHcy ribbon drawing and molecular surface pictures. A,C,E show the same protein orientation. B,D,F are the backside views (180° rotation with respect to the horizontal axis). (A–D) Conserved residues, denoted with either an asterisk or a colon in the sequence alignment, are colored as follows: invariant residues, orange; conserved residues (greater than 90% identity), yellow; AdoHcy and sulfate molecules, pink. Molecular surface panels (E,F) are colored according to the calculated Poisson-Boltzmann charge distribution for TM0872.
Molecular surface representations of TM0872-AdoHcy are shown in Figure 5C▶–F. Although the sulfate ion from the crystallization buffer is clearly visible on the surface of the protein (Fig. 5C▶), the AdoHcy molecule is almost completely buried (Fig. 5C,D). The surface accessibility of AdoHcy and AdoMet was calculated in CNS-1.0 using a 1.4 Å probe radius (Brünger et al. 1998). In both cases, only adenine atoms N6, N7, and C8 are accessible to solvent. From the vantage point shown in Figure 5D▶, N6 of adenine is seen protruding from the protein cavity. Figures 5E and 5F▶ are colored according to the calculated Poisson-Boltzmann protein charge distribution. From the surface pictures, several interesting features emerge. First, the largest cavity in the protein is lined with the greatest number of conserved surface residues (Fig. 5C▶). These include residues Phe 244 to Asp 249 and Ser 285 to Arg 289. The cavity volume, calculated using SURFNET (Laskowski 1995), is 4688 Å3, whereas the AdoHcy pocket measures 2308 Å3. In addition, there is a large positive surface coinciding with the putative substrate-binding pocket (Fig. 5E▶), which suggests that a negatively charged molecule might be targeted to the protein for methylation. Indeed, the sulfate ion bound in this area may represent a binding site for a phosphate-containing substrate. The protein has a theoretical isoelectric point of 7.7, and one might expect the surface to be slightly basic. However, TM0872 appears to have a positive face (Fig. 5E▶), and an equally extreme negative face on the opposite side (Fig. 5F).
Although we have located a potential substrate-binding cleft, the conformation of the protein in our structures seems inconsistent with catalysis. The methyl donor, in absence of the substrate, is simply inaccessible. However, as was shown for C5-cytosine MT complexed with duplex DNA, substrate binding of TM0872 might be accomplished through an induced-fit mechanism (Cheng et al. 1993; Klimasauskas et al. 1994; Kumar et al. 1997; O’Gara et al. 1999). In order for a large substrate to access the reactive methyl group of TM0872, a structural rearrangement is necessary. Modeling suggests that movement of N-terminal residues including His 8, adjacent α9–β7 loop residues including Arg 282, and β4–α2 residues Asp 103 to Thr 108 could make a large enough tunnel for a long and narrow methyl acceptor, such as a lysine or a "flipped" base, to access the methyl group from the binding cleft. There is structural evidence that such a rearrangement is plausible. First, these residues exhibit the greatest conformational changes when AdoHcy replaces AdoMet. Figure 6▶ is a superposition of the AdoHcy and AdoMet protein complexes. AdoMet and AdoHcy adopt virtually the same conformation when bound to the protein, make contact via nearly identical amino acids, and the overall rmsd for the protein is about 0.5 Å for Cα positions. However, conserved methyl sequestering residues and the substrate cleft in proximity to the S+-CH3 bond expand and shift in a non-uniform fashion, resulting in as much as 1.6 Å differences in Cα coordinates, and 5.0 Å for side-chain atoms. In addition, the N-terminal residues observed in TM0872-AdoHcy are disordered and cannot be placed in the AdoMet complex, suggesting that this region is flexible.
Figure 6.

Superposition of TM0872-AdoHcy and TM0872-AdoMet Cα positions. The TM0872-AdoHcy model is colored purple. The TM0872-AdoMet model is colored yellow. A few residues have been labeled which are located in regions with significant rms deviations between the two structures.
The methyltransferase substrate has not been determined, but is expected to be conserved. The genes for many of the bacterial homologs are located within operons involved in cell wall synthesis and cell division, suggesting that the target may be involved in these cellular events. Interestingly, low levels of AdoMet result in a partial cell division block in E. coli (Newman et al. 1998). The reason for the filamentous growth habit in the absence of AdoMet is unknown; however, methylation of cell division proteins by an MT such as the TM0872 homolog MraW has been postulated (Newman et al. 1998; Carrión et al. 1999). MraW, a 313-aa protein, is expressed in the cytosol, and found loosely associated with the membrane when expressed at high levels (Carrión et al. 1999). Although a direct methylation was not demonstrated, biochemical studies of MraW have shown that two unidentified membrane proteins are methylated in MraW-overproducing strains (Carrión et al. 1999). Nonetheless, there is as yet no evidence of direct MraW methylation of important cell wall metabolism and cell division proteins. TM0872 family members could methylate a different set of proteins, DNA, RNA, or lipids in different organisms.
In summary, TM0872 belongs to a large sequence family with diverse phylogenetic members. These proteins are predicted MTs, and our structural findings are consistent with this functional prediction. TM0872 has a two-domain structure and a novel topology. The AdoMet domain consists of the first and last thirds of the protein length, and a unique α-helical domain is inserted in the middle of the protein sequence after β4. This domain is very likely to act in substrate recognition and binding. As with other MT structures, we have identified a potential substrate-binding cleft spanning the two domains. This cavity is the largest in the protein, contains the greatest number of conserved residues, and is positively charged. Although this cavity is the most reasonable candidate for substrate binding, the present structures are not consistent with methyl group transfer. AdoMet is buried, and a structural rearrangement of N-terminal residues, the adjacent α9–β7 loop, and domain linker residues will be required for access of an acceptor to the methyl group and catalysis. Future studies will probe the identity of the TM0872 sequence family methylation target.
Notes
The atomic coordinates and structure factors have been deposited in the RCSB PDB, with accession code 1M6Y for the TM0872-AdoHcy complex, and 1N2X for the TM0872-AdoMet complex.
Materials and methods
Protein cloning, expression, and purification
TM0872 was amplified and cloned, and the protein was expressed and purified according to procedures described by Korolev et al. (2001). Briefly, the TM0872 open reading frame was amplified by PCR from T. maritima genomic DNA (American Type Culture Collection). The gene was cloned into the NdeI and BamHI sites of a modified pET15b cloning vector (Novagen). Modifications included replacing the thrombin cleavage site with a TEV protease cleavage site, followed by a double stop codon downstream from the BamHI site. The resulting construct is an N-terminal His6 tag separated from the gene by a TEV protease recognition site sequence ENLYFQ↓G. The selenomethionine derivative was overexpressed in E. coli BL21-Gold (DE3; Stratagene) containing an extra plasmid encoding three rare tRNAs (AGG and AGA for Arg, and ATA for Ile).
The cells were grown at 37°C in 2 L of M9 minimal media according to a standard methionine production inhibition protocol, and induced with 0.4 mM IPTG at an A600 of 0.6 (Sambrook et al. 1989; Van Duyne et al. 1993). After 4 h, the cells were pelleted and resuspended in 35 mL binding buffer (50 mM HEPES pH 7.5, 5 mM imidazole, 5% glycerol, 0.5 M NaCl, and 2 mM BME). After the addition of protease inhibitors phenylmethylsulfonyl fluoride and benzamidine at 1 mM each, the resupended cells were flash-frozen in liquid nitrogen, and stored at −80°C. Thawed cells were lysed by the addition of 0.5% IGEPAL (Sigma), followed by sonication. The cell lysate was clarified by centrifugation, and the supernatant was purified at 4°C using binding, wash, and elution buffer differing only in their imidazole concentration (5, 30, and 250 mM imidazole for the binding, wash, and elution buffers, respectively). The supernatant was passed through a DE52 column equilibrated in 1M NaCl, followed by 40 mL of binding buffer. The flow-through was then applied to a 5-mL Ni2+-NTA column (Sigma). The column was washed with 200 mL of wash buffer, and the desired protein was eluted with 20 mL of elution buffer. After the addition of 1mM EDTA, his-rTEV protease was added to the eluted protein at a ratio of 60 μg protease to 1000 μg of protein, and the protease-protein sample was dialyzed overnight against 2 L of binding buffer without imidazole. The 90% cleaved protein was separated from the cut His-tag and the His-tagged TEV protease by passage through a second Ni2+ column. The purified protein was then dialyzed against 2 L of 10 mM HEPES pH 7.5, 0.5 M NaCl, 2 mM BME, filtered through a 2-μm filter, and concentrated to 20 mg/mL for crystallization.
TM0872-AdoHcy crystallization and data collection
The SeMet derivatized crystals grew by vapor diffusion in hanging drops. The initial drop contained 50 mM Na Cacodylate pH 6.5, 5 mM HEPES pH 7.5, 0.1 M Ammonium Sulfate, 9% PEG 8000, 0.25 M NaCl, 1 mM BME, 0.3 mM S-adenosyl-L-homocysteine, and 10 mg/mL protein. The well solution contained 0.1 M Na cacodylate pH 6.5, 0.2 M ammonium sulfate, and 18% PEG 8000. Crystals were observed after 10 d at 4°C. A single 0.3 × 0.3 × 0.15 mm crystal was soaked in crystallization buffer containing 25% glycerol for cryoprotection. After 5 min, the crystal was flash-cooled in liquid nitrogen. The crystal belonged to the cubic space group P213 with cell dimensions a=b=c= 133.4 Å, and α=β=γ= 90 degrees. The absorption edge of Se was determined by fluorescence. A three-wavelength MAD data set was measured at the DuPont-Northwestern-Dow Collaborative Access Team (DND-CAT) 5IDB Beamline at the Advanced Photon Source (APS). The 1.9 Å data with 13.7-fold redundancy were integrated using DENZO and scaled using SCALEPACK (Otwinowski and Minor 1997).
TM0872-AdoHcy initial-phase calculation and refinement
The asymmetric unit contains two protein monomers, and five seleno-methionines per monomer. Seven of the ten Se atoms in the asymmetric unit were identified by SOLVE-2.02 (Terwilliger and Berendzen 1999). The MAD map was then subjected to density modification using the RESOLVE subroutine in SOLVE-2.02, and allowed autotracing of 415 of the 602 protein residues with RESOLVE or 405 with wARP (Perrakis et al. 1999). In addition, both programs completed most of molecule A, and only the middle region (∼120 residues) of molecule B. However, the wARP maps and model resulting from iterative rounds of model assignment, map calculation, and real-space torsional refinement of protein side chains were of superior quality to the twofold noncrystallographic symmetry (NCS) averaged maps and model from RESOLVE. NCS was particularly useful in the initial stages of model building and refinement in O and CNS-1.0, respectively (Jones et al. 1991; Brünger et al. 1998). Although the crystallization solution may contain residual AdoMet from protein purification, the electron density for the methyl group was not apparent. Therefore, the ligand was modeled as AdoHcy. After iterative rounds of model building in O and refinement in CNS (simulated annealing, positional minimization, water molecule identification, individual isotropic B refinement), the final Rwork is 19.7 and Rfree is 21.2. A summary of data collection and refinement statistics is given in Table 1▶.
TM0872-AdoMet crystallization and data collection
TM0872-AdoMet SeMet crystals were grown and cryoprotected as described above, except that AdoHcy or AdoMet was not added. Cell dimensions are a=b=c= 133.96 Å, and α=β=γ= 90.0 degrees. A 1.9 Å single wavelength data set was collected using the 5-IDB Beamline at the APS. The 25.7-fold redundant data were processed using DENZO and SCALEPACK.
TM0872-AdoMet molecular replacement and refinement
The TM0872-AdoMet structure was solved by molecular replacement using the TM0872-AdoHcy model. The electron density was interpreted and modeled as AdoMet rather than AdoHcy. AdoMet, in these crystals, originated from the endogenous AdoMet population located within the E. coli host cells. CNS-1.0 and O were used for refinement and model building, respectively (Brünger et al. 1998; Jones et al. 1991). The final Rwork is 20.5 and Rfree is 22.6. Refer to Table 1▶ for data collection and refinement statistics.
Figures
Figures 1 and 3B▶▶ were generated by Bobscript (Esnouf 1997) and Raster3D (Merritt and Bacon 1997). Figures 2, 3A, 5A, 5B, and 6▶▶▶▶▶ were generated by MOLSCRIPT (Kraulis 1991) and Raster3D. Figure 4▶ was generated by Clustal X (Jeanmougin et al. 1998). Figures 5C▶–E were generated by Bonds3D (developmental software, D. Still, pers. comm.) and Raster3D.
Acknowledgments
We thank Pam Focia for critical reading of this manuscript and Tatiana Skarina for technical assistance. Support for D.J.M. is partially provided by the grant NIH-T32-AG00260. This research is part of the Midwest Center for Structural Genomics that is supported by grant NIH-GM-62414 and the Ontario Research and Development Challenge Fund. Portions of this work were performed at the DuPont-Northwestern-Dow Collaborative Access Team (DND-CAT) Synchrotron Research Center located at Sector 5 of the Advanced Photon Source (APS). DND-CAT is supported by the E.I. DuPont de Nemours & Co., the Dow Chemical Co., the U.S. National Science Foundation, and the State of Illinois. Use of the APS was supported by the U.S. Department of Energy, Basic Energy Sciences, and DND-CAT. The publication costs of this article were defrayed in part by payment of page charges. This article must therefore be hereby marked "advertisement" in accordance with 18 USC section 1734 solely to indicate this fact.
Article and publication are at http://www.proteinscience.org/cgi/doi/10.1110/ps.0302403.
References
- Altschul, S.F., Madden, T.L., Schaffer, A.A., Zhang, J., Zhang, Z., Miller, W., and Lipman, D.J. 1997. Gapped BLAST and PSI-BLAST: A new generation of protein database search programs. Nucleic Acids Res. 25 3389–3402. [DOI] [PMC free article] [PubMed] [Google Scholar]
- Brünger, A.T., Adams, P.D., Clore, G.M., Delano, W.L., Gros, P., Grosse-Kunstleve, R.W., Jiang, J.-S., Kuszewski, J., Nilges, M., Pannu, N.S., et al. 1998. Crystallography and NMR system: A new software suite for macromolecular structure determination. Acta Crystallogr. 54 905–921. [DOI] [PubMed] [Google Scholar]
- Bujnicki, J.M. 1999. Comparison of protein structures reveals monophyletic origin of AdoMet-dependent methyltransferase family and mechanistic convergence rather than recent differentiation of N4-cytosine and N6-adenine DNA methylation. In Silico Biol. 1 175–182. [PubMed] [Google Scholar]
- Carrión, M., Gomez, M.J., Merchante-Schubert, R., Dongarra, S., and Ayala, J.A. 1999. mraW, an essential gene at the dcw cluster of Escherichia coli codes for a cytoplasmic protein with methyltransferase activity. Biochimie 81 879–888. [DOI] [PubMed] [Google Scholar]
- Cheng, X. 1995. Structure and function of DNA methyltransferases. Annu. Rev. Biophys. Biomol. Struct. 24 293–318. [DOI] [PubMed] [Google Scholar]
- Cheng, X., Kumar, S., Posfai, J., Pflugrath, J.W., and Roberts, R.J. 1993. Crystal structure of the HhaI DNA methyltransferase complexed with S-adenosyl-L-methionine. Cell 74 299–307. [DOI] [PubMed] [Google Scholar]
- Esnouf, R.E. 1997. An extensively modified version of MolScript that includes greatly enhanced coloring capabilities. J. Mol. Graph. 15 132–134. [DOI] [PubMed] [Google Scholar]
- Hendrickson, W.A., Smith, J.L., and Sheriff, S. 1985. Direct phase determination based on anomalous scattering. Methods Enzymol. 115 41–55. [DOI] [PubMed] [Google Scholar]
- Holm, L., and Sander, C. 1993. Protein structure comparison by alignment of distance matrices. J. Mol. Biol. 233 123–138. [DOI] [PubMed] [Google Scholar]
- Huang, C.-C., Smith, C.V., Glickman, M.S., Jacobs Jr., W.R., and Sacchettini, J.C. 2002. Crystal structures of mycolic acid cyclopropane synthases from Mycobacterium tuberculosis. J. Biol. Chem. 277 11559–11569. [DOI] [PubMed] [Google Scholar]
- Jeanmougin, F., Thompson, J.D., Gouy, M., Higgins, D.G., and Gibson, T.J. 1998. Multiple sequence alignment with Clustal X. Trends Biochem. Sci. 23 403–405. [DOI] [PubMed] [Google Scholar]
- Jones, T.A., Zou, J.Y., Cowan, S.W., and Kjeldgaard, M. 1991. Improved methods for building protein models in electron density maps and the location of errors in these models. Acta Crystallogr. 47 110–119. [DOI] [PubMed] [Google Scholar]
- Klimasauskas, S., Kumar, S., Roberts, R.J., and Cheng, X. 1994. HhaI methyltransferase flips its target base out of the DNA helix. Cell 76 357–369. [DOI] [PubMed] [Google Scholar]
- Korolev, S., Ikeguchi, Y., Skarina, T., Beasley, S., Edwards, A., Joachimiak, A., Pegg, A.E., and Savchenko, A. 2001. Nat. Struct. Biol. 9 27–31. [DOI] [PMC free article] [PubMed] [Google Scholar]
- Kraulis, P.J. 1991. MOLSCRIPT—A program to produce both detailed and schematic plots of protein structures. J. Appl. Cryst. 24 946–950. [Google Scholar]
- Kumar, S., Horton, J.R., Jones, G.D., Walker, R.T., Roberts, R.J., and Cheng, X. 1997. DNA containing 4′thio-2′-deoxycytidine inhibits methylation by HhaI methyltransferase. Nucleic Acids Res. 25 2773–2783. [DOI] [PMC free article] [PubMed] [Google Scholar]
- Laskowski, R.A. 1995. A program for visualizing molecular surfaces, cavities, and intermolecular interactions. J. Mol. Graph. 13 323–330. [DOI] [PubMed] [Google Scholar]
- Laskowski, R.A., MacArthur, M.W., Moss, D.S., and Thornton, J.M. 1993. PROCHECK: A program to check the stereochemical quality of protein structures. J. Appl. Cryst. 26 283–291. [Google Scholar]
- Martin, J.L. and McMillan, F.M. 2002. SAM (dependent) I AM: The S-adenosylmethionine-dependent methyltransferase fold. Curr. Opin. Struct. Biol. 12 783–793. [DOI] [PubMed] [Google Scholar]
- Merritt, E.A. and Bacon, D.J. 1997. Raster3D photorealistic molecular graphics. Methods Enzymol. 277 505–524. [DOI] [PubMed] [Google Scholar]
- Newman, E.B., Budman, L.I., Chan, E.C., Greene, R.C., Lin, R.T., Woldringh, C.L., and D’Ari, R. 1998. Lack of S-adenosylmethionine results in a cell division defect in Escherichia coli. J. Bacteriol. 180 3614–3619. [DOI] [PMC free article] [PubMed] [Google Scholar]
- O’Gara, M., Zhang, X., Roberts, R.J., and Cheng, X. 1999. Structure of a binary complex of HhaI methyltransferase with S-adenosyl-L-methionine formed in the presence of a short nonspecific DNA oligonucleotide. J. Mol. Biol. 287 201–209. [DOI] [PubMed] [Google Scholar]
- Otwinowski, Z. and Minor, W. 1997. Processing of X-ray diffraction data collected in oscillation mode. In Macromolecular crystallography (eds. C.W. Carter Jr. and R.M. Sweet), Vol. 276(A), pp. 307–326. Academic Press, New York. [DOI] [PubMed]
- Perrakis, A., Morris, R.J., and Lamzin, V.S. 1999. Automated protein modeling combined with iterative structure refinement. Nat. Struct. Biol. 6 458–463. [DOI] [PubMed] [Google Scholar]
- Sambrook, J., Fritsch, E.F., and Maniatis, T. 1989. Molecular cloning: A laboratory manual, 2nd ed. Cold Spring Harbor Laboratory Press, Cold Spring Harbor, NY.
- Tatusov, R.L., Natale, D.A., Garkavtsev, I.V., Tatusova, T.A., Shankavaram, U.T., Rao, B.S., Kiryutin, B., Galperin, M.Y., Fedorova, N.D., and Koonin, E.V. 1991. The COG database: New developments in phylogenetic classification of proteins from complete genomes. Nucleic Acids Res. 29 22–28. [DOI] [PMC free article] [PubMed] [Google Scholar]
- Terwilliger, T.C. and Berendzen, J. 1999. Automated MAD and MIR structure solution. Acta Crystallogr. 55 849–861. [DOI] [PMC free article] [PubMed] [Google Scholar]
- Van Duyne, G.D., Standaert, R.F., Karplus, P.A., Schreiber, S.L., and Clardy, J. 1993. Atomic structures of the human immunophilin FKBP-12 complexes with FK506 and rapamycin. J. Mol. Biol. 229105–124. [DOI] [PubMed] [Google Scholar]
- Vidgren, J., Svensson, L.A., and Liljas, A. 1994. Crystal structure of catechol O-methyltransferase. Nature 368 354–358. [DOI] [PubMed] [Google Scholar]