Abstract
The explosion of biological data resulting from genomic and proteomic research has created a pressing need for data analysis techniques that work effectively on a large scale. An area of particular interest is the organization and visualization of large families of protein sequences. An increasingly popular approach is to embed the sequences into a low-dimensional Euclidean space in a way that preserves some predefined measure of sequence similarity. This method has been shown to produce maps that exhibit global order and continuity and reveal important evolutionary, structural, and functional relationships between the embedded proteins. However, protein sequences are related by evolutionary pathways that exhibit highly nonlinear geometry, which is invisible to classical embedding procedures such as multidimensional scaling (MDS) and nonlinear mapping (NLM). Here, we describe the use of stochastic proximity embedding (SPE) for producing Euclidean maps that preserve the intrinsic dimensionality and metric structure of the data. SPE extends previous approaches in two important ways: (1) It preserves only local relationships between closely related sequences, thus allowing the map to unfold and reveal its intrinsic dimension, and (2) it scales linearly with the number of sequences and therefore can be applied to very large protein families. The merits of the algorithm are illustrated using examples from the protein kinase and nuclear hormone receptor superfamilies.
Keywords: Stochastic proximity embedding, multidimensional scaling, nonlinear mapping, Sammon mapping, self-organizing, dimensionality reduction, protein kinase, nuclear hormone receptor, phylogenetic analysis
The wealth of information provided by genomic sequencing and other high-throughput experimental techniques such as RNA microarrays, yeast two-hybrid screens and quantitative proteomics, has created a need for data mining techniques that extract information from large volumes of data. Sequences are by far the most abundant type, and their comparison has become a critical tool in modern molecular biology. It is now well established that proteins with similar sequence are likely to have evolved from a common ancestor and share common three-dimensional structure and function. Indeed, the most common approach to predict the biological role of a new protein is based on pairwise comparisons with other sequences of known function. This is typically carried out by aligning the two sequences to provide an explicit mapping of their respective amino acid residues and thus reveal the evolutionary events that led to their divergence.
However, in many cases sequences have diverged to such an extent that their common origin cannot be detected by direct comparison. As the number of available sequences grew, it became apparent that this information could be mined more effectively when analyzed in a collective manner. Simplistic pairwise comparisons gave way to more sophisticated multiple sequence alignment techniques (Durbin et al. 1998; Gotoh 1999; Notredame et al. 2000), which can identify conserved patterns shared by multiple sequences and improve the ability to detect weak homologies between distantly related proteins. This information has been organized in several excellent databases of protein families, motifs, and domains (Attwood et al. 2000; Apweiler et al. 2001; Silverstein et al. 2001; Bateman et al. 2002; Falquet et al. 2002) utilizing expert knowledge and suitable clustering methodologies.
Protein classification is rooted in the notion of transitivity, that is, the thesis that two not very similar sequences may have similar function by virtue of their similarity to a third sequence. The relationships among a set of proteins are typically represented in the form of trees derived by hierarchical clustering. One drawback to this representation is the loss of information about the evolutionary distances separating sequences within and between clusters. This limitation has inspired a number of different methods that attempt to capture more fully the rich nature of protein similarities. Some of these methods are based on graphical layout algorithms driven by a set of formal associations, such as BIOLAYOUT (Enright and Ouzounis 2001) and PHYLOGRAPHER (Kozik 2001), while others employ unsupervised machine learning techniques such as Kohonen networks (Ferran et al. 1994; Hanke and Reich 1996).
A very promising alternative is to produce a low-dimensional Euclidean map that best preserves the similarities between the embedded sequences, a method employed by a number of authors, including Agrafiotis (1997), Apostal and Szpankowski (1999), Forster (Forster et al. 1999), Grishin and Grishin (2002), Yona and Levitt (2000), Holm and Sander (1996), and Holm (1998). The classical methods for constructing such a map are multidimensional scaling (MDS) and nonlinear mapping (NLM). Given a set of k objects, a symmetric matrix, rij, of dissimilarities between these objects, and a set of images on an m-dimensional display map {xi, i = 1, 2, . . ., k; xi ∈ ℜ m}, these methods attempt to place xi on the map in such a way that their Euclidean distances dij = ||xi − xj|| approximate as closely as possible the corresponding values rij. The quality of the embedding is determined using a sum-of-squares error function such as Kruskal’s stress,
 |
which is numerically minimized to find the optimum configuration. The actual embedding is carried out in an iterative fashion by (1) generating an initial set of coordinates xi, (2) computing the distances dij, (3) finding a new set of coordinates xi using a steepest descent algorithm, and (4) repeating steps (2) and (3) until the change in the stress function falls below some predefined threshold (Borg and Groenen 1997).
The primary failure of MDS lies in the fact that it tries to preserve all pairwise proximities in the data sample, both local and remote. However, it is well known that conventional distance metrics tend to underestimate the proximity of points on a nonlinear manifold, and lead to erroneous embeddings (Shepard and Carroll 1965; Martinetz and Schulten 1994). Sammon’s nonlinear mapping (NLM) algorithm (Sammon 1969) partly alleviates this problem by introducing a normalization factor in the error function to give increasing weight to short range distances over long range ones:
 |
However, this scheme is arbitrary, and fails with highly folded topologies. A more robust procedure is embodied in the ISOMAP method (Tenenbaum et al. 2000), which uses an estimated geodesic distance instead of the conventional Euclidean one as input to MDS. The geodesic distances are estimated by connecting each point to its nearest neighbors, and then tracing the shortest paths between all pairs of points on the resulting graph. Although it was shown that, in the limit of infinite training samples, ISOMAP recovers the true dimensionality and geometric structure of the data if it belongs to a certain class of Euclidean manifolds, the proof is of little practical use because the (at least) quadratic complexity of the embedding algorithm precludes its use with large data sets. A similar scaling problem plagues locally linear embedding (LLE; Roweis and Saul 2000), a related approach that produces globally ordered maps by constructing locally linear relationships between the data points.
Recently, we introduced an alternative self-organizing algorithm that addresses the key limitations of ISOMAP and LLE (Agrafiotis and Xu 2002). The method, known as stochastic proximity embedding (SPE), builds on the same geodesic principle first proposed and exploited by ISOMAP, but introduces two important algorithmic advances: (1) It circumvents the calculation of estimated geodesic distances, and (2) it uses a pairwise refinement scheme that does not require the complete distance (dij) or proximity (rij) matrix and scales linearly with the number of points.
Here, we describe the use of SPE for producing globally ordered maps of large families of protein sequences. We also describe a procedure for determining a reasonable neighborhood radius by examining the trade-off between the stress function and the number of connected components in the neighborhood graph, and show that the resulting maps reveal well-defined clusters that are consistent with the functional classification of their respective sequences.
Results and Discussion
The goal of generating a low-dimensional map is to reproduce the nonlinear relationships between the protein sequences so that distinct family and subfamily similarities can be detected and visualized. For our distance metric, which is based on a multiple sequence alignment, the input dimensionality corresponds to the total length of the alignment, with each dimension assuming one of 21 possible values (20 amino acids and a gap character).
Protein kinases
The two-dimensional (2D) SPE maps of the kinase domains defined by Hanks and Hunter (1995) and Manning et al. (2002) are shown in Figure 1 ▶. Each of these maps was constructed by attempting to preserve the proximities of all pairs regardless of their separation (i.e., by setting rc = ∞) and are therefore similar to those derived by classical MDS. For the Hanks set, each of the main families (AGC, CaMK, CMGC, and PTK) occupies a broad but distinct region on the map. The exception is the OPK or other protein kinase category, which consists of sequences that do not share strong similarity to any of the other large families. These are largely excluded from the other clusters but do not assume a compact shape. As we noted in our original paper (Agrafiotis 1997), it is intriguing that members of this class include sequences that are believed to exhibit dual specificity; that is, they are capable of phosphorylating both Ser/Thr and Tyr substrates. The only two kinases known to phosphorylate both Ser/Thr and Tyr residues are the members of the MEK family (MEK1 and MEK2), which are located in the middle of the map; in most other cases, dual specificity has been demonstrated only for autophosphorylation reactions in vitro. Nonetheless, it is still remarkable that SPE places most of these sequences in between the Ser/Thr (AGC, CaMK, and CMGC) and Tyr (PTK) clusters, which suggests that they may indeed share some of the structural and functional characteristics of both classes. In addition, there are two outliers in the AGC family, protein kinase C μ (PIR S40279) and protein kinase SPK1 (PIR A39616). Both domains show strongest similarity to CaMK kinases rather than AGC and would be more logically grouped with this family.
Figure 1.
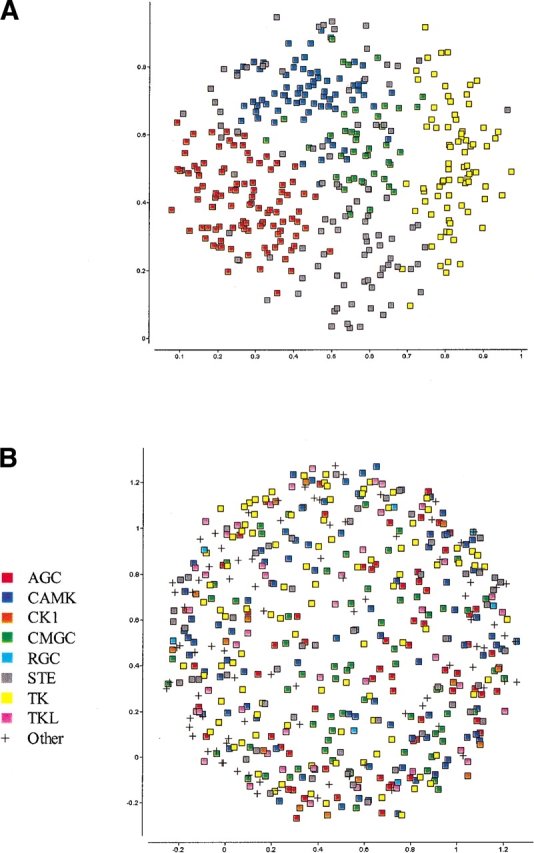
Two-dimensional stochastic proximity embedding of (A) the kinase domains identified and classified by Hanks and Hunter (1995), and (B) the kinase domains identified and classified by Manning et al. (2002). Both maps were constructed using a pairwise distance measure based on a multiple sequence alignment and the PAM250 amino acid exchange matrix.
For the Manning set, the plot (Fig. 1B ▶) is much less useful. The families are spread throughout the map and do not separate from each other to any discernable extent. However, this data contains significant structure, as seen by Manning’s classification and in our subsequent analysis. The increased dimensionality and size of the data set precludes the creation of a meaningful 2D map, suggesting that an alternative approach is required to improve the visualization.
A troubling aspect of these maps, even for the Hanks set, where significant structure is obvious, is the absence of clear boundaries delineating the various families. This is largely due to the fact that like many other metrics used to compare physical observations, sequence similarity is valid only on a local scale. Although we can infer with confidence the evolutionary distance between two protein sequences when their dissimilarity score is very small, that confidence diminishes as their dissimilarity increases, and becomes meaningless beyond a certain threshold. By attempting to preserve all pairwise distances, there is significant loss of local information, causing scattering of closely related sequences and erroneous aggregation of unrelated ones.
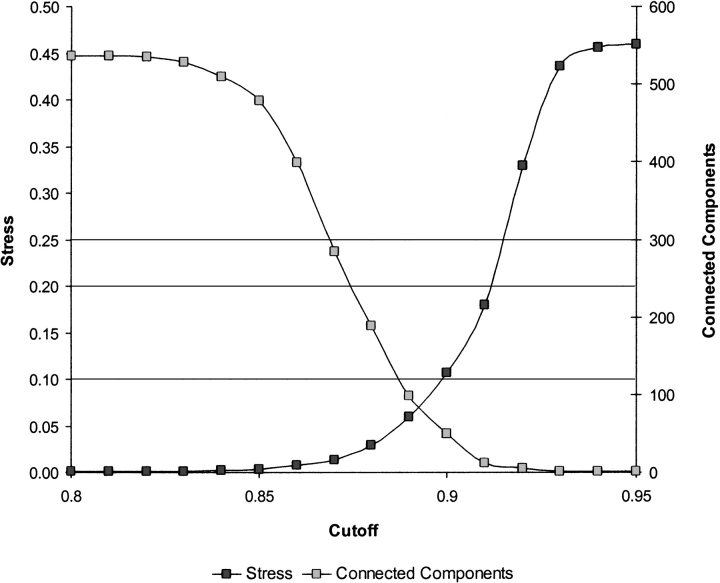
If the sequences lie on a nonlinear manifold, a more appropriate measure is the geodesic distance on the manifold itself, which is obtained by tracing the shortest possible sequence of evolutionary events that convert one sequence to the other and computing the length of that path. What complicates this analysis is the fact that our set of sequences does not contain the complete evolutionary history of the protein family, and therefore, the geometry of the manifold must be inferred from a sparse number of samples. The most critical choice in producing a meaningful embedding is that of the neighborhood radius, rc. The “ideal” cutoff is one that represents a good compromise between the stress and the number of connected components, and is typically located near the point where the two normalized curves, the stress, and number of connected components intersect, as shown in Figure 2 ▶. As the neighborhood radius decreases, structural families begin to emerge and become more clearly delineated, until we reach the fragmentation threshold. Beyond that threshold, the map disintegrates into a large number of disconnected fragments losing much of its structure and interpretability as shown in Figure 3 ▶ for the Manning set.
Figure 2.
Stress and number of connected components of the 2D SPE map of the Manning kinase superfamily as a function of the neighborhood radius, rc. For a well-sampled noiseless manifold embedded in the intrinsic dimension, the ideal cutoff is any value that leads to zero stress and a single connected component. For sparsely sampled data sets that contain discontinuities (such as the ones examined here), no such value exists, and the “ideal” cutoff is one that represents a good compromise between the stress and the number of connected components, and leads to a visually meaningful map. This value is typically located near the point where the two normalized curves intersect.
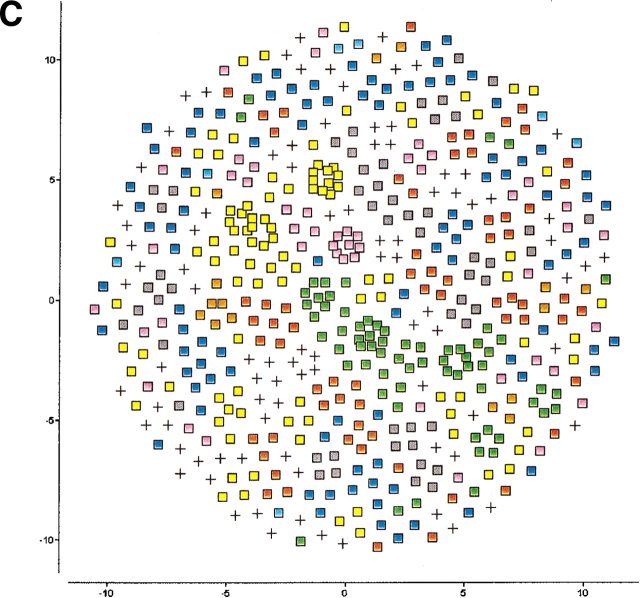
Figure 3.
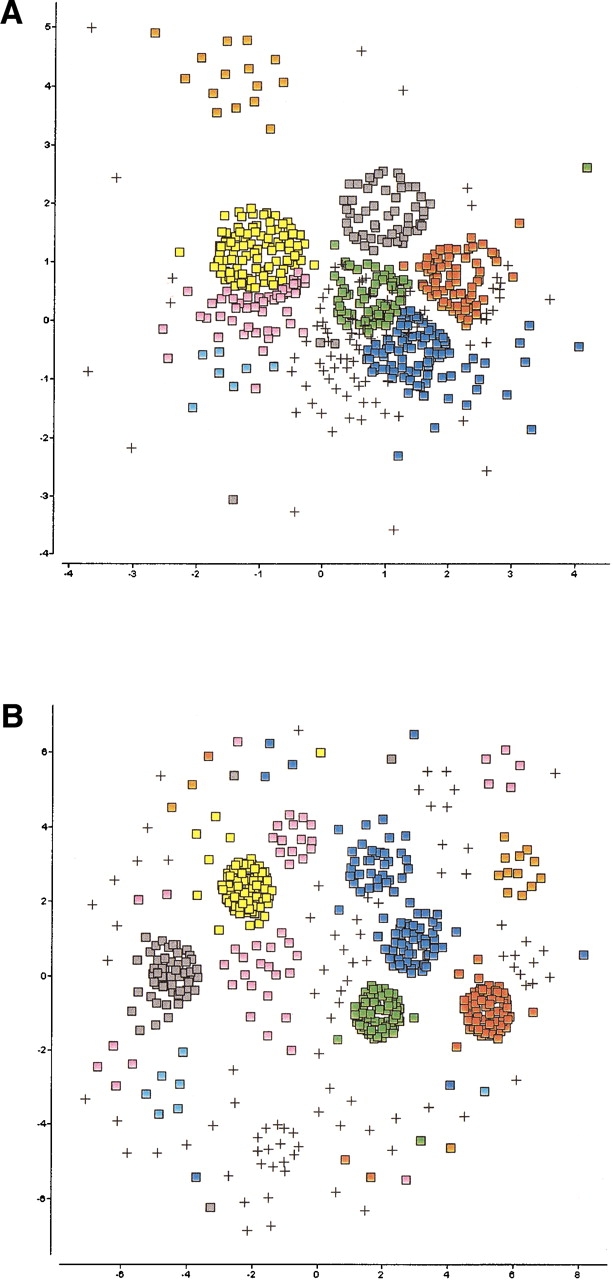
Two-dimensional SPE maps of the Manning kinase domains using a neighborhood radius of (A) 0.87, (B) 0.89, and (C) 0.91. As the cutoff decreases, distinct families that are not discernible in the conventional nonlinear map (Fig. 1B ▶) begin to emerge and become more clearly delineated until we reach the fragmentation threshold. At that point, the manifold breaks down into a large number of disconnected fragments and singletons, and the map looses its structure and interpretability.
The resulting plots are visually compelling. By preserving only the closest distances, the map is able to unfold, revealing clusters that are consistent with the functional classification and evolutionary heritage of their constituent proteins. In addition, it reveals structure and families that are not evident in the original map (Fig. 1B ▶). To ensure global ordering, all the embeddings involving a neighborhood radius were generated using the original SPE map (i.e., that obtained with rc = ∞) as a starting configuration. This scheme serves two purposes: (1) It minimizes the computational effort required for the refinement because the map is already preorganized, and (2) it ensures that related clusters and singletons (i.e., proteins lacking neighbors within the cutoff distance) are not scattered randomly on the plot.
Members of several of the groups, such as AGC, CMGC, STE, and TK, show strong similarities among them, and separate into subgroups only at very short cutoffs. Other groups such as CaMK and TKL show much less cohesion. For example, CaMK divides into two major subgroups at a cutoff of 0.89, and TKL, which consists of a number of diverse groups of kinases similar to tyrosine and serine/threonine kinases, unsurprisingly splits into a significant number of subfamilies.
In Figure 3 ▶, there are few outlier sequences, which do not group with the others in the same annotated family. These tend to represent sequences with unusual characteristics. For example, at the largest cutoff used, there is a single sequence from the CMGC family that does not cluster with the rest. This is a pseudogene for PRP4 kinase, which is one of the shortest sequences and shows weak similarity to the other kinases in the set. Other examples include sequences from the STE group, domain 2 from GCN2, NIK, and COT, which are all classified as unique members of the STE class by Manning.
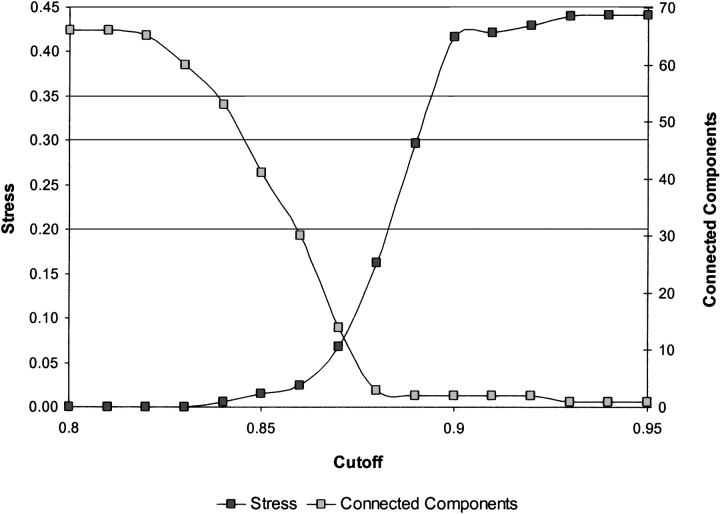
As shown in Figures 4 ▶ and 5 ▶, SPE can also be used to explore more subtle structure within individual subfamilies. These plots show the embeddings obtained by applying SPE only to the members of the CMGC family with and without a cutoff radius. The families identified by Manning et al. (CDK, CDKL, CLK, DYRK, GSK, MAPK, and RCK; 2002) are clearly defined. These subfamilies are not easily discernible on the SPE map of the entire kinase data set, and manifest the dependence of the neighborhood radius on the sampling density and local curvature of the manifold. There are few outliers on the map, with PRP4 kinase pseudogene, as discussed previously, being the most prominent one. Figure 5 ▶ shows the strong similarity between Manning’s CLK and CDKL families, both of which are similar to CDC kinases. In contrast, the MAPK family remains distinct from others in the group. These maps show that SPE can be applied recursively to subsets of large, complex data sets, allowing the investigator to drill down to the interactions of interest.
Figure 4.
Stress and number of connected components of the 2D SPE map of the CMGC subfamily of the Manning kinase domains as a function of the neighborhood radius, rc. The embeddings were based on the same multiple sequence alignment and pairwise similarity scores that were used to construct the maps in Figures 1B ▶ and 3 ▶. Because fewer and more closely related sequences are embedded, the neighborhood radius that reveals the internal structure of this cluster is smaller than that determined for the entire superfamily.
Figure 5.
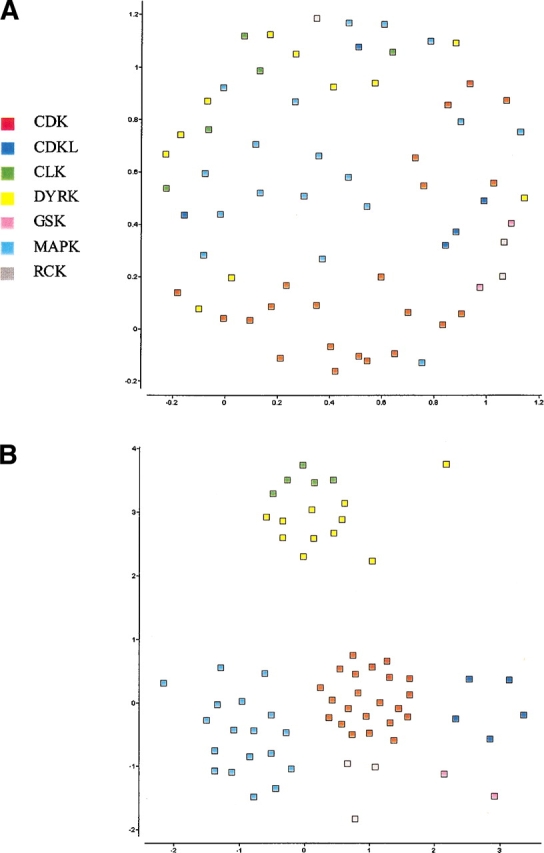
Two-dimensional SPE maps of the CMGC subfamily of the Manning kinase domains using a neighborhood radius of (A) 0.89, and (B) 0.87. Subtle structure within subfamilies is obscured by the presence of distant sequences (A) and is only discernible when analyzed independently (B).
Nuclear hormone receptors
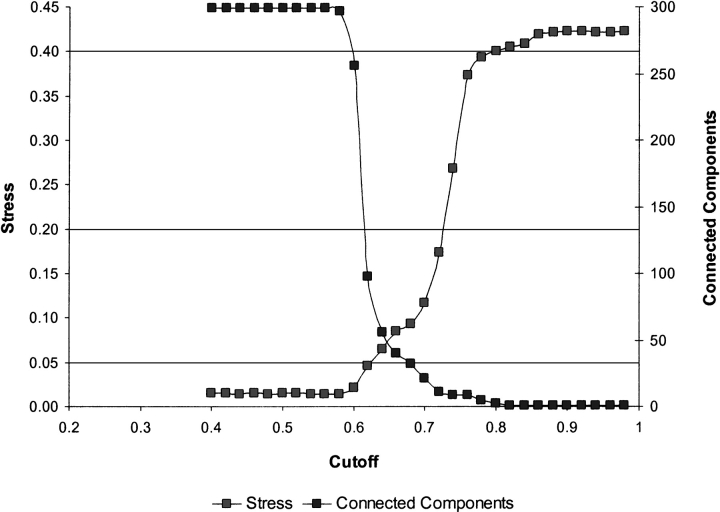
The ability of SPE to detect structure that is invisible to MDS and NLM is not specific to the kinase family. An even more impressive example is illustrated in the mapping of the nuclear hormone receptor ligand binding domains shown in Figures 6 ▶ and 7 ▶. With a suitably chosen neighborhood radius, SPE can preserve not only relationships within subfamilies, but also between them, as in the case of the androgen, glucocorticoid, and progesterone subfamilies highlighted in red, green, and brown in Figure 7B ▶, respectively. The outliers of that map most likely reflect the differences between the methods used to create the classification and the embedding. For example, the sequences for the estradiol receptor from chameleon (SwissProt entry ESR1_ANOCA) and estrogen receptor β from Rhesus monkey (SwissProt entry ESR2_MACMU) are classified into the retinoid X receptor and thyroid receptor families respectively by InterPro (Apweiler et al. 2001) and, in this case, the PRINTS database (Attwood et al. 2000) on which these InterPro families are based. The PRINTS database is based on pattern matching of a series of short sequence segments and, for these two proteins, produces a different result than the overall sequence score produced by our multiple sequence alignment metric. As would be expected from the functional annotations of these proteins, their closest neighbors are in the estrogen receptor family, which is the grouping shown in Figure 7B ▶.
Figure 6.
Stress and number of connected components of the 2D SPE map of the NHR ligand-binding domains as a function of the neighborhood radius, rc.
Figure 7.
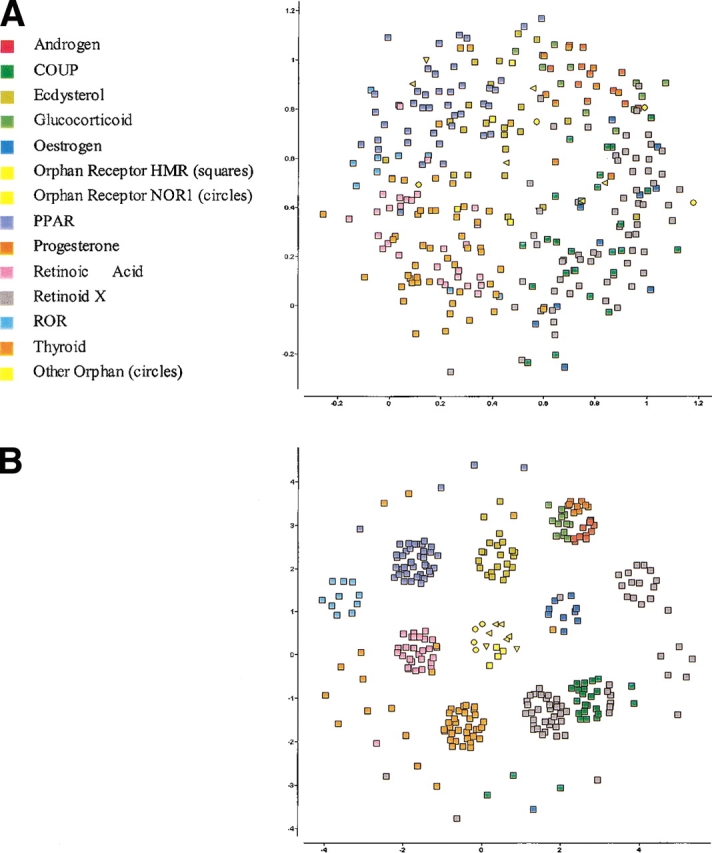
Two-dimensional SPE maps of the NHR ligand-binding domains using a neighborhood radius of (A) rc = ∞, and (B) rc = 0.62.
Conclusions
Owing to the highly organized nature of living systems, protein sequences—and biological data in general—exhibit strong correlations. Here, we have described the application of stochastic proximity embedding to the classification and visualization of protein sequences. When used with a distance metric based on a multiple sequence alignment, the method produced informative maps that preserve the intrinsic structure and clustering of the data. The success of the method depends critically on the choice of the neighborhood radius, which should be consistent with the sampling density and local curvature of the underlying manifold. We have described a procedure for determining a sensible radius by examining the trade-off between the stress function and the number of connected components in the neighborhood graph. By preserving exact proximities of related sequences and lower bounds of unrelated ones, the map is able to unfold and reveal meaningful clusters that provide insight into the structure, function, and ancestry of the embedded sequences, as illustrated in the case of protein kinases and nuclear hormone receptors. The method is general, requiring only a distance measure between the objects of interest, and holds great promise for exploring many other types of biological data.
Materials and methods
Protein data
We demonstrate the utility of SPE on two well-characterized protein families of significant therapeutic interest: (1) the protein kinases (PK) and (2) the nuclear hormone receptors (NHR). PKs share the common function of phosphorylating other proteins and are very important in signal transduction and regulation. Kinases form one of the largest classes of proteins in eukaryotic species (Bingham et al. 2000; Kostich et al. 2002). From a specificity standpoint, kinases are divided into two main groups based on their ability to phosphorylate Ser/Thr or Tyr substrates. They are related by virtue of their catalytic domains, which consist of ~250–300 amino acid residues. These domains are implicated in binding and orienting the ATP phosphate donor and the protein substrate, and transferring the g-phosphate group from ATP to the acceptor hydroxyl residue. Here, we consider two sets protein kinases, the catalytic domains identified by Hanks and Hunter (1995), which had been explored by Sammon mapping in a previous study by our group (Agrafiotis 1997), and a recent catalogue of human kinases by Manning et al. (2002). The conserved domain consists of functional regions that include the phosphate anchor, catalytic residues, and activation loop. Hanks identified four major families: (1) AGC, including the protein kinase C, cyclic-nucleotide dependent and b-adrenergic families; (2) CaMK, including the calcium/calmodulin regulated family; (3) CMGC, including the cyclin-dependent, ERK, glycogen synthase 3, and casein kinase II families; and (4) PTK, including the “conventional” tyrosine kinases. Also included in the Hanks set is the additional “family” OPK, which consists of sequences that do not belong to any of the four larger families. The set of human kinases recently categorized by Manning et al. (2002) supplements the Hanks classification by four additional major families: (1) MAPK, mitogen activated protein kinases; (2) CK1, casein kinase 1, tau tubulin kinase, and vaccinia-related kinases; (3) TKL, kinases that resemble both tyrosine and serine-threonine kinases; and (4) RGC, receptor guanylate cyclases. In addition to considering top level groups, we also investigate the relationships between the subfamilies of the CMGC group as defined by Manning, which include: (1) CDK, cyclin dependent kinases; (2) CDKL, kinases similar to cyclin dependent kinases; (3) CLK, CDC2-like kinases; (4) DYRK, dual specificity kinases; (5) GSK, glycogen synthase kinases; (6) RCK, containing ICK, MAK, and MOK kinases; and (7) SRPK, serine-arginine protein kinases.
A multiple-sequence alignment and classification of 389 kinase domains representing the Hanks classification was extracted from the Protein Kinase Resource Web site (Smith et al. 1997). The average domain length is 272 amino acids, and the multiple sequence alignment is 431 positions long. The average identity between aligned sequences is 24%, with a minimum of 9.5%. The set of kinases classified by Manning includes a total of 625 protein sequences, with 13 of these containing two kinase catalytic domains. This set was filtered to include only sequences whose kinase domain was between 200 and 400 amino acids, leaving 536 kinase domains. These domains were subsequently aligned using ClustalW (Higgins et al. 1994). The resulting multiple sequence alignment consisted of 937 positions, increasing the apparent dimensionality by a factor of three compared to the Hanks set. The average identity in the Manning set was 19%, with a minimum of 2.4%. Within that set, 66 sequences belonged to the Manning CMGC group.
NHRs are ligand-inducible transcription factors that regulate gene expression and play an important role in the growth, differentiation, metabolism, reproduction, and morphogenesis of higher organisms and humans. Here, we consider the ligand-binding domain of the NHR family as defined by the PFAM database (Bateman et al. 2002; accession no. PF00104). A classification of these domains is provided by InterPro (Apweiler et al. 2001), and includes the androgen, glucocorticoid, estrogen, progesterone, and steroid hormone receptor families. Furthermore, the steroid hormone family contains the following subfamilies: ecdysteroid receptor, nuclear receptor ROR, orphan nuclear receptor, peroxisome proliferator activated receptor, retinoic acid receptor, retinoid X receptor, thyroid hormone receptor, and transcription factor COUP. The vitamin D family was also studied but was found to be a relatively nonspecific sequence signature (data not shown) and was omitted from further analysis. From the full listing of 844 domains identified by PFAM, selecting only those domains that contain at least 100 residues and are referenced in the InterPro classification left 299 sequences with an average length of 183 residues. A multiple sequence alignment of these 299 sequences was constructed by ClustalW (Thompson 1994) and was used to compute pairwise similarities as described below. The total length of the alignment was 245 positions, with an average identity for the set of 27% and a minimum of 1.8%.
Distance metric
The distance function for computing the dissimilarity between two protein sequences was based on a multiple sequence alignment (MSA). The MSA metric (Agrafiotis 1997) defines dissimilarity as
 |
where Maikajk is the dissimilarity score between amino acids aik and ajk as determined by a normalized exchange matrix, and n is the length of the alignment. Because conventional nonlinear maps were previously found to be relatively insensitive to the amino acid substitution matrix, only the PAM250 matrix (Schwartz and Dayhoff 1979) with values normalized in the range [0, 1] was considered in this analysis.
Stochastic proximity embedding
SPE minimizes the stress function
 |
where f(dij, rij) is the pairwise stress defined as f(dij, rij) = (dij − rij)2 if rij ≤ rc or dij < rij, and f(dij, rij) = 0 if rij > rc and dij ≥ rij, and rc is a predefined neighborhood radius. S is minimized using a stochastic approximation of steepest descent that attempts to bring each individual term f(dij, rij) rapidly to zero. The method starts with an initial configuration and iteratively refines it by repeatedly selecting two points (sequences) at random, and adjusting their coordinates so that their Euclidean distance on the map dij matches more closely their corresponding proximity rij. The correction is proportional to the disparity,
 |
where λ is a learning rate parameter that decreases during the course of the refinement to avoid oscillatory behavior. If rij > rc and dij ≥ rij; that is, if the points are nonlocal and their distance on the map is already greater than their proximity rij, their coordinates remain unchanged. The algorithm proceeds as follows:
-
Initialize the D-dimensional coordinates of the N points, {xik; i = 1,2, . . ., N; k = 1,2, . . .,D}. Select a cutoff distance rc and an initial learning rate λ > 0.2.Select two points, i and j, at random, evaluate their proximity (dissimilarity) in the input space, rij, and compute their Euclidean distance on the D-dimensional map, dij = ||xi − xj ||. If rij ≤ rc, or if rij > rc and dij < rij, update the coordinates xi and xj by


where ɛ is a small number used to avoid division by zero (here set to 1.0 × 10⁻¹⁰). If rij > rc and dij ≥ rij, leave the coordinates unchanged.
Repeat (2) for a prescribed number of steps, S.
Decrease the learning rate λ by a prescribed δλ.
Repeat (2)–(4) for a prescribed number of cycles, C.
Unlike conventional MDS, SPE preserves exact distances between neighboring points and lower bounds between remote points, thus allowing the manifold to unfold and reveal its true intrinsic dimensionality. In essence, the method views the input proximities between remote points as lower bounds of their true geodesic distances, and uses them as a means to impose global structure.
Neighborhood radius
SPE depends critically on the choice of the neighborhood radius, rc. If rc is too large, the local neighborhoods will include data points from other branches of the manifold, shortcutting them, and leading to substantial errors in the final embedding. If it is too small, it will lead to discontinuities, causing the manifold to fragment into a large number of disconnected clusters. Here, we determine a reasonable cutoff by examining the trade-off between the stress function and the number of connected components (NCC) in the neighborhood graph at different values of rc. For a given value of rc, the neighborhood graph is an undirected graph that contains a vertex for every point in the data set, and an edge between any pair of points whose proximity is less than or equal to rc. Connected components represent distinct fragments of that graph—two vertices are said to belong to the same component if there is a path between them. Efficient algorithms for computing connected components can be found in Cormen et al. (1990).
When plotted against rc, both the stress and the NCC exhibit a characteristic sigmoidal shape with well-defined asymptotic bounds. The ideal cutoff is one that minimizes both the stress and the NCC, that is, one that produces a low stress configuration without causing excessive fragmentation of the data manifold. When plotted on axes normalized to the range of these parameters, a value of rc at the intersection point of the curves provides a reasonable choice for the cutoff in each of the cases that we have examined. Because the neighborhood radius is dependent on the intrinsic curvature and sampling frequency of the manifold, this approach is relatively insensitive to the embedding dimension.
Implementation
All programs were implemented in the C++ programming language and are part of the DirectedDiversity software suite. All calculations were carried out on a Dell Inspiron 8100 laptop computer equipped with a 1.3GHz Intel Pentium III processor running Windows 2000 Professional.
Acknowledgments
We thank Dr. Sergei Izrailev and Dr. F. Raymond Salemme of 3-Dimensional Pharmaceuticals, Inc., for many useful discussions.
The publication costs of this article were defrayed in part by payment of page charges. This article must therefore be hereby marked “advertisement” in accordance with 18 USC section 1734 solely to indicate this fact.
Article and publication are at http://www.proteinscience.org/cgi/doi/10.1110/ps.0379403.
References
- Agrafiotis, D.K. 1997. A new method for analyzing protein sequence relationships based on Sammon maps. Protein Sci. 6 287–293. [DOI] [PMC free article] [PubMed] [Google Scholar]
- Agrafiotis, D.K. and Xu, H. 2002. A self-organizing principle for learning nonlinear manifolds. Proc. Natl. Acad. Sci. 99 15869–15872. [DOI] [PMC free article] [PubMed] [Google Scholar]
- Apostal, I.S. and Szpankowski, W. 1999. Indexing and mapping of proteins using a modified nonlinear Sammon projection. J. Comput. Chem. 20 1049–1059. [Google Scholar]
- Apweiler, R., Attwood, T.K., Bairoch, A., Bateman, A., Birney, E., Biswas, M., Bucher, P., Cerutti, L., Corpet, F., Croning, M.D.R., et al. 2001. The InterPro database, an integrated documentation resource for protein families, domains and functional sites. Nucleic Acids Res. 29 37–40. [DOI] [PMC free article] [PubMed] [Google Scholar]
- Attwood, T.K., Croning, M.D., Flower, D.R., Lewis, A.P., Mabey, J.E., Scordis, P., Selley, J.N., and Wright, W. 2000. PRINTS-S: The database formerly known as PRINTS. Nucleic Acids Res. 28 225–227. [DOI] [PMC free article] [PubMed] [Google Scholar]
- Bateman, A., Birney, E., Cerruti, L., Durbin, R., Etwiller, L., Eddy, S.R., Griffiths-Jones, S., Howe, K.L., Marshall, M., and Sonnhammer, E.L. 2002. The Pfam protein families database. Nucleic Acids Res. 30 276–280. [DOI] [PMC free article] [PubMed] [Google Scholar]
- Bingham, J., Plowman, G.D., and Sudarsanam, S. 2000. Informatics issues in large-scale sequence analysis: Elucidating the protein kinases of C. elegans. J. Cell. Biochem. 80 181–186. [DOI] [PubMed] [Google Scholar]
- Borg, I. and Groenen, P.J.F. 1997. Modern multidimensional scaling: Theory and applications. Springer, New York.
- Cormen, T.H., Leiserson, C.E., and Rivest, R.L. 1990. Introduction to algorithms. The MIT Press, McGraw-Hill Book Company, Cambridge, MA.
- Durbin, R., Eddy, S., Krogh, A., and Mitchison, G. 1998. Biological sequence analysis. Cambridge University Press, Cambridge, UK.
- Enright, A.J. and Ouzounis, C.A. 2001. BioLayout—An automatic graph layout algorithm for similarity visualization. Bioinformatics 17 853–854. [DOI] [PubMed] [Google Scholar]
- Falquet, L., Pagni, M., Bucher, P., Hulo, N., Sigrist, C.J., Hofmann, K., and Bairoch, A. 2002. The PROSITE database, its status in 2002. Nucleic Acids Res. 30 235–238. [DOI] [PMC free article] [PubMed] [Google Scholar]
- Ferran, E.A., Pflugfelder, B., and Ferrara, P. 1994. Self-organized neural maps of human protein sequences. Protein Sci. 3 507–521. [DOI] [PMC free article] [PubMed] [Google Scholar]
- Forster, M., Heath, A., and Afzal, M. 1999. Application of distance geometry to 3D visualization of sequence relationships. Bioinformatics 15 89–90. [DOI] [PubMed] [Google Scholar]
- Gotoh, O. 1999. Multiple sequence alignment: Algorithms and applications. Adv. Biophys. 36 159–206. [DOI] [PubMed] [Google Scholar]
- Grishin, V.N. and Grishin, N.V. 2002. Euclidian space and grouping of biological objects. Bioinformatics 18 1523–1534. [DOI] [PubMed] [Google Scholar]
- Hanke, J. and Reich, J.G. 1996. Kohonen map as a visualization tool for the analysis of protein sequences: Multiple alignments, domains and segments of secondary structures. Comput. Appl. Biosci. 12 447–454. [DOI] [PubMed] [Google Scholar]
- Hanks, S. and Hunter, T. 1995. The eukaryotic protein kinase family: Kinase (catalytic) domain structure and classification. FASEB J. 9 578–596. [PubMed] [Google Scholar]
- Higgins, D., Thompson, J., Gibson, T., Thompson, J.D., Higgins, D.G., and Gibson, T.J. 1994. CLUSTAL W: Improving the sensitivity of progressive multiple sequence alignment through sequence weighting, position-specific gap penalties and weight matrix choice. Nucleic Acids Res. 22 4673–4680. [DOI] [PMC free article] [PubMed] [Google Scholar]
- Holm, L. 1998. Unification of protein families. Curr. Opin. Struct. Biol. 8 372–379. [DOI] [PubMed] [Google Scholar]
- Holm, L. and Sander, C. 1996. Mapping the protein universe. Science 273 595–603. [DOI] [PubMed] [Google Scholar]
- Kostich, M., English, J., Madison, V., Gheyas, F., Wang, L., Qiu, P., Greene, J., and Laz, T.M. 2002. Human members of the eukaryotic protein kinase family. Genome Biol. 3 RESEARCH0043. [DOI] [PMC free article] [PubMed]
- Kozik, A. 2001. Phylographer—graph visualization tool.http://ww.atgc.org/PhyloGrapher
- Manning, G., Whyte, D.B., Martinez, R., Hunter, T., and Sudarsanam, S. 2002. The protein kinase complement of the human genome. Science 298 1912–1934. [DOI] [PubMed] [Google Scholar]
- Martinetz, T. and Schulten, K. 1994. Topology representing networks. Neural Netw. 7 507–522. [Google Scholar]
- Notredame, C., Higgins, D.G., and Heringa, J. 2000. T-Coffee: A novel method for fast and accurate multiple sequence alignment. J. Mol. Biol. 302 205–217. [DOI] [PubMed] [Google Scholar]
- Roweis, S.T. and Saul, L.K. 2000. Nonlinear dimensionality reduction by locally linear embedding. Science 290 2323–2326. [DOI] [PubMed] [Google Scholar]
- Sammon, J.W. 1969. A nonlinear mapping for data structure analysis. IEEE Transact. Comput. 18 401–409. [Google Scholar]
- Schwartz, R.M. and Dayhoff, M.O. 1979. Atlas of protein sequence and structure. National Biomedical Research Foundation, Washington, DC.
- Shepard, R.N. and Carroll, J.D. 1965. Parametric representation of nonlinear data structures. In International symposium on multivariate analysis (ed. P.R. Krishnaiah), pp. 561–592. Academic Press, New York.
- Silverstein, K.A., Shoop, E., Johnson, J.E., and Retzel, E.F. 2001. MetaFam: A unified classification of protein families. I. Overview and statistics. Bioinformatics 17 249–261. [DOI] [PubMed] [Google Scholar]
- Smith, C.M., Shindyalov, I.N., Veretnik, S., Gribskov, M., Taylor, S.S., Ten Eyck, L.F., and Bourne, P.E. 1997. The protein kinase resource. Trends Biochem. Sci. 22 444–446. [DOI] [PubMed] [Google Scholar]
- Tenenbaum, J.B., de Silva, V., and Langford, J.C. 2000. A global geometric framework for nonlinear dimensionality reduction. Science 290 2319– 2323. [DOI] [PubMed] [Google Scholar]
- Thompson, J.D., Higgins, D.G., and Gibson, T.J. 1994. CLUSTAL W: Improving the sensitivity of progressive multiple sequence alignment through sequence weighting, position-specific gap penalties and weight matrix choice. Nucleic Acids Res. 22 4673–4680. [DOI] [PMC free article] [PubMed] [Google Scholar]
- Yona, G. and Levitt, M. 2000. Towards a complete map of the protein space based on a unified sequence and structure analysis of all known proteins. Proc. Int. Conf. Intell. Syst. Mol. Biol. 8 395–406. [PubMed] [Google Scholar]


