Abstract
Estimating the number of molecules in the crystallographic asymmetric unit is one of the first steps in a macromolecular structure determination. Based on a survey of 15,641 crystallographic Protein Data Bank (PDB) entries the distribution of VM, the crystal volume per unit of protein molecular weight, known as Matthews coefficient, has been reanalyzed. The range of values and frequencies has changed in the 30 years since Matthews first analysis of protein crystal solvent content. In the statistical analysis, complexes of proteins and nucleic acids have been treated as a separate group. In addition, the VM distribution for nucleic acid crystals has been examined for the first time. Observing that resolution is a significant discriminator of VM, an improved estimator for the probabilities of the number of molecules in the crystallographic asymmetric unit has been implemented, using resolution as additional information.
Keywords: Solvent content, protein crystals, Matthews coefficient, Matthews probabilities
A significant percentage of the volume of protein crystals is occupied by solvent. Using available data to analyze the solvent content of different crystal forms of globular proteins, mainly in the molecular weight range of <70 kD, Matthews first observed in 1968 (116 crystal forms), and again in 1976 (226 crystal forms), that the fraction of the crystal volume occupied by solvent ranged from 27% to 78%, with the most common value being about 43% (Matthews 1968,Matthews 1976). Matthews defined VM, known as the Matthews coefficient, as the crystal volume per unit of protein molecular weight, and showed that VM bears a straightforward relationship to the fractional volume of solvent in the crystal. The range of VM values was found to be essentially independent of the volume of the asymmetric unit. The frequency distribution of VM for proteins is not symmetric, but has a rather sharp cutoff at the lower end, at approximately the value for close packed spheres (∼26% solvent content). Matthews recognized that the distribution of VM would be useful in preliminary studies of protein crystals to estimate the number of molecules per asymmetric unit, particularly in the molecular weight region below 70 kD, although he suggested that examples would likely be found with VM lying outside the range. Although it was also noted that higher molecular weight proteins had a tendency to form crystals with a higher fractional volume of solvent (Matthews 1976), there were not enough data to statistically determine the range of VM for such proteins.
More than 30 years have passed since Matthews first analysis of protein crystal solvent content, yet the original distribution of VM is still widely used as a guide in determining the contents of the crystallographic asymmetric unit. Given the plethora of crystal forms now available in the Protein Data Bank (PDB; Berman et al. 2000), we decided to revisit the distribution of VM for protein crystals and determine whether the range of values and frequencies has substantially changed. We have treated complexes of proteins and nucleic acids as a separate group, and we have also examined VM for nucleic acid crystals.
Results
Proteins
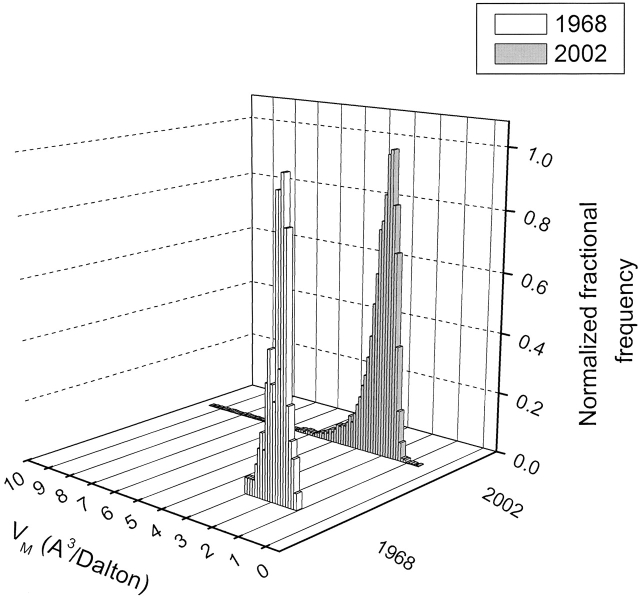
The 2002 frequency distribution for the VM of 10,471 protein crystal forms is compared to the original 1968 distribution in Figure 1 ▶. The distribution range is broader in 2002, with a mean of 2.69 Å3/Dalton, median of 2.52 Å3/Dalton and mode of 2.34 Å3/Dalton, the latter corresponding to a solvent content of ∼47%. Here, we have used an average partial specific volume (psv) of 0.74 cm3/g for proteins, which, unless there is reason to believe that a protein has a significantly different psv, is still appropriate for most proteins (Matthews 1968; Arakawa and Timasheff 1985; Prakash and Timasheff 1985; Perkins 1986; Durchschlag and Zipper 1994; Quillin and Matthews 2000).
Figure 1.
Frequency distribution of values observed for VM. Data taken from Matthews 1968 and from 10,471 nonredundant protein crystal forms from the November 2002 release of the Protein Data Bank. Data from Matthews 1968 have been normalized to the same scale by dividing each bin by the highest frequency value bin.
When the data are clustered into subsets by molecular weight (Fig. 2 ▶), it becomes evident that, although higher molecular weight proteins tend to contribute to the high end of the VM distribution, as first observed in 1976 (Matthews 1976), molecular weight is a poor discriminator of VM. In contrast, when the data are split into distinct clusters by resolution (Fig. 3 ▶), it becomes obvious that crystals diffracting to higher resolution have lower VM, indicating that tightly packed crystals tend to diffract better than loosely packed ones (or vice versa). Although this idea has been assumed for a number of years (Matthews 1968,Matthews 1976; Podjarny et al. 2002), it is substantiated by statistical validation of the observed data. Moreover, because resolution is found to be a significant discriminator of VM, it is appropriate to include resolution as additional information in the estimate of the unit cell contents.
Figure 2.
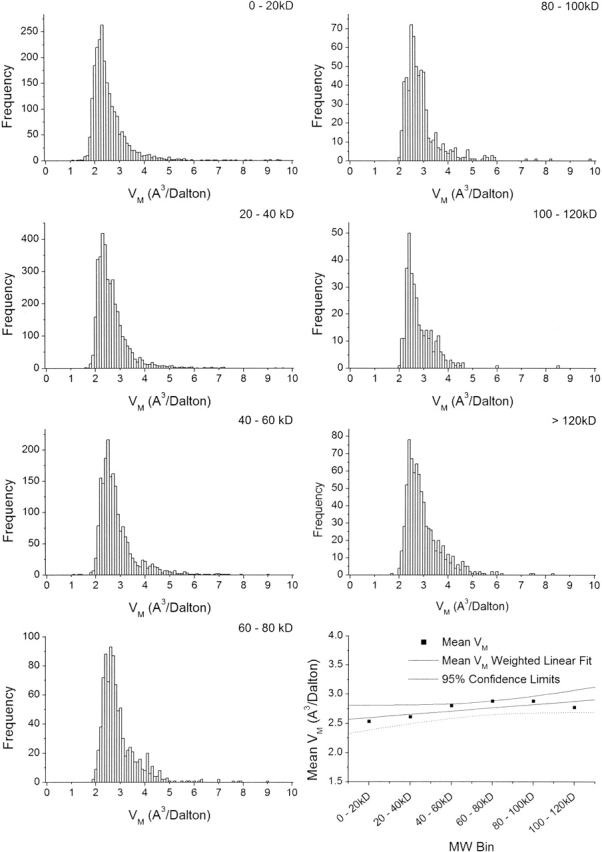
Frequency distributions for VM of 10,471 crystal forms of proteins in the November 2002 release of the Protein Data Bank in equal intervals by molecular weight. Plot at lower right shows mean for each frequency distribution, linear regression weighted by standard deviation, and confidence interval (95%). Correlation (R2 = 0.57), confidence limits, and P-value (0.081) show that the relationship between molecular weight and VM is not statistically significant.
Figure 3.
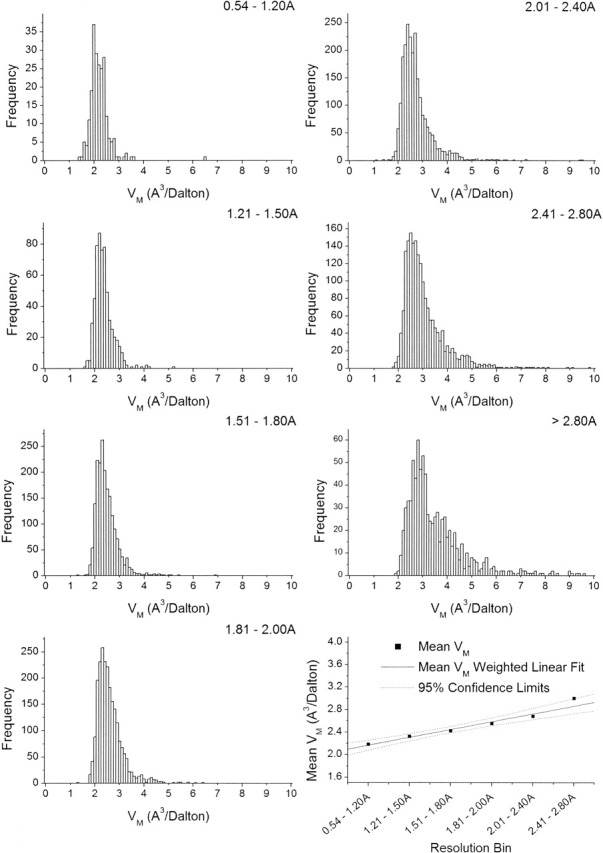
Frequency distributions of VM for 10,471 crystal forms of proteins in discriminant resolution bins. It is evident that more tightly packed crystals (lower VM) tend to diffract to higher resolution. Graph at lower right shows mean for each frequency distribution, linear regression weighted by standard deviation, and confidence interval (95%). From the correlation (R2 = 0.97), confidence limits, and P-value (0.0009), the relationship between resolution and VM is statistically significant.
We also briefly reexamined the frequency distribution for space groups of proteins in the November 2002 release of the PDB. Wukovitz and Yeates observed in 1995 that protein crystals favored some space groups over others, and that certain space groups were not represented in the PDB (Wukovitz and Yeates 1995). In 2002, we observe that all possible chiral space groups are represented in the PDB, with P212121, P21, and C2 again appearing with the highest frequency, and the space group distribution is consistent with the entropic model proposed by Wukovitz and Yeates. Although Matthews suggested in his original analysis that proteins found at the extreme high end of the VM distribution tended to be of higher molecular weight (Matthews 1968), this is not borne out by this recent analysis. In fact, there appears to be nothing particularly unusual or unique in terms of molecular weight distribution about the proteins with extreme high or low VM values.
Nucleic acids
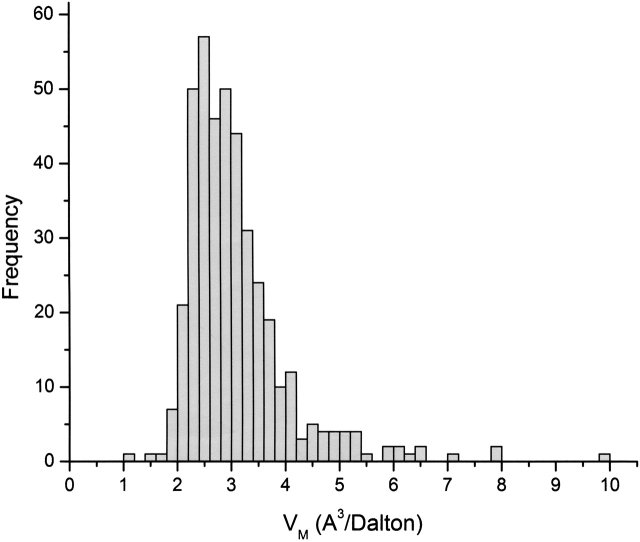
The frequency distribution of VM for nucleic acid crystals is shown in Figure 4 ▶. The range of VM for nucleic acids is also large, with a mean of 2.59 Å3/Dalton, median of 2.34 Å3/Dalton, and most frequent value of 2.35 Å3/Dalton, corresponding to a solvent content of ∼64%. Here, we have used an average psv of 0.50 cm3/g for nucleic acids in the calculation of the solvent content for these crystal forms, although psv will depend on buffer type, pH, and ionic strength (Cohen and Eisenberg 1968; Woodward and Lebowitz 1980). When the nucleic acid data are clustered into subsets by molecular weight and resolution (not shown), similar features to those in the protein data are observed. Although lower molecular weight nucleic acids tend to contribute to the low end of the VM distribution, they are more widely distributed throughout the range than is the case for proteins. Molecular weight is not a significant discriminator of VM for nucleic acids. The molecular weight frequency distribution itself for nucleic acids is rather narrow, whereas the range and frequency distribution of VM versus resolution for nucleic acid crystal structures are much broader. As might be expected, crystals diffracting to higher resolution again appear to cluster near the lower end of the VM distribution, further evidence that more tightly packed crystals generally diffract to higher resolution. Because the bulk of the nucleic acid data pertains to DNA crystals (281), use of the VM distribution for predictive purposes, as described in the discussion, will be restricted to DNA crystals. In view of the small data set, discrimination by resolution in the VM probability calculator is not reliable and has not been implemented.
Figure 4.
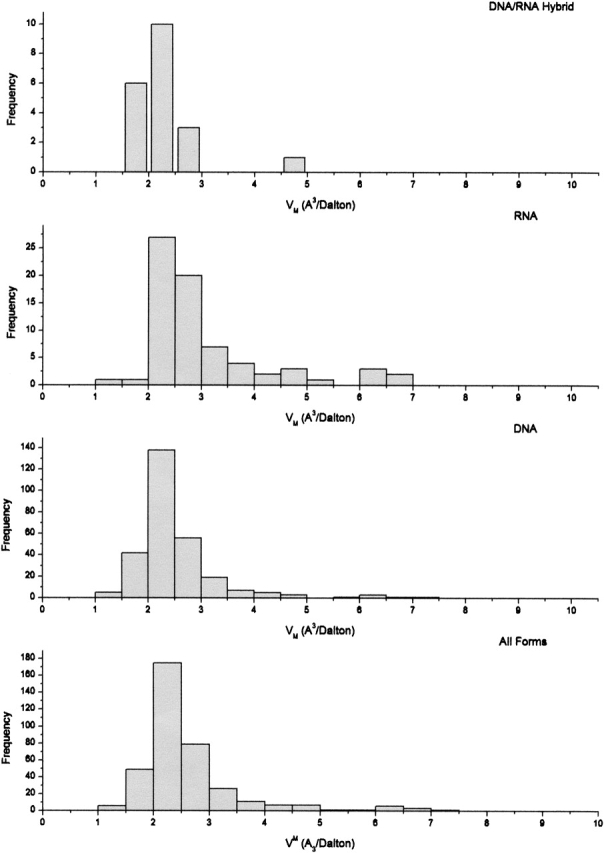
Frequency distribution of VM for 372 crystal forms of nucleic acids in the November 2002 release of the Protein Data Bank. DNA data set used for Matthews probability calculator contains 281 records.
Protein–nucleic acid complexes
The frequency distribution for VM of protein–nucleic acid complexes is shown Figure 5 ▶. The range of VM for crystals of these complexes is wide, and the broad distribution is centered at higher VM than for proteins alone, with a mean of 3.08 Å3/Dalton, a median of 2.88 Å3/Dalton, and a mode of 2.92 Å3/Dalton, corresponding to a solvent content estimate of ∼60% under the assumption of an average protein/nucleic acid ratio of 75%:25%. The solvent content for each complex has to be calculated based on the actual protein/nucleic acid ratio as described in the Experimental section. The molecular weight frequency distribution for these complexes is rather narrow, although the range of the molecular weights is quite broad, and molecular weight is not a significant discriminator of VM for crystals of these complexes. Despite the small sample size (410), when the data are clustered into subsets by molecular weight and resolution (data not shown), similar features to those in the protein data emerge. Again, resolution appears to be a significant discriminator of VM, but sample size is insufficient to allow reliable discrimination by resolution in the VM probability calculator.
Figure 5.
Frequency distribution of VM for 410 crystals of protein–nucleic acid complexes in the November 2002 release of the Protein Data Bank.
Discussion
Matthews probabilities: improved estimates for unit cell constants
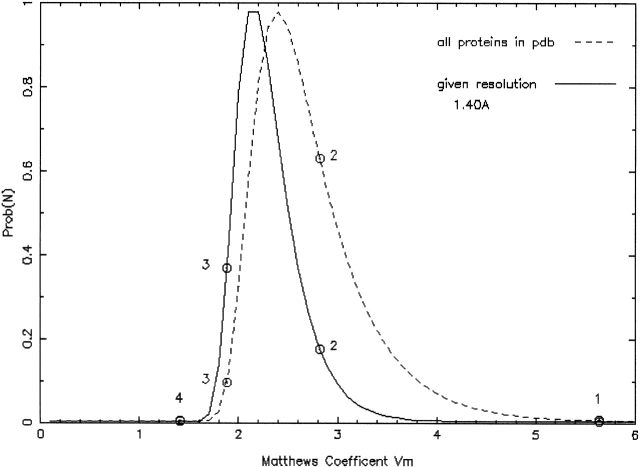
Although Matthews had not anticipated that the parameter VM (Matthews 1968) we now call the Matthews coefficient would turn out to be so widely used (B.W. Matthews, pers. comm.), it has. However, the mean, median, and upper limit of the range of VM for proteins have changed in the intervening 30 years, and these descriptive statistics for crystals of protein–nucleic acid complexes are significantly different. Thus, the idea of a "borderline case" of VM needs to be reconsidered, and the probabilistic character of the estimate of the asymmetric unit contents and its correlation with observed resolution should be taken into account. As we have shown (Fig. 3 ▶), higher packing density (lower solvent content) in a crystal significantly correlates with increasing resolution. We thus implemented an estimator for the probability of the occurrence of a certain VM or the corresponding multimer number, using for proteins the observed diffraction limit (resolution) as additional information. As shown in Figure 6 ▶, significantly improved estimates of the unit cell contents can be obtained when resolution is taken into consideration, and in some cases, even reverse the probabilities for the most likely number of molecules in the asymmetric crystallographic unit cell. This can be of particular advantage in Molecular Replacement, where no de novo substructure solution is available to confirm the actual degree of non-crystallographic symmetry.
Figure 6.
Prediction of number of subunits in crystallographic asymmetric unit cell. Shown is estimate of number of subunits of a given protein with (full line) and without (dashed line) consideration of resolution as a predictive discriminator. The probabilities for the occurrence of a dimer versus a trimer in the asymmetric unit significantly reverse from about 4:1 (favoring a dimer) to 1:2 in favor of a trimer when the high resolution of the data is taken into consideration. Monomer and tetramer (at the right and left extremes of the distribution, respectively) are highly unlikely to occur regardless of resolution. Figure created by http://www-structure.llnl.gov/mattprob/.
The Matthews Probability calculator (http://www-structure.llnl.gov/mattprob/) calculates normalized probabilities for each possible number of subunits in the asymmetric crystallographic unit, using resolution as additional information to select the appropriate probability distribution. The assumption is that observed resolution represents an estimate for the lower limit of crystal quality, that is, crystals evidently diffract to at least this value (but—given different circumstances such as better cooling or cryoprotection—could also diffract better). The convenient option exists to enter the molecular data for one monomer and select its known multimerization state. For example, if the smallest subunit has been (reliably) determined as a homotrimer, one would expect to find 3-mer, 6-mer, 9-mer, etc., in the asymmetric unit. As always, crystallographic axes coinciding with multimer axes can result in improbably low VM for a multimer.
The results are represented in tabular form at the top of the output, followed by two graphs showing the normalized probability distributions (resolution corrected and all data) against VM and solvent content, respectively (Fig. 6 ▶). It must be understood that the results are always relative probabilities based on our current state of knowledge, and that exceptions are possible, despite very low statistical probabilities.
Materials and methods
Analysis of PDB data
In November 2002 the PDB contained nearly 19,000 structure coordinate entries. Entries not belonging to experimentally determined X-ray structures, or inconsistent entries whose VM was calculated to be >10 Å3/Dalton (>90% solvent) from the PDB data (and <1 Å3/Dalton for proteins and protein/nucleic acid complexes), were removed as outliers. The remaining structure coordinate entries (15,641) were X-ray structures with sufficiently complete records to extract space group, unit cell data, sequence, and reported resolution to calculate valid VM values. Data were separated into proteins, nucleic acids, and protein–nucleic acid complexes according to SEQRES records, and the resulting data sets analyzed independently. Protein and nucleic acid molecular weights were calculated from SEQRES records, and the asymmetric unit volume from cell parameters and the space group. VM and solvent content were calculated according to Matthews (1968), using 0.74 cm3/g (Arakawa and Timasheff 1985; Prakash and Timasheff 1985; Perkins 1986; Durchschlag and Zipper 1994; Quillin and Matthews 2000) and 0.5 cm3/g (Cohen and Eisenberg 1968; Woodward and Lebowitz 1980) as partial specific volume (psv) for proteins and nucleic acids, respectively. For protein–nucleic acid complexes, the corresponding psv was used for each constituent. Where a NCS matrix consistent with the SEQRES records was defined in the PDB, noncrystallographic symmetry was considered by grouping of the monomer VM with corresponding monomer molecular weight, but there were no significant differences in the distribution when NCS was not used to calculate the "normalized" VM.
Given the large total amount of independent entries, multiple observations of the same molecule in the same crystal form did not appear to create significant over sampling (as indicated by smooth VM distributions), with two exceptions: a high frequency of occurrence of T4 lysozyme mutant structures in the protein data set, belonging to the space group P3221, and a high frequency of occurrence of DNA polymerase β in the protein/nucleic acid complex data set, belonging to the space group P21212. Nevertheless, to reduce the possibility of statistical bias and create "nonredundant" data sets of "unique" crystal forms, 3536 records having the same space group, cell volume within 1%, and MW within 1% were removed, leaving only the highest resolution record of each set of "duplicates" in the data set. The 1% filter, in the absence of detailed analysis of intermolecular contacts, is a reasonable approach to eliminate most trivial repetitions of closely related structures, such as isomorphous mutants of the same protein and inhibitor complexes of a given protein. Descriptive statistics (limits, mean, median, and mode) were calculated for the frequency distributions of VM, resolution, and molecular weight, and the VM frequency distributions for proteins, nucleic acids, and protein nucleic acid complexes were analyzed as a function of both molecular weight and resolution. Cluster (Tryon 1939; Tryon and Bailey 1973; Hartigan 1975) and discriminant function (Klecka 1980; Kachigan 1986; Huberty 1994) analysis were performed in an attempt to reveal any statistically significant relationships that could be used to calculate probabilities and to determine which parameters may best discriminate between clusters of data.
Implementation of the Matthews probability calculator
The frequency distribution of VM has been approximated by an empirical five parameter
 |
double exponential (modified "extreme function") suitable for the description of highly skewed peaks.
 |
 |
For proteins, the function was parameterized for 12 resolution ranges containing all VM data from highest resolution to each respective lower resolution boundary. The corresponding parameter files and function subroutine may be downloaded from the Web page, and will be updated periodically.
Acknowledgments
We are grateful to B.W. Matthews, University of Oregon; I.P. Korndorfer, Technical University of Munich; Bart Hazes, University of Alberta; and W.-Y. Chang, CSU Fullerton; for insightful comments and discussions. B.R. thanks James C. Sacchettini, Texas A&M University, and LLNL for support of his sabbatical leave at Texas A&M University. K.A.K. thanks the California State University Program for Education and Research in Biotechnology and the W.M. Keck Foundation for support of the Center for Molecular Structure at CSU Fullerton. LLNL is operated by University of California for the U.S. Department of Energy under contract W-7405-ENG-48. This work was funded by NIH P50 GM62410 Center Grant (TB Structural Genomics) and the Robert A. Welch Foundation.
The publication costs of this article were defrayed in part by payment of page charges. This article must therefore be hereby marked "advertisement" in accordance with 18 USC section 1734 solely to indicate this fact.
Article and publication are at http://www.proteinscience.org/cgi/doi/10.1110/ps.0350503.
References
- Arakawa, T. and Timasheff, S.N. 1985. Calculation of the partial specific volume of proteins in concentrated salt and amino acid solutions. Methods Enzymol. 117 60–65. [DOI] [PubMed] [Google Scholar]
- Berman, H.M., Westbrook, J., Feng, Z., Gilliland, G., Bhat, T.N., Weissig, H., Shindyalov, I.N., and Bourne, P. 2000. The Protein Data Bank. Nucleic Acids Res. 28 235–242. [DOI] [PMC free article] [PubMed] [Google Scholar]
- Cohen, G. and Eisenberg, H. 1968. Deoxyribonucleate solutions: Sedimentation in a density gradient, partial specific volumes, density and refractive index increments, and preferential interactions. Biopolymers 6 1077–1100. [DOI] [PubMed] [Google Scholar]
- Durchschlag, H. and Zipper, P. 1994. Calculation of the partial volume of organic compounds and polymers. Prog. Colloid Polym. Sci. 94 20–39. [Google Scholar]
- Hartigan, J. 1975. Clustering algorithms. Wiley, New York.
- Huberty, C.J. 1994. Applied discriminant analysis. Wiley and Sons, New York.
- Kachigan, S.K. 1986. Statistical analysis. Radius Press, New York.
- Klecka, W.R. 1980. Discriminant analysis. Sage, Beverly Hills, CA.
- Matthews, B.W. 1968. Solvent content of protein crystals. J. Mol. Biol. 33 491–497. [DOI] [PubMed] [Google Scholar]
- ———. 1976. X-ray crystallographic studies of proteins. Annu. Rev. Phys. Chem. 27 493–523. [Google Scholar]
- Perkins, S.J. 1986. Protein volumes and hydration effects: The calculation of partial specific volumes, neutron scattering matchpoints and 280-nm absorption coefficients for proteins and glycoproteins from amino acid sequences. Eur. J. Biochem. 157 169–180. [DOI] [PubMed] [Google Scholar]
- Podjarny, A., Howard, E., Mitschler, A., and Chevrier, B. 2002. X-ray crystallography at subatomic resolution. Europhys. News 33 1–11. [Google Scholar]
- Prakash, V. and Timasheff, S.N. 1985. Calculation of partial specific volumes of proteins in 8 M urea solutions. Methods Enzymol. 117 53–60. [DOI] [PubMed] [Google Scholar]
- Quillin, M.L. and Matthews, B.W. 2000. Accurate calulation of the density of proteins. Acta Crystallogr. D56 791–794. [DOI] [PubMed] [Google Scholar]
- Tryon, R.C. 1939. Cluster analysis. Edwards Brothers, Ann Arbor, MI.
- Tryon, R.C. and Bailey, D.E. 1973. Cluster analysis. McGraw-Hill, New York.
- Woodward, R.S. and Lebowitz, J.J. 1980. A revised equation relating DNA buoyant density to guanine plus cytosine content. Biochem. Biophys. Methods 2 307–309. [DOI] [PubMed] [Google Scholar]
- Wukovitz, S.W. and Yeates, T.O. 1995. Why protein crystals favour some space-groups over others. Nat. Struct. Biol. 2 1062–1067. [DOI] [PubMed] [Google Scholar]


