

Abstract
The activity of enzyme I (EI), the first protein in the bacterial PEP:sugar phosphotransferase system, is regulated by a monomer-dimer equilibrium where a Mg2+-dependent autophosphorylation by PEP requires the homodimer. Using inactive EI(H189A), in which alanine is substituted for the active-site His189, substrate-binding effects can be separated from those of phosphorylation. Whereas 1 mM PEP (with 2 mM Mg2+) strongly promotes dimerization of EI(H189A) at pH 7.5 and 20°C, 5 mM pyruvate (with 2 mM Mg2+) has the opposite effect. A correlation between the coupling of N- and C-terminal domain unfolding, measured by differential scanning calorimetry, and the dimerization constant for EI, determined by sedimentation equilibrium, is observed. That is, when the coupling between N- and C-terminal domain unfolding produced by 0.2 or 1.0 mM PEP and 2 mM Mg2+ is inhibited by 5 mM pyruvate, the dimerization constant for EI(H189A) decreases from > 108 to < 5 × 10⁵ or 3 × 10⁷ M−1, respectively. Incubation of the wild-type, dephospho-enzyme I with the transition-state analog phosphonopyruvate and 2 mM Mg2+ also increases domain coupling and the dimerization constant ∼42-fold. With 2 mM Mg2+ at 15–25°C and pH 7.5, PEP has been found to bind to one site/monomer of EI(H189A) with KA′ ≈ 106 M−1 (ΔG′ = −8.05 ± 0.05 kcal/mole and ΔH = +3.9 kcal/mole at 20°C); ΔCp = −0.33 kcal K−1 mole−1. The binding of PEP to EI(H189A) is synergistic with that of Mg2+. Thus, physiological concentrations of PEP and Mg2+ increase, whereas pyruvate and Mg2+ decrease the amount of dimeric, active, dephospho-enzyme I.
Keywords: Enzyme I, E. coli phosphoenolpyruvate:sugar phosphotransferase system, active-site mutant (EI[H189A]), phosphoenolpyruvate, pyruvate, Mg2+, phosphonopyruvate, differential scanning calorimetry, Trp fluorescence, sedimentation equilibrium, dimerization, isothermal titration calorimetry
The bacterial phosphoenolpyruvate (PEP):sugar phosphotransferase system (PTS) is composed of two cytosolic, sugar-nonspecific proteins (enzyme I and histidine-containing phosphocarrier protein [HPr]) and many sugar-specific components enzymes II). PEP is the phosphoryl donor in a Mg2+-dependent autophosphorylation of enzyme I on the N3 atom of His189, and pyruvate is a product of the reaction. Phospho-enzyme I reversibly transfers its phosphoryl group to the N1 atom of His15 of HPr (Meadow et al. 1990). Phosphorylated HPr can donate its phosphoryl group to sugar-specific enzymes II, which ultimately phosphorylate and translocate various sugars across the membrane (Postma et al. 1996).
Chauvin et al. (1996) proposed that regulation of the PTS involves a monomer-dimer equilibrium of enzyme I, because only the dimer form of enzyme I is active in the Mg2+-dependent autophosphorylation by PEP (Waygood et al. 1979; Misset et al. 1980; Saier et al. 1980; Kukuruzinska et al. 1984; Seok et al. 1998). PEP binds to the C-terminal domain of enzyme I (Seok et al. 1996; Brokx et al. 2000), and this domain contains the contacts necessary for the dimerization of EI (Zhu et al. 1999; Brokx et al. 2000). The availability of the inactive, active-site mutant EI(H189A) (Ginsburg et al. 2000) has allowed separation of the effects of PEP and Mg2+ binding on the dimerization of enzyme I from those of phosphorylation. It has been shown that 1 mM PEP in the presence of 2 mM Mg2+ strongly promotes dimerization of EI(H189A) and coupling between the N- and C-terminal domains in unfolding studies (Dimitrova et al. 2002).
The present study examines the effects of varying concentrations of PEP in the presence of 5 mM pyruvate and 2 mM Mg2+ on both the dimerization constant and domain coupling of enzyme I. The effects of binding phosphonopyruvate (a transition-state analog; Herzberg et al. 2002) in the presence of 2 mM Mg2+ to wild-type, dephospho-enzyme I are also reported. A small, but significant, negative influence of phosphate (20 mM) on domain coupling and dimerization of EI and EI(H189A) is found. The synergism between PEP and Mg2+ binding is explored. Moreover, the binding constant, stoichiometry, and heat capacity change for binding PEP in the presence of 2 mM Mg2+ has been measured by isothermal tritration calorimetry (ITC) at 15–25°C and pH 7.5.
The in vivo concentrations of PEP and pyruvate have been measured for resting cells (Hogema et al. 1998) and those in which the translocation of sugars is operating efficiently (Rohwer et al. 2000). Concentrations of PEP are 2.8 mM and ∼0.06–0.30 mM and those of pyruvate are 0.9 and 0.36–8 mM for the former and latter conditions, respectively. For our present study of the regulatory roles of substrates on enzyme I, we chose to maintain 2 mM Mg2+ and 5 mM pyruvate (an average concentration for in vivo conditions) and to vary PEP from 0.2 to 1.0 mM (within the range of in vivo concentrations).
Our results indicate that the substrate PEP and the product pyruvate of the enzyme I catalyzed autophosphorylation reaction in the presence of 2 mM Mg2+ have opposing effects on the dimerization and conformational stability of enzyme I.
Results and Discussion
Thermal unfolding of enzyme I in the presence of effectors
Progress curves for intrinsic tryptophanyl residue fluorescence changes of EI(H189A) as a function of increasing temperature (under the conditions used for the DSC scans shown in Fig. 2 ▶) are shown in Figure 1 ▶. Decreases in intrinsic tryptophanyl residue (Trp) fluorescence reflect C-terminal domain unfolding (Nosworthy et al. 1998). EI(H189A) with 2 mM MgCl2 has been heated in the presence of (Fig. 1 ▶, left to right) 5 mM pyruvate, 5 mM pyruvate and 0.2 mM PEP, 5 mM pyruvate and 1.0 mM PEP, or 1.0 mM PEP. There is a good fit of each data set to a two-state model of unfolding. Clearly, the addition of 5 mM pyruvate to solutions containing 1.0 mM PEP and 2 mM Mg2+ counteracts the stabilizing effect of 1.0 mM PEP on the C-terminal domain (reducing Tm from ∼65 to 63°C). When the concentration of PEP is decreased to 0.2 mM in the presence of 5 mM pyruvate and 2 mM Mg2+, Tm is ∼60°C for C-terminal domain unfolding. With 5 mM pyruvate and 2 mM Mg2+ alone, Tm is 50.5°C (Table 1, below).
Figure 2.

DSC scans of EI(H189A) obtained in the presence of Buffer A with 2 mM Mg2+ and the following effectors: 5 mM pyruvate (dashed line); 5 mM pyruvate and 0.2 mM PEP (dashed dotted line), 5 mM pyruvate and 1 mM PEP (thick solid line), or 1 mM PEP (thin solid line). DSC data are shown after instrument baseline subtraction and normalization for protein concentration and scan rate. Each scan is additionally corrected for a protein linear baseline.
Figure 1.

Thermally induced changes in the Trp fluorescence of EI(H189A) in Buffer A with 2 mM ME and added effectors at 30°C/h scan rate. Added effectors in the presence of 2 mM Mg2+ are 5 mM pyruvate (open diamonds), 5 mM pyruvate and 0.2 mM PEP (open triangles), 5 mM pyruvate and 1 mM PEP (open circles), or 1 mM PEP (open squares). Transition temperatures are indicated by arrows, and the solid line for each data set shows the fit to a two-state unfolding model.
Table 1.
Transition temperatures for EI(H189A) and wild-type, dephospho-EI in the absence and presence of effectors as measured by DSC or intrinsic Trp fluorescence changes (FI) as a function of increasing temperaturea
| F1 | DSC | |||
| Protein (mg/mL) | Effector(s) present (mM) | Tm (°C) | Tm1 (°C) | Tm2 (°C) |
| EI(H189A), 02.0 | — | 46.8 | 45.4 | 54.4 |
| EI(H189A), 0.15 | Hepes | 48.0 | 48.9 | 54.3 |
| EI(H189A), 0.29 | 5 Pyr | 48.0 | 45.6 | 53.4 |
| EI(H189A), 0.21 | 5 Pyr/2 Mg2+ | 50.5 | nt | 50;53 |
| EI(H189A), 0.19 | 5 Pyr/0.2 PEP/2 Mg2+ | 59.9 | 54.8 | 60;61 |
| EI(H189A), 0.26 | 5 Pyr/0.5 PEP/2 Mg2+ | 63.9 | 52.5 | 62;63 |
| EI(H189A), 0.21 | 5 Pyr/1 PEP/2 Mg2+ | 63.3 | 53.7 | 59;63 |
| EI(H189A), 0.29 | 0.2 PEP/2 Mg2+ | 63.3 | 53.5 | 60;63 |
| EI(H189A), 0.22b | 1 PEP/2 Mg2+ | 64.6 | nt | 62;63 |
| EI(H189A), 0.29 | 0.2 PEP/10 Mg2+ | 64.4 | — | — |
| EI(H189A), 0.29 | 0.2 PEP/10 Mg2+/Hepes | — | 52.9 | 62;65 |
| EI(wt), 0.15 | — | 43.0 | 46.4 | 55.4 |
| E(wt), 0.23 | Hepes | — | 48.8 | 54.7 |
| EI(wt), 0.20 | 0.65 PPyr/2 Mg2+ | 63.2 | nt | 61;63 |
a Proteins are in Buffer A containing 20 mM K-phosphate (pH 7.5) or when Hepes is indicated in Buffer B containing 20 mM Hepes (pH 7.5). The rate of temperature increase is 30°C/h. Transition temperatures are from two-state analysis of Trp fluorescence changes (F1) as a function of increasing temperature for C-terminal domain unfolding and from two independent two-state analyses of DSC data in the absence of effectors when two endotherms are resolved. When endotherms in DSC overlap (under Tm2), deconvolutions have assumed a dependent model of two, two-state transitions for analysis of DSC data and the two Tm values are given. When pyruvate is present in mixtures of effectors, endotherms 1 and 2 represent different populations of N- and C-terminal domain unfolding, and deconvolutions of DSC data give one transition for decoupled N-terminal domain under Tm1 and two transitions under Tm2 for coupled N- and C-terminal domain unfolding. The abbreviation ‘nt’ means that no transition for a resolved lower temperature endotherm with Tm1 is observed.
The results shown in Figure 2 ▶ indicate that the conformational stability of enzyme I is profoundly influenced by intracellular concentrations of pyruvate and PEP. When EI(H189A) is scanned by DSC in the presence of 1 mM PEP and 2 mM Mg2+ at pH 7.5, a single endotherm centered at ∼63°C is observed. Both C- and N-terminal domains, which unfold at ∼63°C, are considerably stabilized under these conditions (Table 1). In contrast, the DSC profile in the presence of 5 mM pyruvate with 2 mM Mg2+ has a single, broad endotherm centered at ∼53°C (Fig. 2 ▶). In this case, the C-terminal domain is stabilized by ∼4°C, whereas the N-terminal domain is destabilized by ∼1°C (Table 1). The DSC profile of EI(H189A) with 5 mM pyruvate, 1 mM PEP, and 2 mM Mg2+ exhibits endotherms at Tmax ∼54 and 63°C, indicating that a partial uncoupling of C- and N-terminal domain unfolding occurs when 5 mM pyruvate is present. When the concentration of PEP is decreased to 0.2 mM in the presence of 5 mM pyruvate and 2 mM Mg2+, endotherms centered at ∼55 and 60°C are observed. Since the binding of PEP is synergistic with that of Mg2+, the intracellular concentration of Mg2+ also influences the conformational stability of enzyme I in the presence of PEP (see below).
The midpoints of endotherms in Figure 2 ▶ should be compared to the transition temperatures obtained for C-terminal domain unfolding of EI(H189A) in Figure 1 ▶ under the same conditions (Table 1). The shoulders centered at about 55°C in mixtures of 5 mM pyruvate, 0.2 or 1 mM PEP, and 2 mM Mg2+ represent uncoupled N-terminal domain unfolding, because these transitions are not observed when thermally induced changes in Trp fluorescence are monitored. The high-temperature endotherms of Figure 2 ▶ observed for mixtures of PEP and pyruvate and for PEP alone in the presence of 2 mM Mg2+ represent unfolding of coupled N- and C-terminal domains of EI(H189A). Deconvolutions (assuming a dependent, sequential model) of high-temperature endotherms observed for EI(H189A) with mixtures of 5 mM pyruvate, PEP, and Mg2+ (Tm2 in Table 1) give two transitions with one having a Tm value approximately corresponding to C-terminal domain unfolding (Fig. 1 ▶; Table 1). With mixtures of 5 mM pyruvate and PEP in the presence of 2 mM Mg2+, areas of endotherms (ΔH values) have little meaning and are not reported. In the absence of effectors, calorimetric and van’t Hoff unfolding enthalpies have been reported for dephospho-EI (Nosworthy et al. 1998) and for EI(H189A) (Dimitrova et al. 2002).
Fluorescence and DSC experiments following the incubation of wild-type, dephospho-EI with 0.65 mM phosphonopyruvate and 2 mM Mg2+ in Buffer A are shown in Figure 3 ▶. A single, asymmetric endotherm is observed in DSC, and the Tm value of 63°C from two-state fits of fluorescence data agrees with that of the higher Tm endotherm obtained from fits of the DSC data to a sequential model for two, two-state transitions (Table 1). The promotion of dimerization and stabilization of dephospho-EI by PPyr binding (see below) suggest that this analog may be useful in future structural studies of wild-type enzyme I.
Figure 3.

Thermally induced changes in Trp residue exposure (open squares) and in excess heat capacity (open circles) of wild-type dephospho-EI in Buffer A, pH 7.5 in the presence of 0.65 mM phosphonopyruvate and 2 mM Mg2+ upon temperature increases from 20°C to 70°C. DSC data are shown after instrument baseline subtraction and normalization for protein concentration and scan rate (30°C/h), and subtraction of a protein sigmoidal baseline. The fit of Trp fluorescence data to a two-state model of unfolding is shown by a solid line. The fit of DSC data to a sequential model of two, two-state transitions is shown by a solid line. A dashed line is drawn through Tm of the Trp fluorescence transition and Tmax of DSC data.
A protein concentration dependence of dephospho-EI is not observed for DSC profiles in the absence of ligands, even though a monomer-dimer equilibrium exists at 20°C. Specifically, if dephospho-EI initially contains 30% or 60% dimer at 20°C in DSC scans, the same thermodynamic parameters for reversible unfolding are measured (Table 3 in Dimitrova et al. 2002). In this case, the unfolding of C- and N-terminal domains are loosely coupled, and the shape of the DSC endotherm and enthalpy for unfolding the N-terminal domain is similar to those of the isolated N-terminal domain, which is monomeric (Nosworthy et al. 1998). The temperature dependence of the dimerization constant indicates that this process is entropically controlled (Dimitrova et al. 2002). These observations suggest that in the absence of ligands, dephospho-EI or EI(H189A) may dissociate to monomers during thermally induced unfolding of the C-terminal domain with little heat released. When ligand binding strongly promotes protein dimerization (see Table 3 below), the unfolding of C- and N-domains are tightly coupled with transition temperature increases of ∼18 and 6–8°C, respectively. Ligands that preferentially bind to the dimer apparently maintain the dimeric form of dephospho-EI or EI(H189A) until thermal unfolding causes ligand dissociation. High-temperature endotherms in the latter case show no evidence of dimer dissociation.
Table 3.
Substrate effects on dimerization constants for enzyme I and the active-site mutant (EI(H189A): sedimentation equilibrium studiesa
| Enzyme I (−/+ mM effectors) | Log K1,2′ (M monomer)−1 20°C |
| Dephospho-EI (wt) | 5.31 ± 0.20b |
| Hepes substituted for phosphate in buffer | 5.58 ± 0.09 (9) |
| (+5 pyruvate) | 5.12 ± 0.03b |
| (+0.65 phosphonopyruvate/2 Mg2+) | 6.93 ± 0.07 (6) |
| EI(H189A) | 5.49 ± 0.04b |
| Hepes substituted for phosphate in buffer | 5.76 ± 0.12 (9) |
| (+2 Mg2+) | 5.30 ± 0.08b |
| (+5 Pyr/2 Mg2+) | 4.16 ± 0.11 (9) |
| (+5 Pyr/0.20 PEP/2 Mg2+) | 5.67 ± 0.08 (8) |
| (+5 Pyr/1 PEP/2 Mg2+) | 7.4 ± 0.5 (6) |
| (+1 PEP/2 Mg2+) | ≥108 b,c |
a Buffer (−/+ effectors) used for equilibration of proteins prior to and during analytical ultracentrifugation was 20 mM potassium phosphate, 100 mM KCl, and 2 mM ME, pH 7.5, except in the two cases in which 20 mM Hepes/KOH was substituted for phosphate. Values of the dimerization constant expressed per M monomer (log K1,2′) are averaged from global analysis of 6–9 data files (as indicated in parentheses for new data), each having three concentrations of protein (−0.3, 0.5, 0.8 mg/mL), after 24–44 h at 10,000 rpm, 20°C (see Materials and Methods).
b From Dimitrova et al. (2002) and included for comparison with the new results.
c The value given for log K1,2′ ≥8 in Table 2 simply represents the limits in the sensitivity of absorbance measurements in sedimentation equilibrium scans at 280 nm.
Stabilizing effects of ligands on the C-terminal domain of enzyme I occur through the binding energy (Becktel and Schellman 1987; Brandts et al. 1989). Thus, the effect of a ligand (L) on the transition temperature for a two-state unfolding of a macromolecular domain (with Tc > T0) is directly related to the affinity constant for the ligand. Assuming that the ligand binds to a single site of each subunit and does not bind to unfolded C-terminal domains of EI(H189A) and dephospho-EI, Equation 17 of Brandts et al. (1989) can be applied.
 |
(1) |
T0 and Tc in Kelvin are transition midpoints in the absence and presence of ligand L, respectively; [L] is the free concentration of ligand, R is the gas constant, ΔCp is the heat capacity change for unfolding (assumed to be temperature-independent), which in this case is assumed to be 3300 cal K−1 mole−1 or the same as that measured for the amino terminal domain in Buffer A (Ginsburg et al. 2000), and ΔHc (the enthalpy change at Tc) is calculated from
 |
(2) |
where ΔH0 is the unfolding enthalpy in the absence of ligand. The free concentration of ligand is obtained from reiterative fitting taking into account the total ligand and protein concentrations. Equation 7 of Brandts and Lin (1990), in which the ΔH0 value is used, yields the same KA′ value.
Table 2 summarizes calculated association constants at Tm (Equation 1) based on calculated ΔHc values from Equation 2 and the above assumptions. Unfolding enthalpies for EI(H189A) and dephospho-EI in the absence of ligands have been determined by DSC. Interestingly, the ΔH0 values for C-terminal unfolding differ by 30.5 kcal/mole, whereas ΔH values for N-terminal unfolding are approximately the same for both these enzyme forms (Dimitrova et al. 2002). Generally, the observed ΔH values from two-state fits of data for protein with ligands are variable due to variations in baseline fitting and tend to be somewhat higher than those calculated from Equation 2. The KA′ value at 63.7°C for PEP binding to EI(H189A) with 2 mM Mg2+ present is ∼1.1-fold higher than that extrapolated from binding measurements at 20°C (see below). The KA′ value at 63.1°C for PPyr binding to EI in the presence of Mg2+ is ∼9-fold greater than that for PEP/Mg2+ binding to EI(H189A) due to enthalpic effects. The KA′ value for pyruvate binding to EI(H189A) in the presence of 2 mM Mg2+ (Table 2) is in excellent agreement with the Ki value of 2 mM reported by Saier et al. (1980). In this case, KA′ is temperature-independent, since the enthalpy for binding pyruvate is ∼0 (see below). The binding of PEP stabilizes the C-terminal domain to a much greater extent than does pyruvate due to the free energy difference between binding PEP and pyruvate to EI(H189A) in the presence of 2 mM Mg2+; (∼ −4.9 kcal/mole).
Table 2.
Calculated association constants at transition temperatures for EI(H189A) and wild-type, dephospho-EI binding ligands from DSC and fluorescence measurementsa
| ΔHobsb | ΔHcc | ||||
| Protein μM subunit | Ligands (mM) | (kcal/mole) | Tmb (°C) | KA′ at Tm (M−1) | |
| EI(H189A), 3.15 | — | 45 | — | 45.4 | — |
| EI(H189A), 4.09 | 1 PEPd | 70 | 59.85 | 49.9 | 2.17 × 10³ |
| EI(H189A), 3.31 | 5 Pyr/2 Mg2+ | 83 | 60.84 | 50.2 | 4.91 × 10² |
| EI(H189A), 3.46 | 1 PEP/2 Mg2+ | 112 | 105.39 | 63.7 | 6.05 × 10⁵ |
| EI(wt), 2.36-7.23 | — | 75.5 | — | 46.3 | — |
| EI(wt), 3.30 | 0.65 PPyr/2 Mg2+ | 136 | 130.94 | 63.1 | 5.02 × 10⁶ |
a Proteins are in 20 mM K-phosphate and 100 mM KCl (pH 7.5), and scan rates at 30°C/h.
b Enthalpy changes at Tm (ΔHobs) and transition temperatures (Tm) are averages of 2–4 separate determinations from two, two-state analysis of DSC data in the absence of effectors when two endotherms are resolved and, in the presence of effectors, from two-state analyses of Trp fluorescence changes as a function of increasing temperature for C-terminal domain unfolding (Nosworthy et al. 1998).
c Values of ΔHc are calculated from Equation 2.
d From Dimitrova et al. (2002).
Synergism between the binding of Mg2+ and PEP has been observed before (Dimitrova et al. 2002). In the absence of Mg2+, the affinity constant of EI(H189A) for PEP is ∼2 × 10³ M−1 at 49.9°C (Table 2). The presence of 2 mM Mg2+ therefore increases the affinity constant of EI(H189A) for PEP >280-fold. From the Tm values of EI(H189A) in the presence of 0.2 mM PEP and 2 or 10 mM Mg2+ (63.3 or 64.4°C in Table 1), it can be calculated that the association constant for PEP is increased ∼1.6-fold at ∼64°C by increasing Mg2+ concentrations from 2 to 10 mM. These results indicate that 2 mM Mg2+ is nearly saturating.
DSC profiles for wild-type, dephospho-EI, and EI(H189A) in either 20 mM Hepes or 20 mM phosphate with 100 mM KCl, pH 7.5 are shown in Figure 4 ▶. In the presence of phosphate, a distinct endotherm with Tm ≈ 46 or 45°C for thermal unfolding of the C-terminal domain of dephospho-EI or EI(H189A), respectively, is observed, whereas in Hepes buffer there is only a low-temperature shoulder of the N-terminal domain transitions with Tm ≈ 49°C (Table 1). Phosphate could preferentially bind to the partially unfolded C-terminal domain of nonphosphorylated enzyme I, which would result in a decrease in the Tm value (Zolkiewski and Ginsburg 1992). Alternatively, the binding of phosphate to EI could neutralize a charge distribution causing an uncoupling of C- and N-terminal domain unfolding. The latter possibility is suggested by the observations of LiCalsi et al. (1991) that pH influences the Tm values of C- and N-terminal domains in DSC experiments. For example, DSC profiles reported by LiCalsi et al. (1991) show essentially one endotherm centered at ∼54°C at pH 6.5 and two well-separated endotherms (with ∼38 and 55°C Tm values) at pH 8.5.
Figure 4.
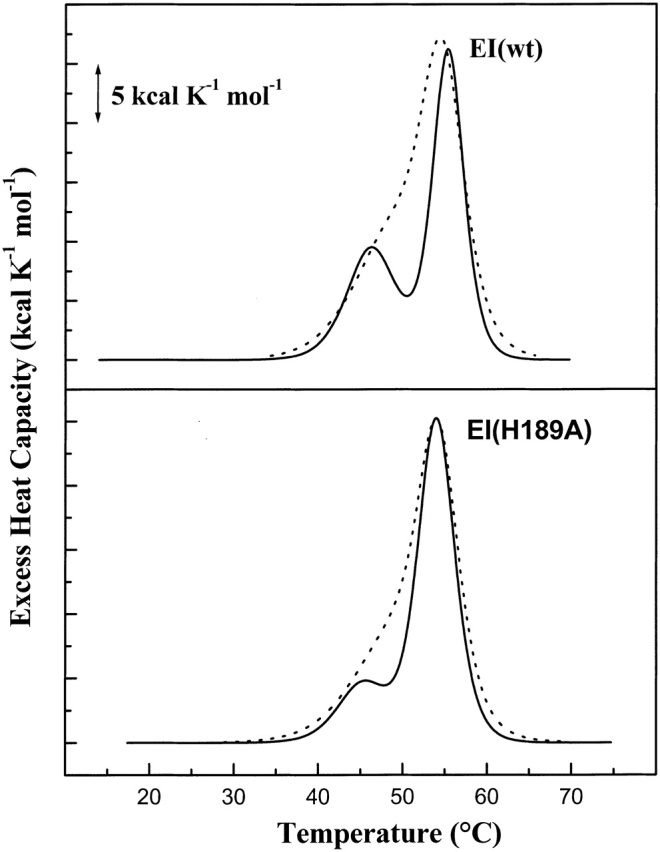
DSC scans of 0.23 mg/mL dephospho-EI(wt) (upper panel) and 0.20 mg/mL EI(H189A) (lower panel) in either Buffer A containing 20 mM phosphate (thick lines) or Buffer B containing 20 mM Hepes (dashed lines) at 30°C/h scan rate and pH 7.5. DSC data are corrected as in Figure 2 ▶.
As will be shown below, there is a correlation between the coupling of C- and N-terminal domain unfolding and the dimerization constant for the reversible self-association of the enzyme I monomer. Steady-state levels of phosphate are 20–30 mM in glucose-starved cells (Rosenberg et al. 1982) and may be a factor in promoting the inactive monomeric form of enzyme I. When glucose is added to intact cells, orthophosphate levels markedly decrease (Peterkofsky 1988).
EI(H189A) in the presence of 2 mM Mg2+ was titrated with PEP in Buffer A with 2 mM Mg2+ at 20°C in isothermal titration calorimetry (ITC) experiments, and a representative ITC experiment is shown in Figure 5 ▶. From duplicate titrations, an average stoichiometry of 0.98 ± 0.03 for PEP binding to a subunit of EI(H189A) with an affinity constant of 1.0 ± 0.1 × 10⁶ M−1 (ΔG′ = −8.05 ± 0.05 kcal/mole) are obtained. Moreover, the average enthalpy for binding PEP to EI(H189A) in the presence of 2 mM Mg2+ at 20°C is +3900 ± 150 cal/mole, giving TΔS = 12.0 ± 0.1 kcal/mole. ITC experiments under the same conditions as those conducted at 20°C have been performed at 15 and 25°C, yielding the ΔCp plot shown in Figure 6 ▶. The slope of the linear plot in Figure 6 ▶ gives a value for ΔCp = −0.33 ± 0.03 kcal K−1mole−1 for EI(H189A) binding PEP in the presence of 2 mM Mg2+. The value of ΔCp for EI(H189A) binding PEP in the presence of Mg2+ is consistent with a PEP-promoted protein conformational change that favors dimer formation, which, in fact, occurs during ITC titrations (see below).
Figure 5.
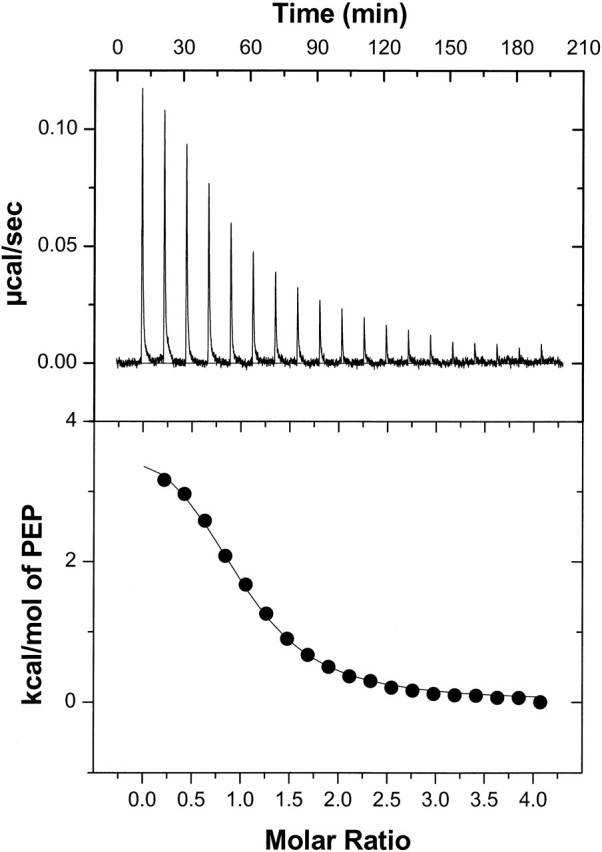
A representative titration of EI(H189A) with PEP in Buffer A + 2 mM Mg2+ at 20°C. The concentration of the protein in the cell is 5.16 μM subunit (0.33 mg/mL), and the PEP concentration in the syringe is 0.3 mM. (Upper panel) Observed heats for the 2nd through 20th injection of 5 μL PEP at 10-min intervals after baseline correction. Heats of dilution of PEP were obtained from injections 19–20 and subtracted from the data. (Lower panel) Corrected, normalized binding enthalpies versus the PEP/EI(H189A) molar ratio reflect the fact that heat is absorbed in this binding process. The data (filled circles) are fitted to a one-site binding model (thin solid line) which gives KA′ = 9.3 ± 1.1 × 10⁵ M−1, ΔH = 4.1 ± 0.2 kcal mole−1, and n = 0.97 ± 0.03 for the stoichiometry of PEP binding to EI(H189A) subunit.
Figure 6.

Heat capacity plot of observed ΔH values for binding PEP to EI(H189A) in the presence of 2 mM Mg2 and Buffer A (pH 7.5) versus temperature (15, 20, and 25°C) from ITC measurements. The slope (ΔCp) is shown (−0.33 ± 0.03 kcal K−1mole−1) with errors for each titration indicated.
The values of ΔCp from the ITC experiments indicate that whereas the binding enthalpy is positive at 25°C, the binding enthalpy becomes negative at higher temperatures. The quantity [ln K20/K63.7] can be calculated from the right-hand expression of Equation 1 after substituting the thermodynamic parameters ΔH and ΔCp for binding PEP with 2 mM Mg2+ present from the ITC titrations at 20°C. This calculation gives K20 (1.0 × 10⁶ M−1) = 1.82 K63.7 or KA′≈ 5.5 × 10⁵ M−1 at 63.7°C, which is ∼91% of the affinity constant for these conditions calculated by Equation 1 using Tm values from Table 2. Considering the extrapolations of ITC data and the fact that the value of ΔCp for unfolding is estimated in Equation 1, the agreement in calculations of the affinity constant of EI(H189A) for PEP in the presence of 2 mM Mg2+ at 63.7°C is remarkable.
ITC experiments at 20°C with pyruvate added to EI in the presence of 2 mM Mg2+ show only the heat of dilution for pyruvate. This is consistent with an electrostatically driven reaction without a measurable, accompanying protein conformational change. The overall destabilizing effects of pyruvate observed in the present studies could arise from competition of PEP and pyruvate for a single binding site of the EI(H189A) subunit (Fig. 2 ▶). Pyruvate displacement of PEP will reverse the protein conformational changes and dimerization produced by PEP binding while decoupling the N-terminal domain unfolding (Table 1).
Substrate effects on the dimerization of enzyme I and EI(H189A)
Table 3 shows dimerization constants (expressed as log K1,2′ per M monomer) determined by sedimentation equilibrium at 20°C and 10,000 rpm for dephospho-EI and EI(H189A) in the absence and presence of substrates or transition-state analog. Representative sedimentation equilibrium data and fitting procedures for EI(H189A) in the absence of substrates are illustrated in Dimitrova et al. (2002).
DSC results (Fig. 4 ▶) suggest that 20 mM phosphate uncouples C- and N-terminal domain unfolding and, indeed, the dimerization constant for both dephospho-EI and EI(H189A) is 1.9-fold greater in Hepes (Buffer B) than in phosphate (Buffer A); see Table 3. The presence of 5 mM pyruvate produces a small decrease in K1,2′ of dephospho-EI, whereas 0.65 mM phosphonopyruvate with 2 mM Mg2+ produces a 42-fold increase in the dimerization constant of dephospho-EI.
For our studies on the effects of binding PEP, the availability of the inactive, active-site mutant EI(H189A) (Ginsburg et al. 2000) has allowed a separation of binding effects from those of phosphorylation (Dimitrova et al. 2002). Moreover, the conformational stability of EI(H189A) is similar to that of nonphosphorylated enzyme I. Whereas the addition of Mg2+ to EI(H189A) has little effect on K1,2′, the addition of 5 mM pyruvate with 2 mM Mg2+ decreases the dimerization constant by a factor of ∼14. The addition of 5 mM pyruvate to EI(H189A) in the presence of 1 mM PEP and 2 mM Mg2+ substantially decreases the dimerization constant of EI(H189A). Under the latter conditions, destabilization and uncoupling of N- and C-terminal domain unfolding occurs (Fig. 2 ▶; Table 1). Essentially complete dimer formation is promoted by 1 mM PEP in the presence of 2 mM Mg2+ due to preferential binding of PEP to the dimer, and under these conditions both N- and C-domains are markedly stabilized (Fig. 2 ▶; Table 1). Some values from a previous study of Dimitrova et al. (2002) are included in Table 3 for comparisons with the present data.
Overall, the results presented in Table 3 suggest that there is a strong correlation between the coupling of C- and N-terminal domain unfolding observed in DSC measurements (Fig. 2 ▶; Table 1) and the dimerization constant of enzyme I. That is, the conformational stability of EI(H189A) is increased by 1 mM PEP and 2 mM Mg2+, which strongly promote dimerization. The further addition of 5 mM pyruvate destabilizes N-and C-terminal domains of some of the protein population (Fig. 2 ▶), presumably by displacing PEP from some dimers, and decreases the average dimerization constant (Table 3).
Concluding remarks
Previous results have shown that phosphorylation of H189 or substitution of Glu for His189 in the N-terminal domain of EI destabilizes this domain and increases by 10-fold the K1,2′ for dimerization (Nosworthy et al. 1998; Ginsburg et al. 2000; Dimitrova et al. 2002), which occurs through C-terminal domain interactions (Zhu et al. 1999; Brokx et al. 2000; Ginsburg and Peterkofsky 2002).
The present study shows a correlation between the coupling of N- and C-terminal domains during unfolding/refolding by effectors binding to the C-terminal domain and the dimerization constant for EI and EI(H189A). In the presence of 2 mM Mg2+, PEP binds with high-affinity (106 M−1 at pH 7.5, 20°C), markedly stabilizes both C- and N-terminal domains of EI(H189A), and promotes essentially complete dimerization of the protein by preferential binding to the dimer. Under the same conditions, the addition of 5 mM pyruvate (KA′ = 4.9 × 10² M−1) decouples domain interactions and inhibits protein dimerization necessary for catalyzing the Mg2+-dependent autophosphorylation of EI by PEP. Thus, physiological concentrations of Mg2+, PEP, and pyruvate (and orthophosphate to a lesser extent) regulate the dimerization of EI and thereby the activity of EI in catalyzing the first reaction of the phosphoenolpyruvate:sugar phosphotransferase system. Once phosphorylated, the dimerization constant of enzyme I is increased 10-fold (Dimitrova et al. 2002) and phospho-EI is poised for reversible phosphotransfer to HPr.
Materials and methods
Protein and other materials
Mutagenesis of the active-site His189 of enzyme I (EI) to Ala or Glu has been described, as have the expression and purification of wild-type EI, and EI(H189A) (Nosworthy et al. 1998; Ginsburg et al. 2000). Purified proteins were homogeneous in SDS-PAGE (Laemmli 1970) and were stored at −80°C in the 10 mM Tris-HCl/100 mM NaCl, pH 7.5 buffer used for purification. For the present studies, proteins were dialyzed overnight at 4°C against several changes of 20 mM potassium phosphate (Buffer A) or 20 mM Hepes/KOH (Buffer B) containing 100 mM KCl ± 2 mM 2-mercaptoethanol (ME; pH 7.5) using Slide-A-Lyzer Cassettes (10,000 MW cutoff; Pierce). Before use in experiments, wild-type enzyme I was dephosphorylated by dialysis at 4°C against a pH 7.5 buffer containing 10 mM K-phosphate, 10 mM sodium pyruvate, 1 mM MgCl2, and 2 mM ME followed by extensive dialysis versus Buffer A or Buffer B in the absence of MgCl2 and pyruvate. For ultracentrifugation and fluorescence measurements, buffers contained 2 mM ME. For DSC scans, proteins were equilibrated against the same buffers without added ME. For equilibration of proteins with effectors present, gel filtration through a PD-10 (G25M Sephadex; Pharmacia) column at room temperature was used. Before each measurement, the protein concentration was determined spectrophotometrically using the specific absorption coefficient A280 nm,1 cm = 0.40 cm2/mg determined by Waygood (1986).
Phosphonopyruvate (PPyr), an analog of PEP, was a gift from Zhibing Lu, who had synthesized this compound as a lithium salt by the procedure of Sparkes et al. (1990) and stored it dry at −20°C. The PPyr concentration was measured by quantitating the carbonyl group content spectrophotometrically after derivatization with 2,4-DNPH as described (Gunsalus and Stamer 1955) with the following modifications. After adjusting volumes of pyruvate standards (0–0.3 μmoles) and samples of PPyr diluted in water to the same extent as in experiments employing this compound to 0.775 mL with water, 0.175 mL of freshly prepared 0.1% 2,4-DNPH in 2 M HCl was added to each tube, mixed, and after 15 min, 0.75 mL of 2.5 M KOH was added to each tube. After thorough mixing, tube contents were centrifuged for 5 min at 3,000 rpm in Precision Scientific Vari-Hi speed centricones. A linear calibration curve (±0.005 mM) was obtained by plotting absorbance at 540 nm versus pyruvate concentrations; the 540 nm absorbances of the four PPyr samples corresponded to 0.65 mM PPyr. Mass spectral analysis of the PPyr solution showed the presence of mono- and dilithium salts of phosphonopyruvate and some minor contaminants. Phosphoenolpyruvate (Roche), pyruvate (Sigma), and other commercially available chemicals were of the highest purity available. All solutions were prepared with deionized and filtered water from a Milli-Q Plus system.
Differential scanning calorimetry
DSC measurements were performed with the VP-DSC calorimeter of Plotnikov et al. (1997) from MicroCal without feedback, and calibrated as described (Ginsburg and Zolkiewski 1991). Samples were pre-equilibrated at 15°C before the first scan and between scans for 45 to 60 min. A scan rate of 30°C/h was used in all of the experiments, because this was found to be a good compromise between scan-rate independence and minimizing the time that proteins stay at high temperatures (Nosworthy et al. 1998). DSC data were corrected for instrument baselines (determined by buffer versus buffer scans) and normalized for scan rate and for protein concentration (∼3–5 micromolar enzyme I subunit). For experiments involving effectors, scans were conducted with the effectors added to the buffer in the reference cell. Data conversion and analysis were performed using Origin software (MicroCal). Excess heat capacity (Cp) was expressed in kcal K−1 (mole monomer)−1, where 1.000 cal = 4.184 J.
Isothermal titration calorimetry
The VP-ITC microcalorimeter (MicroCal) was used as recommended by the manufacturer. Titrations were performed at 15, 20, and 25°C. In experiments, 20 consecutive 5 μL aliquots of 0.3 mM PEP in Buffer A with 2 mM Mg2+ were injected into the cell (1.4061 mL) containing 3–6 μM EI(H189A) subunit in Buffer A + 2 mM Mg2+. The duration of each injection was proportional to the volume added (2s/μL injectant), and injections were made at intervals of 10 min. The protein solution was maintained at constant stirring speed (300 rpm) to ensure proper mixing after each injection of PEP. A first injection of <10% of later injection volumes was made for each titration to avoid artifacts arising from bubbles and/or diffusion from the syringe tip during temperature equilibration. Dilution heats of PEP into the protein solution were subtracted from measured heats of binding. Titrations of EI with 10 mM pyruvate in Buffer A + 2 mM Mg2+ were conducted at 20°C as described above. ITC titration data were analyzed with the Origin version 5.0 program provided by MicroCal.
Fluorescence spectroscopy
Fluorescence measurements were performed in an SLM Aminco-Bowman Series 2 spectrofluorometer. Measurements were made with polarizers positioned at 54.7° in the emission light beam and 0° for excitation at 295 nm (2 nm bandwidth) for samples in Buffer A. Emission was measured at the intensity maximum for folded EI forms (342 nm) with 8 nm bandwidth. Temperature was controlled by a programmable Neslab RTE-111 water bath using water-jacketed fluorescence cuvettes (1 mL, 1-cm path length). The sample cuvette temperature was monitored directly by inserting a Teflon-coated microthermocouple (Omega). Progress curves for Trp exposure were analyzed by the two-state thermodynamic analysis program of Kirchhoff (1993).
Analytical ultracentrifugation
Beckman Optima Models XL-A and XL-I analytical ultracentrifuges equipped with absorption optics and four-place AN-Ti rotors were used for sedimentation equilibrium experiments at 4 and 20°C as described (Dimitrova et al. 2002). Cells with carbon-filled 6-channel centerpieces (12 mm) and plane quartz windows were used. Generally, identical samples of freshly dialyzed or gel-filtered proteins were loaded into two cells and run at the same time in the two ultracentrifuges at 4 and 20°C Data obtained at 4°C are not reported here because low temperature favors the monomer of EI or EI(H189A), but the data collected at 4°C are useful for detecting any aggregation (Dimitrova et al. 2002). Protein UV-spectra and concentrations from 280-nm absorbances were determined just prior to ultracentrifugation. Proteins were loaded into the right side of each channel: 0.080 mL of ∼0.33–0.40 (inner), 0.56–0.63 (middle), and 0.81–0.94 (outer) mg/mL versus 0.095 mL of reference dialysate buffer in left channels. At the beginning of each run, scans at 280 nm were made in the continuous mode (0.003-cm steps) with three averages at 3000 rpm in order to establish solvent and protein meniscii, plateau absorbances at 280 nm, and bottom radial positions for each channel. After rotors were accelerated to 10,000 rpm at 20.0°C or 4.0°C, auto scans at 2-h intervals were made in 0.001-cm steps (step mode) with 7–13 averages for a total of ∼52 h before ending centrifuge runs. Densities of solvents were determined with an Anton-Paar Model DMA-58 densitometer at 20.00 ± 0.01°C: Buffer A, 1.0079 g/mL and Buffer B, 1.0046 g/mL. Protein specific volumes were calculated to be 0.725 mL/g for EI and EI(H189A) from the amino acid compositions derived from DNA sequences and the values of Zamyatnin (1984).
Global, weighted fits of sedimentation equilibrium data obtained at three concentrations of protein to a model of reversible monomer ⇋ dimer association (with fully competent species present) were made using software provided by Allen P. Minton (NIDDK/NIH). Baselines were held constant at zero absorbance at 280 nm (as predetermined by buffer–buffer runs). Trimers and tetramers of enzyme I were not detectible. This analysis is extremely sensitive to cases in which chemical equilibrium of proteins with effectors was not achieved, and in these cases the data could not be analyzed. For all accepted data, residuals from fits of data to a monomer-dimer equilibrium were randomly distributed around zero within < ± 0.01 absorbance deviations. For conversion of 280-nm absorbance values of apparent dimerization constants (Kobs) to the true concentration-dependent association constants, K1,2′ values (expressed per molar concentrations of monomer), it is assumed that the extinction coefficient of the monomer does not change upon dimerization and that the specific absorbance coefficient at 280 nm (A) is 0.40 cm2/mg (Waygood 1986). Thus, Kobs = A2/A2 = (2/ɛ,) (K1,2′), where A, the specific absorbance of the monomer, and the molar extinction coefficient (ɛ,) are for a 1.2-cm path length. Monomer Mr values of 63,600 or 63,500 [EI or EI(H189Ar)] are used to calculate, ɛ, resulting in the equations: log K1,2′ = 4.184 + log Kobs or log K1,2′ = 4.183 + log Kobs, respectively.
Acknowledgments
We thank Zhibing Lu, a graduate student of Dr. Debra Dunaway-Mariano (Department of Chemistry, University of New Mexico), for the gift of his synthesized phosphonopyruvate, and Dr. Henry M. Fales (LBC, NHLBI) for obtaining and analyzing mass spectra of the phosphonopyruvate sample used here. A.G. also appreciates the correspondence with John Brandts and the assistance of G. Piszczek for clarifying the differences between the equations given in Brandts et al. (1989) and Brandts and Lin (1990) which were applied in our studies.
The publication costs of this article were defrayed in part by payment of page charges. This article must therefore be hereby marked "advertisement" in accordance with 18 USC section 1734 solely to indicate this fact.
Abbreviations
PEP, phosphoenolpyruvate
Pyr, pyruvate
PPyr, phosphonopyruvate
PTS, phosphoenolpyruvate:sugar phosphotransferase system
EI, enzyme I (575 amino acid residues) of the PTS
dephospho-EI, nonphosphorylated enzyme I
phospho-EI, phosphorylated enzyme I containing phospho-His189
EI(H189A), EI in which the active-site His189 has been replaced by alanine
HPr, histidine-containing phosphocarrier protein (∼9 kD)
ME, 2-mercaptoethanol
2,4-DNPH, 2,4-dinitrophenylhydrazine
Hepes, N-(2-hydroxyethyl)piperazine-N′-2-ethane-sulfonic acid
Trp fluorescence, intrinsic tryptophanyl residue fluorescence
DSC, differential scanning calorimetry
ITC, isothermal titration calorimetry
K1,2, dimerization constant expressed per mole monomer of dephospho-EI or EI(H189A)
Article and publication are at http://www.proteinscience.org/cgi/doi/10.1110/ps.0352103.
References
- Becktel, W.J. and Schellman, J.A. 1987. Protein stability curves. Biopolymers 26 1859–1877. [DOI] [PubMed] [Google Scholar]
- Brandts, J.F. and Lin, L.-N. 1990. Study of strong to ultratight protein interactions using differential scanning calorimetry. Biochemistry 29 6927–6940. [DOI] [PubMed] [Google Scholar]
- Brandts, J.F., Hu, C.Q., Lin, L.-N., and Mas, M.T. 1989. A simple model for proteins with interacting domains. Applications to scanning calorimetry data. Biochemistry 28 8588–8596. [DOI] [PubMed] [Google Scholar]
- Brokx, S., Talbot, J., Georges, F., and Waygood, E.B. 2000. Enzyme I of the phosphoenol-pyruvate:sugar phosphotransferase system. In vitro intragenic complementation: The roles of Arg126 in phosphoryl transfer and the C-terminal domain in dimerization. Biochemistry 39 3624–3635. [DOI] [PubMed] [Google Scholar]
- Chauvin, F., Brand, L., and Roseman, S. 1996. Enzyme I: The first protein and potential regulator of the bacterial phosphoenolpyruvate: Glycose phosphotransferase system. Res. Microbiol. 147 471–479. [DOI] [PubMed] [Google Scholar]
- Dimitrova, M.N., Szczepanowski, R.H., Ruvinov, S.B., Peterkofsky, A., and Ginsburg, A. 2002. Interdomain interaction and substrate coupling effects on dimerization and conformational stability of enzyme I of the Escherichia coli phosphoenolpyruvate:sugar phospotransferase system. Biochemistry 41 906–913. [DOI] [PubMed] [Google Scholar]
- Ginsburg, A. and Peterkofsky, A. 2002. Enzyme I: The gateway to the bacterial phosphoenol-pyruvate:sugar phosphotransferase system. Arch. Biochem. Biophys. 397 273–278. [DOI] [PubMed] [Google Scholar]
- Ginsburg, A. and Zolkiewski, M. 1991. Differential scanning calorimetry study of reversible, partial unfolding transitions in dodecameric glutamine synthetase from Escherichia coli. Biochemistry 30 9421–9429. [DOI] [PubMed] [Google Scholar]
- Ginsburg, A., Szczepanowski, R.H., Ruvinov, S.B., Nosworthy, N.J., Sondej, M., Umland, T.C., and Peterkofsky, A. 2000. Conformational stability changes of the amino terminal domain of enzyme I of the Escherichia coli phosphoenolpyruvate:sugar phosphotransferase system produced by substituting alanine or glutamate for the active-site histidine 189: Implications for phosphorylation effects. Protein Sci. 9 1085–1094. [DOI] [PMC free article] [PubMed] [Google Scholar]
- Gunsalus, I.C. and Stamer, J.R. 1955. Transaminases in bacteria. Methods Enzymol. 2 170–177. [Google Scholar]
- Herzberg, O., Chen, C.C.H., Liu, S., Tempczyk, A., Howard, A., Wei, M., Ye, D., and Dunaway-Mariano, D. 2002. Pyruvate site of pyruvate phosphate dikinase: Crystal structure of the enzyme-phosphonopyruvate complex, and mutant analysis. Biochemistry 41 780–787. [DOI] [PubMed] [Google Scholar]
- Hogema, B.M., Arents, J.C., Bader, R., Eijkemans, K., Yoshida, H., Takahashi, H., Aiba, H., and Postma, P.W. 1998. Inducer exclusion in Escherichia coli by non-PTS substrates: The role of the PEP to pyruvate ratio in determining the phosphorylation state of enzyme IIAGlc. Mol. Microbiol. 30 487–498. [DOI] [PubMed] [Google Scholar]
- Kirchhoff, W.H. 1993. EXAM: A two-state thermodynamic analysis program. NIST Technical Note 1401: EXAM (CODEN:NTNOEF). U.S. Government Printing Office, Washington, DC.
- Kukuruzinska, M.A., Turner, B.W., Ackers, G.K., and Roseman, S. 1984. Subunit association of enzyme I of the Salmonella typhimurium phosphoenolpyruvate:glycose phosphotransferase system. Temperature dependence and thermodynamic properties. J. Biol. Chem. 259 11679–11681. [PubMed] [Google Scholar]
- Laemmli, U.K. 1970. Cleavage of structural proteins during the assembly of the head of bacteriophage T4. Nature (London) 227 680–685. [DOI] [PubMed] [Google Scholar]
- LiCalsi, C., Crocenzi, T.S., Freire, E., and Roseman, S. 1991. Sugar transport by the bacterial phosphotransferase system: Structural and thermodynamic domains of enzyme I of Salmonella typhimurium. J. Biol. Chem. 266 19519–19527. [PubMed] [Google Scholar]
- Meadow, N.D., Fox, D.K., and Roseman, S. 1990. The phosphoenolpyruvate:glycose phosphotransferase system. Annu. Rev. Biochem. 59 497–542. [DOI] [PubMed] [Google Scholar]
- Misset, O., Brouwer, M., and Robillard, G.T. 1980. Escherichia coli phosphoenolpyruvate-dependent phosphotransferase system. Evidence that the dimer is the active form of enzyme I. Biochemistry 19 883–890. [DOI] [PubMed] [Google Scholar]
- Nosworthy, N.J., Peterkofsky, A., König, S., Seok, Y.-J., Szczepanowski, R.H., and Ginsburg, A. 1998. Phosphorylation destabilizes the amino-terminal domain of enzyme I of the Escherichia coli phosphoenolpyruvate:sugar phosphotransferase system. Biochemistry 37 6718–6726. [DOI] [PubMed] [Google Scholar]
- Peterkofsky, A. 1988. Redistribution of phosphate pools and the regulation of Escherichia coli adenylate cyclase activity. Arch. Biochem. Biophys. 265 227–233. [DOI] [PubMed] [Google Scholar]
- Plotnikov, V.V., Brandts, J.M., Lin, L-N., and Brandts, J.F. 1997. A new ultrasensitive scanning calorimeter. Anal. Biochem. 250 237–244. [DOI] [PubMed] [Google Scholar]
- Postma, P.W., Lengeler, J.W., and Jacobson, G.R. 1996. Phosphoenolpyruvate: carbohydrate phosphotransferase systems. In Escherichia coli and Salmonella. Cellular and molecular biology (ed. F.C. Neidhardt), pp. 1149–1174. ASM Press, Washington, DC.
- Rohwer, J.M., Meadow, N.D., Roseman, S., Westerhoff, H.V., and Postma, P.W. 2000. Understanding glucose transport by the bacterial phosphoenolpyruvate:glycose phosphotransferase system on the basis of kinetic measurements in vitro. J. Biol. Chem. 275 34909–34921. [DOI] [PubMed] [Google Scholar]
- Rosenberg, H., Russell, L.M., Jacomb, P.A., and Chegwidden, K. 1982. Phosphate exchange in the Pit transport system in Escherichia coli. J. Bacteriol. 149 123–130. [DOI] [PMC free article] [PubMed] [Google Scholar]
- Saier, M.H., Schmidt, M.R., and Lin, P. 1980. Phosphoryl exchange reaction catalyzed by enzyme I of the bacterial phosphoenolpyruvate: Sugar phosphotransferase system. Kinetic characterization. J. Biol. Chem. 255 8579–8584. [PubMed] [Google Scholar]
- Seok, Y.-J., Lee, B.R., Svenson, I., Yadla, N., and Peterkofsky, A. 1996. Importance of the region around glycine-338 for the activity of enzyme I of the Escherichia coli phosphoenolpyruvate:sugar phosphotransferase system. Biochemistry 35 236–242. [DOI] [PubMed] [Google Scholar]
- Seok, Y.-J., Zhu, P.-P., Koo, B.-M., and Peterkofsky, A. 1998. Autophosphorylation of enzyme I of the Escherichia coli phosphoenolpyruvate:sugar phosphotransferase system requires dimerization. Biochem. Biophys. Res. Commun. 250 381–384. [DOI] [PubMed] [Google Scholar]
- Sparkes, M.J., Rogers, K.L, and Dixon, H.B.F. 1990. The synthesis of 3-phosphonoalanine, phosphonopyruvic acid and phosphonolactic acid. Scission of the C-P bond during diazotization of phosphonoalanine. Eur. J. Biochem. 194 373–376. [DOI] [PubMed] [Google Scholar]
- Waygood, E.B. 1986. Enzyme I of the phosphoenolpyruvate:sugar phosphotransferase system has two sites of phosphorylation per dimer. Biochemistry 25 4085–4090. [DOI] [PubMed] [Google Scholar]
- Waygood, E.B., Meadow, N.D., and Roseman, S. 1979. Modified assay procedures for the phosphotransferase system in enteric bacteria. Anal. Biochem. 95 293–304. [DOI] [PubMed] [Google Scholar]
- Zamyatnin, A. 1984. Amino acid, peptide, and protein volume in solution. Annu. Rev. Biophys. Bioeng. 13 145–165. [DOI] [PubMed] [Google Scholar]
- Zhu, P.-P., Szczepanowski, R.H., Nosworthy, N.J., Ginsburg, A., and Peterkofsky, A. 1999. Reconstitution studies using the helical and carboxy-terminal domains of enzyme I of the phosphoenolpyruvate:sugar phosphotransferase system. Biochemistry 38 15470–15479. [DOI] [PubMed] [Google Scholar]
- Zolkiewski, M. and Ginsburg, A. 1992. Thermodynamic effects of active-site ligands on the reversible, partial unfolding of dodecameric glutamine synthetase from Escherichia coli: Calorimetric studies. Biochemistry 31 11991–12000. [DOI] [PubMed] [Google Scholar]