

Abstract
We have carried out a thorough and systematic sequence-structure study on how the pattern of conservation at the interface differs from the noninteracting surface in seven proteases and their inhibitors. As expected, the interface of a protease could be easily distinguished from the noninteracting surface by a concentrated area of conservation. In contrast, there was less distinction to be made between the interface and the noninteracting surface of inhibitors, and in five of the seven cases, a higher proportion of the interface area was variable compared to the rest of the surface. This is likely to cause a problem for binding-site prediction methods that assume the largest cluster of highly conserved residues on the surface of a protein corresponds to the interface. We conclude that such methods would succeed when applied to our protease test cases, but complications could arise with the inhibitors. These results also impact on methods to solve the protein–protein docking problem that use conservation at the interface to provide the location of the two protein binding sites prior to application of the docking algorithm.
Keywords: Evolution, conservation, protein surface, protein interactions, bioinformatics, computational
The "docking problem" can be defined as follows: Given the atomic coordinates of two proteins known to interact, what is the structure of their complex? A number of attempts have been made at developing algorithms to solve the docking problem (for review, see Halperin et al. 2002), but only some of these methods can achieve results using only the coordinates of the individual proteins. Others rely on biological information such as location of protein binding sites to aid prediction. The most common approach to identifying a binding site is to look for clusters of highly conserved residues on the surface of the protein, the largest cluster corresponding to the binding site (for review, see Lichtarge and Sowa 2002). Although this is successful in most cases, particularly for enzymes such as trypsin (Rypniewski et al. 1994) and homodimers (Valdar and Thornton 2001), there are a number of instances where prediction fails. The most well-documented cases involve the major histocompatibility complex (MHC) molecules of the immune system, which rely on a high mutation rate at their interface to bind foreign proteins. The interfaces of some protease inhibitors are also characterized by hypervariability of amino acids (Laskowski and Kato 1980; Hill and Hastie 1987; Laskowski Jr. et al. 1987; Borriello and Krauter 1991; Inglis and Hill 1991), although the reason for this hypervariability remains unclear. A number of workers have suggested that in inhibitors required to adapt to a range of exogenous proteases, positive Darwinian selection, during which functionally beneficial mutations are fixed, may cause a short period of rapid mutation at the interface (Hill and Hastie 1987; Creighton and Darby 1989; Borriello and Krauter 1991; Inglis and Hill 1991; Rheaume et al. 1994; Goodwin et al. 1996; Zang and Maizels 2001). In cases where there is little constraint on the chemistry at the enzyme inhibitor interface, subtle conformational changes controlled by residues at points other than the interface may discriminate between different enzyme targets (Pritchard and Dufton 1999). Most of the inhibitor families studied so far, namely the Bowman-Birk (Hilder et al. 1989), Kazal (Laskowski et al. 1987), serpin (Hill and Hastie 1987; Inglis and Hill 1991; Rheaume et al. 1994; Goodwin et al. 1996; Zang and Maizels 2001), cystatin (Creighton and Darby 1989), and Kunitz (Creighton and Charles 1987; Pritchard and Dufton 1999) families, are thought to display hypervariability at the interface. The one exception has been the potato chymotrypsin inhibitor I family (Beuning et al. 1994).
All the above studies were based on information from sequence alone with inhibitory residues drawn from studies such as site-directed mutagenesis. Without structural information about enzyme–inhibitor complexes, it is impossible to know precisely which residues are involved in molecular recognition at the interface. Here, we extend the work of Valdar and Thornton (2001) on homodimers by providing a thorough and systematic sequence–structure study on how the pattern of conservation at the interface differs from the noninteracting surface in seven proteases and their inhibitors, all of which have been used to test docking algorithms in the past. We then discuss the relevance of the results to binding site prediction and their impact on attempts to solve the docking problem.
We were well aware that conservation at enzyme interfaces had already been thoroughly investigated; therefore, our main focus in this study was on the inhibitor interfaces. With this in mind, our priority in choosing the test cases was to represent as many different inhibitor families as possible regardless of the enzymes with which they were in complex. As a consequence, there was some redundancy between the enzyme test cases but seven different inhibitor families were represented including two previously uncharacterized interfaces of the leguminous Kunitz and the Streptomyces subtilisin inhibitor (SSI) families (Table 1).
Table 1.
Test cases used in this investigation and the number of homologs selected from each BLAST search
| Protease | Inhibitor | ||||||
| PDB code | Name | Family | Number of homologs | Name | Family | Number of homologs | Reference |
| 1avw | Trypsin | S1 | 332 | Soybean trypsin inhibitor | Leguminous Kunitz | 24 | Song and Suh 1998 |
| 1cho | Chymotrypsin | S1 | 332 | Ovomucoid 3rd domain | Kazal | 91 | Fujinaga et al. 1987 |
| 1stf | Papain | C1 | 88 | Stefin | Cystatin | 18 | Stubbs et al. 1990 |
| 1tab | Trypsin | S1 | 332 | Bowman Birk inhibitor | Bowman-Birk | 24 | Tsunogae et al. 1986 |
| 2ptc | Trypsin | S1 | 332 | Pancreatic trypsin inhibitor | Kunitz | 102 | Marquart et al. 1983 |
| 2sic | Subtilisin BPN | S8 | 86 | Subtilisin inhibitor | Streptomyces subtilisin inhibitor | 20 | Takeuchi et al. 1991 |
| 2sni | Subtilisin novo | S8 | 86 | Chymotrypsin inhibitor 2 | Potato chymotrypsin I | 22 | McPhalen and James 1988 |
Families were assigned according to the Pfam classification (Bateman et al. 2002).
Results
We generated sets of surface vertices representing the solvent excluded surfaces of each individual protein with one surface residue being equivalent to at least one surface vertex depending on the extent to which the residue was exposed at the surface. As many as 50 surface vertices could be associated with a fully exposed residue. Every surface vertex was labeled with the conservation class ("conserved," "intermediate," or "variable") and the type of surface to which it belonged ("interface" or "noninteracting"). From this information, the percentage of each conservation class within both the interface and noninteracting surface was calculated (Table 2), and the ratio between the two (using the interface percentage as the numerator) determined. We refer to this ratio as the "rate ratio." Using surface vertices rather than surface residues in this way allowed the area that each residue covered at the surface to be taken into consideration. For example, in a situation where one atom of a protein core residue was exposed at the interface, only a very small number of vertices, maybe just one, would correspond to this residue. Therefore, the effect of core residues extending to the interface on the rate ratio calculation would be negligible.
Table 2.
Percentage of surface vertices within each conservation class ("variable," "intermediate," and "conserved") at the interface and on noninteracting surface of seven protease-inhibitor test cases
| Protease | Inhibitor | ||||
| PDB code | Level | Interface | Noninteracting | Interface | Noninteracting |
| 1avw | Variable | 40.5% | 55.7% | 46.9% | 43.2% |
| Intermediate | 22.6% | 38.0% | 44.3% | 35.1% | |
| Conserved | 36.9% | 6.3% | 8.8% | 21.7% | |
| 1cho | Variable | 27.7% | 47.9% | 71.3% | 35.7% |
| Intermediate | 31.9% | 45.1% | 14.5% | 13.6% | |
| Conserved | 40.4% | 7.0% | 14.2% | 50.7% | |
| 1stf | Variable | 16.3% | 56.1% | 25.4% | 34.1% |
| Intermediate | 20.6% | 29.3% | 19.7% | 28.2% | |
| Conserved | 63.0% | 14.6% | 54.8% | 37.7% | |
| 1tab | Variable | 35.7% | 55.6% | 63.0% | 39.2% |
| Intermediate | 19.2% | 38.1% | 0.0% | 28.8% | |
| Conserved | 45.1% | 6.3% | 37.0% | 32.1% | |
| 2ptc | Variable | 46.9% | 56.5% | 26.3% | 53.8% |
| Intermediate | 21.2% | 36.7% | 53.3% | 34.9% | |
| Conserved | 32.0% | 6.9% | 20.3% | 11.3% | |
| 2sic | Variable | 21.2% | 49.1% | 52.5% | 38.5% |
| Intermediate | 20.9% | 38.6% | 35.5% | 21.7% | |
| Conserved | 57.9% | 12.2% | 11.9% | 39.7% | |
| 2sni | Variable | 6.7% | 50.5% | 33.7% | 27.9% |
| Intermediate | 27.5% | 37.5% | 19.7% | 45.1% | |
| Conserved | 65.9% | 12.1% | 46.6% | 27.0% | |
In all the protease enzymes under test, the conserved proportion of the interface was between four and seven times greater than the conserved proportion of the noninteracting surface (Fig. 1A ▶). There was less distinction in terms of variable vertices, although in all cases a smaller proportion of the interface was variable compared with the rest of the protease surface, as illustrated as a rate ratio less than one in Figure 1B ▶.
Figure 1.
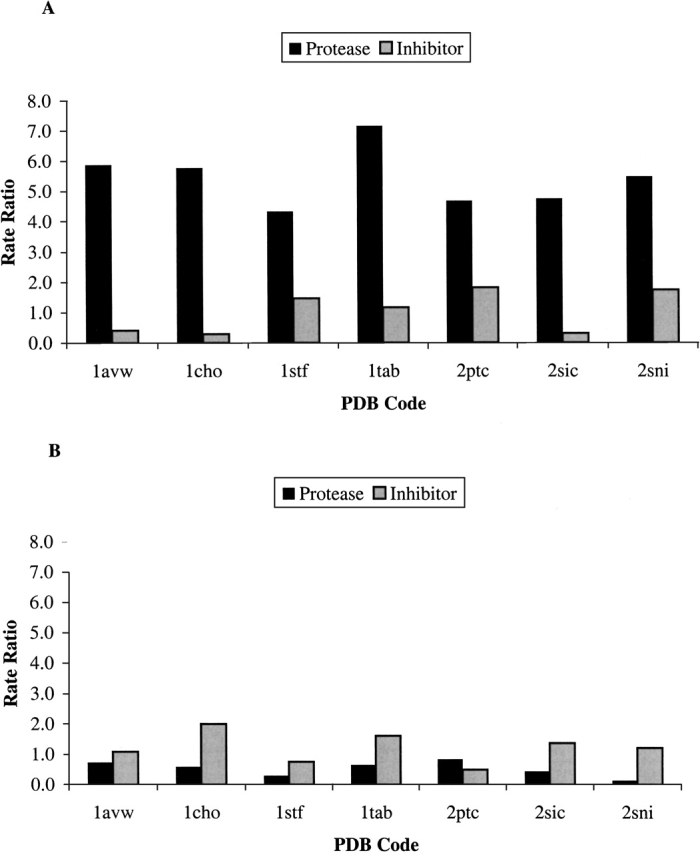
Comparison of conservation between the interface and noninteracting surfaces in seven protease–inhibitor complexes. The histograms show the "rate ratio" of (A) conserved and (B) variable surface vertices between interface and noninteracting surfaces in proteases and inhibitors. This ratio is determined by dividing the percentage of conserved (or variable) surface vertices within the interface by the corresponding percentage in the noninteracting surface.
Results were less straightforward for the inhibitors. The leguminous Kunitz (1avw), Kazal (1cho), and SSI (2sic)-type families contained a greater proportion of conserved vertices in the noninteracting surface than in the interface as indicated by a rate ratio less than one (Fig. 1A ▶). Even when there was a greater proportion of conserved vertices at the interface as in the other four inhibitors, the ratio was never greater than two. Only two inhibitor families, the cystatins (1stf) and Kunitz type (2ptc), had a greater percentage of variable vertices in the noninteracting surface than in the interface (rate ratios less than one in Fig. 1B ▶). In the Bowman-Birk (1tab) and SSI (2sic) families, over 50% of the interface was variable, although in the Kazal family (1cho) that figure was more than 70% (see Table 2 for data). The interface of the Kazal type inhibitors actually contained the most hypervariable residues of the entire protein (data not shown). This is in agreement with Laskowski et al. (1987), who studied the avian ovomucoids making up the majority of our Kazal type inhibitors in the multiple sequence alignment.
Discussion
This study illustrates the difficulty in applying the same model of binding site prediction to every protein case. For most binding site prediction algorithms to succeed there must be a clear distinction between the conservation pattern at the binding site and that of the rest of the protein. It is also assumed that the most functionally important residues are conserved and clustered at the interface. The proteases used in this study all display a significantly higher concentration of conserved vertices at the interface compared to the noninteracting surface. This is in contrast to the inhibitors where the difference between interface and noninteracting surface is much less distinct and varies from case to case. Some inhibitors even show greater variability in the interface residues than the noninteracting residues.
The most significant factor making binding site prediction easier for proteases than inhibitors is the lack of conserved vertices at the noninteracting surface of the protease. Even though the cystatin, Kunitz, and potato chymotrypsin I type inhibitors all follow the "rules" of binding site prediction to some extent, there is still a significant amount of conservation outside the interface, which makes identifying the conserved cluster of vertices at the actual interface difficult. This also supports the hypothesis that the residues in the interface are not wholly responsible for the specificity of the inhibitor, and there are some functionally important residues elsewhere (Pritchard and Dufton 1999).
The results described here have implications for the protein–protein docking problem. Docking algorithms are often facilitated by first identifying the binding sites on the two interacting proteins assuming that the largest cluster of conserved residues occurs at the interface. Many test cases involve enzyme–inhibitor complexes, but in almost all the inhibitors studied so far, binding site prediction would fail. When the inhibitor is small, locating the binding site on the enzyme only may suffice, but in instances where the inhibitor is large, binding site prediction for both the enzyme and inhibitor could be important in reducing computing time for the docking calculation.
Materials and methods
Test case selection
Test cases were selected from a "benchmark" collection of protein complexes expected to be of use in testing novel protein docking prediction algorithms (Chen et al. 2003). The structures of all these complexes can be downloaded from the Protein Data Bank (PDB; Berman et al. 2000). The collection contains 22 enzyme inhibitor complexes, only seven of which made our final list of test cases owing to a stringent filtering procedure. The first step was to remove two complexes in which the protease had been engineered to bind to an inhibitor different from its natural inhibitor because any artificial residue substitutions would give a false rate of evolution for that position. For complexes in which the enzyme and inhibitor were from the same families as those in another complex, only the highest resolution structure was retained. Finally, a reliable evolution rate calculation required that both the enzyme and inhibitor had more than 10 family members within the Swissprot database. A complete list of test cases and their associated PDB codes is given in Table 1.
Blast search
For each test case, a BLAST search (Altschul et al. 1997) for close homologous sequences of both the enzyme and inhibitor sequences was carried out against the Swissprot v40.38 database. All query sequences were extracted from the ATOM records of the PDB file rather than from the SEQRES records. SEQRES records often differ from the ATOM records, so their use may have produced errors when mapping the evolution rates calculated at each amino acid position onto the protein structure.
Each BLAST hit was validated manually before being included in the multiple sequence alignment. Only hits with an e-value of less than 0.001 and containing the domain characteristic of the family to which the query sequence belonged were accepted. If a protein contained more than one such domain, then each domain was isolated and treated as separate sequence. Hits not experimentally proven to perform a similar function to the query, such as probable or hypothetical sequences, were removed, as were fragments and proteins containing ambiguities within the sequence.
Multiple sequence alignment
The homologous sequences from the BLAST search and the query sequence were written to a single file in FASTA format. This file was then used as input to CLUSTAL W, a program that will globally align all the protein sequences and output a multiple sequence alignment file (Thompson et al. 1994).
Calculating the rate of evolution
The rate of evolution was calculated for each residue in the protein sequence using the Rate4Site algorithm (Pupko et al. 2002) accessed via the Consurf server (Glaser et al. 2003). Rate4Site is an extension of the evolutionary trace method devised by Lichtarge et al. (1996) but utilizes an improved tree-building approach. For each multiple sequence alignment, Rate4Site builds an evolutionary tree and then calculates a conservation score for each residue position using either a maximum likelihood or maximum parsimony method. We used the maximum likelihood method. Each score is normalized, so that the average score for all residues is zero, and the standard deviation is 1. This means that the lowest scoring position is not always absolutely conserved, but is considered to be the most conserved residue in that particular protein. The scores are then divided into 4.5 equal intervals above and below zero thus producing nine levels of conservation. Level one contains residues undergoing the fastest rates of evolution in the protein, whereas level nine contains residues undergoing the slowest rates of evolution. For this study, residues were further classified as "variable" (levels 1–3), "intermediate" (4–6), or "conserved" (7–9).
Protein surface generation and interface definition
All the protein surfaces used in this study were solvent excluded surfaces (Connolly 1983) generated with a probe sphere of radius 1.5 Å using code developed by Sanner and Olson (1996). As well as the coordinates of the surface vertices, the program also supplied the solvent accessible surface area of each atom. An atom was defined as part of the interface if it loses more than 99% of its solvent-accessible surface area upon complex formation. Although values less than 99% did not make any significant difference to results, a strict threshold ensured that only the innermost interface atoms were selected. Any atom not allocated to the interface was deemed part of the "noninteracting" surface. Given that each surface atom corresponded to at least one surface vertex, if an atom was part of the interface, then all the surface vertices associated with that atom were assigned to the interface as well. Likewise, given that each surface residue was equivalent to many surface vertices (usually around 30), each surface vertex was labeled with the conservation class associated with its corresponding residue.
Electronic supplemental material
Two diskettes of electronic supplementary material are provided. Diskette 1 contains the seven multiple sequence alignment files of the protease test cases, and a Microsoft Word 97 file, "supp_tables. doc," containing three tables. Table 1 gives the number of interface vertices and the total number of surface vertices on each protein. Table 2 indicates the number of amino acids found both within and outside each interface. Table 3 shows the percentage of residues within each conservation class at the interface and on the non-interacting surface.
Diskette 2 contains the seven multiple sequence alignment files of the inhibitor test cases.
Diskette 1 filenames: 1avw_A.aln, 1cho_E.aln, 1stf_E.aln, 1tab_E.aln, 2ptc_E.aln, 2sic_E.aln, 2sni_E.aln, supp_tables.doc. Diskette 2 filenames: 1avw_B.aln, 1cho_I.aln, 1stf_I.aln, 1tab_I.aln, 2ptc_I.aln, 2sic_I.aln, 2sni_I.aln.
Acknowledgments
We thank the Biotechnology and Biological Sciences Research Council (BBSRC) for sponsorship.
The publication costs of this article were defrayed in part by payment of page charges. This article must therefore be hereby marked "advertisement" in accordance with 18 USC section 1734 solely to indicate this fact.
Article and publication are at http://www.proteinscience.org/cgi/doi/10.1110/ps.0306303.
References
- Altschul, S.F., Madden, T.L., Schaffer, A.A., Zhang, J., Zhang, Z., Miller, W., and Lipman, D.J. 1997. Gapped BLAST and PSI-BLAST: A new generation of protein database search programs. Nucleic Acids Res. 25 3389–3402. [DOI] [PMC free article] [PubMed] [Google Scholar]
- Bateman, A., Birney, E., Cerruti, L., Durbin, R., Etwiller, L., Eddy, S.R., Griffiths-Jones, S., Howe, K.L., Marshall, M., and Sonnhammer, E.L. 2002. The Pfam protein families database. Nucleic Acids Res. 30 276–280. [DOI] [PMC free article] [PubMed] [Google Scholar]
- Berman, H.M., Westbrook, J., Feng, Z., Gilliland, G., Bhat, T.N., Weissig, H., Shindyalov, I.N., and Bourne, P.E. 2000. The protein data bank. Nucleic Acids Res. 28 235–242. [DOI] [PMC free article] [PubMed] [Google Scholar]
- Beuning, L.L., Spriggs, T.W., and Christeller, J.T. 1994. Evolution of the proteinase inhibitor I family and apparent lack of hypervariability in the proteinase contact group. J. Mol. Evol. 39 644–654. [DOI] [PubMed] [Google Scholar]
- Borriello, F. and Krauter, K.S. 1991. Multiple murine α1-protease inhibitor genes show unusual evolutionary divergence. Proc. Natl. Acad. Sci. 88 9417–9421. [DOI] [PMC free article] [PubMed] [Google Scholar]
- Chen, R., Mintseris, J., Janin, J., and Weng, Z. 2003. A protein–protein docking benchmark. Proteins 52 88–91. [DOI] [PubMed] [Google Scholar]
- Connolly, M.L. 1983. Analytical molecular surface calculation. J. Appl. Crystallogr. 16 548–558. [Google Scholar]
- Creighton, T.E. and Charles, I.G. 1987. Biosynthesis, processing, and evolution of bovine pancreatic trypsin inhibitor. Cold Spring Harbor Symposium on Quantitative Biology. LII 511–519. [DOI] [PubMed] [Google Scholar]
- Creighton, T.E. and Darby, N.J. 1989. Functional evolutionary divergence of proteolytic enzymes and their inhibitors. Trends Biosci. 14 319–324. [DOI] [PubMed] [Google Scholar]
- Fujinaga, M., Sielecki, A.R., Read, R.J., Ardelt, W., Laskowski Jr., M., and James, M.N. 1987. Crystal and molecular structures of the complex of α-chymotrypsin with its inhibitor turkey ovomucoid third domain at 1.8 Å resolution. J. Mol. Biol. 195 397–418. [DOI] [PubMed] [Google Scholar]
- Glaser, F., Pupko, T., Paz, I., Bell, R.E., Bechor-Shental, D., Martz, E., and Ben-Tal, N. 2003. Consurf: Identification of functional regions in proteins by surface-mapping of phylogenetic information. Bioinformatics 19 163–164. [DOI] [PubMed] [Google Scholar]
- Goodwin, R.L., Baumann, H., and Berger, F.G. 1996. Patterns of divergence during evolution of α1-proteinase inhibitors in mammals. Mol. Biol. Evol. 13 346–358. [DOI] [PubMed] [Google Scholar]
- Halperin, I., Ma, B., Wolfson, H., and Nussinov, R. 2002. Principles of docking: An overview of search algorithms and a guide to scoring functions. Proteins 47 409–443. [DOI] [PubMed] [Google Scholar]
- Hilder, V.A., Barker, R.F., Samour, R.A., Gatehouse, A.M.R., Gatehouse, J.A., and Boulter, D. 1989. Protein and cDNA sequences of Bowman-Birk protease inhibitors from the cowpea (Vigna unguiculata Walp.). Plant Mol. Biol. 13 701–710. [DOI] [PubMed] [Google Scholar]
- Hill, R.E. and Hastie, N.D. 1987. Accelerated evolution in the reactive centre regions of serine protease inhibitors. Nature 326 96–99. [DOI] [PubMed] [Google Scholar]
- Inglis, J.D. and Hill, R.E. 1991. The murine Spi-2 proteinase inhibitor locus: A multigene family with a hypervariable reactive site domain. EMBO J. 10 255–261. [DOI] [PMC free article] [PubMed] [Google Scholar]
- Laskowski, M., Kato, I., Ardelt, W., Cook, J., Denton, A., Empie, M.W., Kohr, W.J., Park, S.J., Parks, K., and Schatzley, B.L. 1987. Ovomucoid third from 100 avian species: Isolation, sequences, and hypervariability of enzyme-inhibitor contact residues. Biochemistry 26 202–221. [DOI] [PubMed] [Google Scholar]
- Laskowski Jr., M. and Kato, I. 1980. Protein inhibitors of proteinases. Annu. Rev. Biochem. 49 593–626. [DOI] [PubMed] [Google Scholar]
- Laskowski Jr., M., Kato, I., Kohr, W.J., Park, S.J., Tashiro, M., and Whatley, H.E. 1987. Positive Darwinian selection in evolution of protein inhibitors of serine proteases. Cold Spring Harb. Symp. Quant. Biol. 52 545–553. [DOI] [PubMed] [Google Scholar]
- Lichtarge, O. and Sowa, M.E. 2002. Evolutionary predictions of binding surfaces and interactions. Curr. Opin. Struct. Biol. 12 21–27. [DOI] [PubMed] [Google Scholar]
- Lichtarge, O., Bourne, H.R., and Cohen, F.E. 1996. An evolutionary trace method defines binding surfaces common to protein families. J. Mol. Biol. 257 342–358. [DOI] [PubMed] [Google Scholar]
- Marquart, M., Walter, J., Deisenhofer, J., Bode, W., and Huber, R. 1983. The geometry of the reactive site and of the peptide groups in trypsin, trypsinogen and its complexes with inhibitors. Acta Crystallogr. Sect. B 39 480–490. [Google Scholar]
- McPhalen, C.A. and James, M.N. 1988. Structural comparison of two serine proteinase–protein inhibitor complexes: Eglin-c-subtilisin Carlsberg and CI-2-subtilisin Novo. Biochemistry 27 6582–6598. [PubMed] [Google Scholar]
- Pritchard, L. and Dufton, M.J. 1999. Evolutionary trace analysis of the Kunitz/BPTI family of proteins: Functional divergence may have been based on conformational adjustment. J. Mol. Biol. 285 1589–1607. [DOI] [PubMed] [Google Scholar]
- Pupko, T., Bell, R.E., Mayrose, I., Glaser, F., and Ben-Tal, N. 2002. Rate4Site: An algorithmic tool for the identification of functional regions in proteins by surface mapping of evolutionary determinants within their homologues. Bioinformatics 18 (Suppl 1): S71–S77. [DOI] [PubMed] [Google Scholar]
- Rheaume, C., Goodwin, R.L., Latimer, J.J., Baumann, H., and Berger, F.G. 1994. Evolution of murine α1-proteinase inhibitors: Gene amplification and reactive centre divergence. J. Mol. Evol. 38 121–131. [DOI] [PMC free article] [PubMed] [Google Scholar]
- Rypniewski, W.R., Perrakis, A., Vorgias, C.E., and Wilson, K.S. 1994. Evolutionary divergence and conservation of trypsin. Protein Eng. 7 57–64. [DOI] [PubMed] [Google Scholar]
- Sanner, M.F. and Olson, A.J. 1996. Reduced surface: An efficient way to compute molecular surfaces. Biopolymers 38 305–320. [DOI] [PubMed] [Google Scholar]
- Song, H.K. and Suh, S.W. 1998. Kunitz-type soybean trypsin inhibitor revisited: Refined structure of its complex with porcine trypsin reveals an insight into the interaction between a homologous inhibitor from Erythrina caffra and tissue-type plasminogen activator. J. Mol. Biol. 275 347–363. [DOI] [PubMed] [Google Scholar]
- Stubbs, M.T., Laber, B., Bode, W., Huber, R., Jerala, R., Lenarcic, B., and Turk, V. 1990. The refined 2.4Å X-ray crystal structure of recombinant human stefin B in complex with the cysteine proteinase papain: A novel type of proteinase inhibitor interaction. EMBO J. 9 1939–1947. [DOI] [PMC free article] [PubMed] [Google Scholar]
- Takeuchi, Y., Satow, Y., Nakamura, K.T., and Mitsui, Y. 1991. Refined crystal structure of the complex of subtilisin BPN′ and Streptomyces subtilisin inhibitor at 1.8 Å resolution. J. Mol. Biol. 221 309–325. [PubMed] [Google Scholar]
- Thompson, J.D., Higgins, D.G., and Gibson, T.J. 1994. CLUSTAL W: Improving the sensitivity of progressive multiple sequence alignment through sequence weighting, positions-specific gap penalties and weight matrix choice. Nucleic Acids Res. 22 4673–4680. [DOI] [PMC free article] [PubMed] [Google Scholar]
- Tsunogae, Y., Tanaka, I., Yamane, T., Kikkawa, J., Ashida, T., Ishikawa, C., Watanabe, K., Nakamura, S., and Takahashi, K. 1986. Structure of the trypsin-binding domain of Bowman-Birk type protease inhibitor and its interaction with trypsin. J. Biochem. (Tokyo) 100 1637–1646. [DOI] [PubMed] [Google Scholar]
- Valdar, W.S.J. and Thornton, J.M. 2001. Protein–protein interfaces: Analysis of amino acid conservation in homodimers. Proteins 42 108–124. [PubMed] [Google Scholar]
- Zang, X. and Maizels, R.M. 2001. Serine proteinase inhibitors from nematodes and the arms race between host and pathogen. Trends Biosci. 26 191–197. [DOI] [PubMed] [Google Scholar]