Abstract
The p53 tumor suppressor gene has been shown to play an important role in determining cell fate. Overexpression of wild-type p53 in tumor cells has been shown to lead to growth arrest or apoptosis. Previous studies in fibroblasts have provided indirect evidence for a link between p53 and senescence. Here we show, using an inducible p53 expression system, that wild-type p53 overexpression in EJ bladder carcinoma cells, which have lost functional p53, triggers the rapid onset of G1 and G2/M growth arrest associated with p21 up-regulation and repression of mitotic cyclins (cyclin A and B) and cdc2. Growth arrest in response to p53 induction became irreversible within 48-72 h, with cells exhibiting morphological features as well as specific biochemical and ultrastructural markers of the senescent phenotype. These findings provide direct evidence that p53 overexpression can activate the rapid onset of senescence in tumor cells.
Keywords: tumor suppression, EJ
Cellular senescence has been thought to reflect a gradual process in which after a particular number of cell doublings, a cell eventually loses replicative capacity (1). It has long been known that tumor cells can overcome this intrinsic biological clock, but the signaling pathways involved have yet to be elucidated (1). Analysis of somatic hybrids between normal and tumor cells or between different tumor cells has revealed that senescence is dominant in such hybrids, and several complementation groups mapping to specific chromosomes including 1, 4, and 7 have been identified (2–4). These findings have implied that normal function of only a small set of genes may be required for cell permissiveness to senescence, and that such functions are lost in the course of tumor progression.
The p53 gene has been shown to be a critical regulator of the cell cycle (5) and is thought to function as a “guardian” of the genome (6). In response to genotoxic stress induced by DNA damage, hypoxia, and subthreshold levels of ribonucleotide triphosphate pools, the level of p53 protein rises and induces cell cycle arrest (either at G1 or G2) or programmed cell death (apoptosis) (5). As further evidence of its central role in maintaining cell homeostasis, loss of p53 function has been found to be the most common alteration observed in cancer cells (7). Although it does not map to a known senescence gene-associated chromosome (8, 9), p53 has been indirectly implicated in senescence of normal diploid fibroblasts (10–16). For example, near-senescent fibroblasts exhibit an extension of their proliferative life span after the stable introduction of mutant p53 (10), and p53 -/- fibroblasts more readily become immortalized in culture (11, 12). p53 expression (13) and transactivation activity (14, 15), as well as expression of p53 response genes such as the p21 cell cycle inhibitor (16), have also been reported to increase in normal fibroblasts as they approach senescence.
In the present study, we sought to directly test the biological and biochemical consequences of activating wild-type p53 expression in human tumor cells exhibiting loss of p53 function. To do so, we utilized the tetracycline (tet)-regulated expression system (17) so that p53 might be expressed in an inducible as well as reversible manner. Our findings demonstrate that wild-type p53 induction activates an irreversible commitment to the rapid progression of a senescence program with characteristic features.
MATERIALS AND METHODS
Cell Culture.
The EJ human bladder carcinoma cell line was maintained in DMEM containing 10% fetal bovine serum (FBS). EJ–p53 cells were maintained in complete culture medium containing DMEM, 10% FBS, pen-strep (50 units/ml), glutamine (2 mM), hygromycin (100 μg/ml), and geneticin (750 μg/ml). To maintain EJ–p53 cells in a repressed state with respect to p53 expression, tet was added to the medium every 3 days to a final concentration of 1 μg/ml. To induce p53 expression, EJ–p53 cells were first rinsed three times with PBS (without Ca2+ or Mg2+) and then switched to culture media lacking tet (i.e., −tet).
Growth Curves.
Log-phase EJ–p53 cells growing in (+)tet medium were seeded at a density of 105 cells/100-mm plate. Cells were allowed to attach (≈8 h) and then cultured in either (+)tet or (−)tet medium (time = 0 h). Cell counts were performed at 24, 48, 72, and 96 h by hemocytometer.
Plasmids and DNA Transfection.
pETH was constructed by ligating the DNA fragment (XhoI–HindIII) from pUHD 15-1 (obtained from H. Bujard, ZMBH, Heidelberg), which contains the tTA expression cassette, into the expression vector pSV40-Hyg, which contains the Hygr gene. pTet–p53 was constructed by subcloning wild-type (wt) p53 cDNA downstream of the tet-regulated promoter into pUHD10-3 (obtained from H. Bujard) which contains neor. EJ cells were serially transfected with each plasmid using the calcium phosphate method (18). Transfectants were selected in the presence of hygromycin (100 μg/ml) and geneticin (750 μg/ml). Stable EJ–ETH clones were tested for transactivator activity using a standard chloramphenicol acetyltransferase (CAT) assay (19, 20). One clone, EJ–ETH-9, which showed the highest CAT activity, was subsequently transfected with pTet-p53. Individual clones of stable double transfectants, named EJ–p53, were selected for further analysis. Similarly, a negative control cell line, EJ–CAT, was created by transfecting EJ–ETH-9 with pTet–CAT.
Northern Blot Analysis.
Total RNA was extracted, denatured, electrophoresed through a 1% agarose-formaldehyde gel hybridization (20 μg total RNA/lane), transferred to a nylon membrane, and hybridized as described (21). Probes were 32P-labeled by using a random primed DNA labeling kit (Boehringer Mannheim).
Immunoblot Analysis.
Total cell lysates were prepared as described (18). Protein quantitation was performed using the BCA protein assay (Pierce). Forty micrograms of total cell protein per sample was subjected to 10% SDS/PAGE and transferred to an Immobilon (Millipore) polyvinylidene difluoride filter. The filter was then blocked in 1% Carnation instant milk/0.1% Tween/PBS followed by incubation with p53 monoclonal 1801 or 421 hybridoma supernatant and immunodetection using the ECL system (Amersham).
Immunocytochemistry.
Cells were seeded onto glass coverslips and maintained in medium with or without tet for 1–4 days. Coverslips were rinsed with PBS, fixed with methanol/acetone (1:1) for 2 min at room temperature, and then stored in PBS at 4°C until processed further for immunocytochemistry. Cells were stained for p53 using mAb 1801 or 421 (Oncogene Science) 1:500 in PBS and the biotin-streptavidin-peroxidase MultiLink kit (BioGenex, San Ramon, CA) with the DAB peroxidase substrate kit (Vector).
For senescence-associated β-galactosidase (SA–β-gal) staining, coverslips were harvested, washed in PBS, and fixed with 2% formaldehyde/0.2% glutaraldehyde in PBS for 5 min at room temperature. SA-β–gal (pH 6.0) was detected as reported (22). Coverslips were rinsed in PBS, counterstained with neutral fast red, rinsed with distilled H2O, and mounted onto microscope slides using mounting media (Dako).
Cell Cycle Analysis.
Subconfluent cultures were pulse labeled for 30 min with 10 μM BrdUrd (Sigma), harvested, fixed, and then double stained with fluorescein isothiocyonate-conjugated anti-BrdUrd antibody (Becton Dickinson) and 5 μg/ml propidium iodide (Sigma). Cell cycle analysis was performed on a fluorescence-activated cell sorter (FACScan, Becton Dickinson). Data were analyzed using lysis II software (Becton Dickinson).
Electron Microscopy.
Cells were pelleted and then fixed with 3% glutaraldehyde/PBS (pH 7.4). After a wash with 0.2 sodium cacodylate buffer (pH 7.4), the pellet was treated with 1% osmium tetroxide in cacodylate buffer for 1 h. The cells were then dehydrated in graded steps of ethanol through propylene oxide and embedded in Embed 812 (Electron Microscope Sciences, Fort Washington, PA). One micrometer sections were cut and stained with methylene blue and azure II, observed by light microscopy, and representative areas chosen for ultrathin sectioning. Ultrathin sections were cut and then stained with uranyl acetate and lead citrate. Sections were observed with a JEM 100 CX transmission electron microscope.
RESULTS
Inducible Expression of wt p53 in Human Tumor Cells.
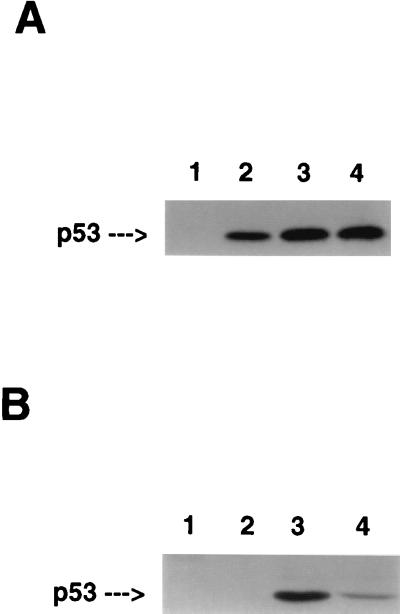
To establish a system to study the biological effects induced by wt p53, we utilized the tet-regulated inducible expression system (17). The human bladder carcinoma cell line, EJ, contains both an oncogenically activated H-ras gene (23, 24) and nonfunctional p53 due to a mutation in exon 5 (25, 26). p53 was not detectable in EJ cells using sensitive immunohistochemical or immunoblot methods. Furthermore, when EJ cells were exposed to ionizing radiation, p53 remained nondetectable immunologically, and known p53-responsive gene products, including p21 (27) and mdm2 (28, 29), failed to be up-regulated (data not shown). EJ cells were transfected with an inducible p53 construct, and marker selected clones were isolated. Fig. 1A shows that as early as 12 h after tet removal from the culture media, p53 was readily detectable with peak levels observed by 48 h. These levels were comparable to those observed in wt p53-containing cells in response to DNA damage (M.M.S., D.Y.S., and S.A.A., unpublished observations). p53 expression was also reversible with no p53 detected in EJ–p53 cells within 24 h after tet re-addition (Fig. 1B). Thus, EJ–p53 cells provided a model system with which to study the effects of inducible overexpression of wt p53 in tumor cells lacking function of this gene.
Figure 1.
Regulation of expression of wt p53 by tetracycline. (A and B) Immunoblot analysis of p53 in cell lysates. (A) p53 levels in EJ–p53 cells in the presence (lane 1) or absence of tet for 12 h (lane 2), 24 h (lane 3), or 48 h (lane 4). (B) p53 levels in EJ–p53 cells maintained in (+)tet (lane 1), or (−)tet for 4 days followed by the addition of tet for 24 h (lane 2) or (−)tet (lane 3). MCF7, a human breast carcinoma cell line (lane 4), was included as a positive control for wt p53 expression (30).
p53 Triggers Growth Arrest Associated with Senescent-Like Morphology.
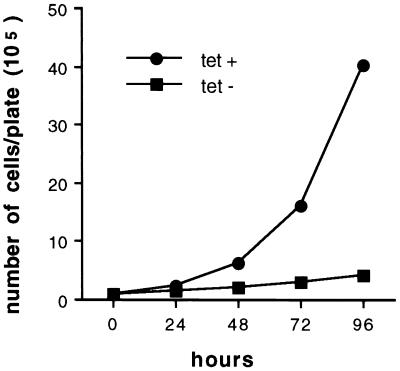
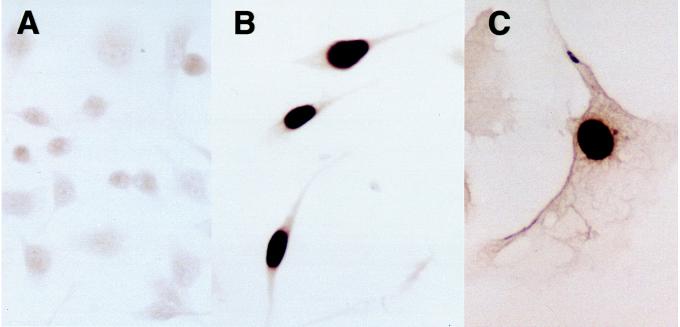
Fig. 2 shows the effects of induced wt p53 expression on EJ cell proliferation. Whereas EJ–p53 cells maintained in the presence of tet grew with a doubling time of ≈16 h, proliferation of EJ–p53 cells overexpressing wt p53 (−tet) was almost completely inhibited (Fig. 2). Of note, p53 induction caused dramatic alterations in cell morphology as well. Whereas the uninduced cells were small and did not detectably immunostain for p53 (Fig. 3A), tet removal led to obvious p53 nuclear staining by 24 h with the cells exhibiting increased size and a flattened morphology with elongated cellular processes, as well as enlarged nuclei (Fig. 3B). This phenotype persisted (Fig. 3C) and was not reversible upon tet re-addition after 2–3 days (data not shown). This was despite the fact that immunostaining of EJ–p53 cells that failed to resume normal growth after re-addition of tet showed a return to undetectable p53 levels (data not shown). Thus, the morphologically altered phenotype, characterized by irreversible growth inhibition resulting from p53 induction, appeared not to be dependent upon long-term persistent wt p53 expression. As a negative control, EJ cells transfected with a vector containing the tet-inducible CAT gene did not show any morphological changes upon CAT induction (data not shown).
Figure 2.
Growth curves of EJ–p53 cells grown in media (+)tet (•) vs. (−)tet (▪). Subconfluent, log-phase cells were initially seeded at 1 × 10⁵ cells/100-mm plate. After cells were allowed to attach (≈8 h), they were either maintained in media (+)tet or switched to media (−)tet (time = 0 h). Cell numbers were determined using a hemocytometer at the times indicated. All time points were performed in duplicate.
Figure 3.
Overexpression of wt p53 induces morphological changes in EJ–p53 cells. (A–C) Immunocytochemical staining of EJ–p53 cells. (A) EJ–p53, (+)tet, (B) EJ–p53, (−)tet, 24 h, (C) EJ–p53, (−)tet, 4 days (×625). Cells were photographed using a Nikon Microphot-FXA microscope.
The morphologic effects of p53 induction were not consistent with programmed cell death. This response is generally characterized by reduced cell size, condensed and segmented nuclei and cytoplasm, often with extensive fragmentation of chromosomal DNA into nucleosomal units (31–33). Moreover, we directly tested for apoptotic effects on DNA by performing a TUNEL (terminal deoxynucleotidyltransferase-mediated UTP end labeling) assay, which was negative (data not shown). Instead, these morphologic changes (Fig. 3 B and C), which were observed with several independent stable EJ–p53 clones, appeared to be similar to those reported in senescent human diploid fibroblasts (34).
p53-Induced Growth Inhibition Is Irreversible in EJ–p53 Cells.
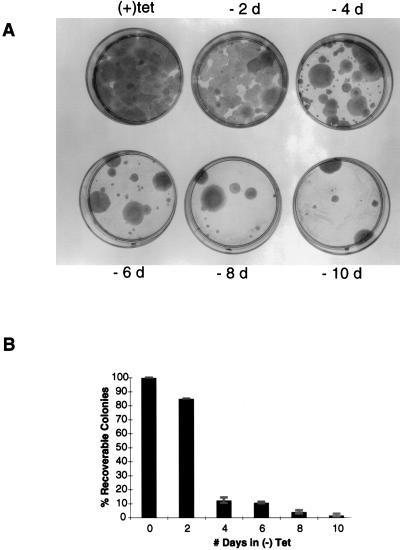
To investigate the time required for p53 expression to induce irreversible growth inhibition, we compared colony formation by EJ–p53 cells inoculated at ≈100 cells/60-mm plate and maintained in the absence of tetracycline for varying time periods. As shown in Fig. 4, p53 induction by tet withdrawal resulted in an inhibition of colony formation. This inhibition could be reversed by tet re-addition within 2 days. However, maintenance of the cells in the absence of tet for 4 or more days was associated with a marked reduction in colony formation (Fig. 4). The few colonies that grew under these conditions likely reflected a small fraction of the EJ–p53 population in which p53 was either not induced or induced at only a low level such that neither morphological alterations nor growth arrest occurred. In fact, those colonies that survived and grew under conditions of chronic tetracycline withdrawal did not express detectable levels of p53 (data not shown).
Figure 4.
Irreversible growth inhibition of EJ–p53 cells induced by expression of wt p53. (A) EJ–p53 cells were seeded at a density of 100 cells/60-mm plate maintained either in (+)tet or (−)tet for the indicated days (d) before adding back tetracycline. All (−)tet plates were subsequently maintained in (+)tet plates for 2 weeks followed by fixation with 10% formalin and staining with Giemsa. (A) Representative plates from one of four independent experiments. (B) The percent recoverable colonies for each condition normalized to the number in (+)tet. The results represent mean values of four plates, with the SD indicated by error bars. The average plating efficiency is 75%.
G1- and G2-Specific Cell Cycle Arrest.
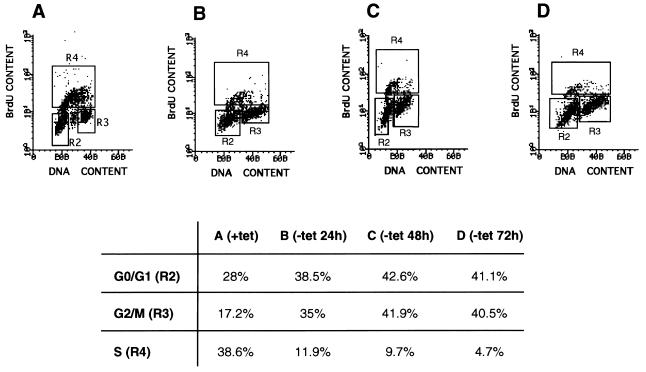
Increased expression of wt p53 has been reported to arrest cells near or at G1/S and/or G2/M (35), whereas senescent or presenescent fibroblasts are characteristically arrested in G1 (36). Therefore, it was of interest to examine EJ–p53 cells for changes in cell cycle progression associated with wt p53 induction. To accomplish this, the cells were analyzed by simultaneous flow cytometry for DNA content and DNA synthesis, with propidium iodide staining and BrdUrd labeling, respectively. As shown in Fig. 5, EJ–p53 cells exhibited greatly reduced BrdUrd incorporation within 24 h after the removal of tet (Fig. 5B) with the fraction in S phase declining to ≈5% by 2–3 days (Fig. 5 C and D). Of note, this cell cycle arrest was associated with accumulation of cells at both G1/S and G2/M checkpoints (Fig. 5 B–D) and was irreversible after 2–3 days (Fig. 5D). In contrast, EJ–p53 cells maintained in medium containing tet (Fig. 5A), or EJ–CAT cells in the presence or absence of the drug (data not shown), demonstrated no evidence of cell cycle arrest. Moreover, serum starvation led to G1 arrest, which was reversible upon refeeding of the culture. Thus, induced p53 irreversibly arrested EJ–p53 cells at both G0/G1 and G2/M checkpoints.
Figure 5.
Cell cycle analysis of EJ–p53 cells following p53 induction. Cell cycle analysis was performed on a fluorescence-activated cell sorter (FACScan, Becton Dickinson). Data were analyzed using Lysis II software (Becton Dickinson). BrdUrd (BrdU) uptake, as measured by fluorescein isothiocyanate fluorescence, is depicted on the y axis. DNA content, as measured by propidium iodide fluorescence, is depicted on the x axis. Populations of cells in different phases of the cell cycle are gated: G0/G1 population (R2), G2/M population (R3), and S-phase population (R4). The percentage of cells in each gate are indicated for each sample in the table. (A) EJ–p53, (+)tet, (B) EJ–p53, (−)tet, 24 h. (C) EJ–p53, (−)tet, 48 h. (D) EJ–p53, (−)tet, 72 h.
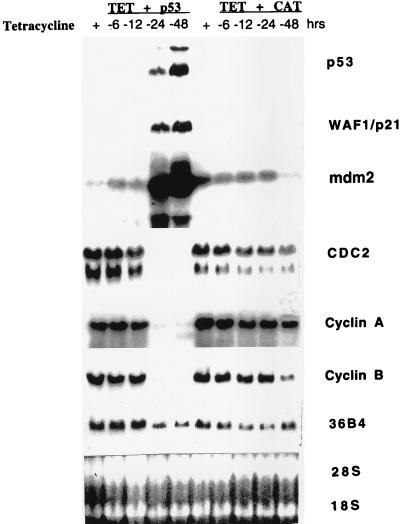
We next investigated the effects of p53-induced cell cycle arrest on the expression of cell cycle regulatory genes. As shown in Fig. 6, removal of tet from the growth medium of EJ-p53 cells led to marked increases in p53 mRNA levels as well as p21 and mdm2, confirming that these known p53 effector pathways were intact in EJ tumor cells. The fact that p53 transcript induction in these experiments occurred with slower kinetics than was observed for induction of the p53 protein (Fig. 1) likely reflects variations in culture conditions. The transcript of another cell cycle inhibitor, p16, was undetectable and was not induced in response to p53 induction (data not shown). In contrast, the expression of mitotic cyclins (Cyc A and B) and cdc2 decreased dramatically. These results are consistent with previous studies demonstrating that senescent cells contain little or no detectable cdc2, cyclin A, or cyclin B mRNA (37). How each of these alterations in cell cycle regulatory gene expression participates in inducing the senescence program in EJ cells remains to be elucidated.
Figure 6.
Expression of cell cycle-regulated genes in EJ–p53 cells following p53 induction. Total RNA was prepared as described from EJ–p53 and EJ–cat cells maintained in (+)tet or (−)tet condition for varying time periods (−6, −12, −24, and −48 h). The same Northern blot was hybridized successively with 32P-labeled probes for p53, p21, mdm2, cdc2, cyclin A, cyclin B, and 36B4 (loading control). To confirm the amount of RNAs loaded in each lane, RNAs were stained with ethidium bromide to visualize 28S and 18S bands.
Expression of Senescent-Specific Markers Following p53 Induction.
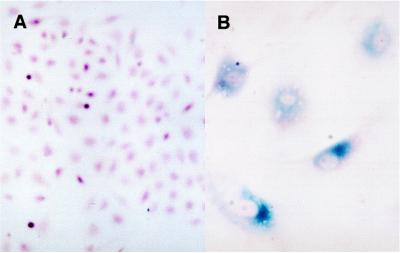
Senescent but not presenescent, quiescent, or terminally differentiated cells have been shown to express a SA–β-gal that can be detected in single cells by incubating cells with 5-bromo-4-chloro-3-indolyl β-D-galactoside (X-Gal), which forms a blue precipitate upon cleavage (22). Thus, we analyzed induced EJ–p53 cells for expression of this senescence-specific marker. Greater than 95% of such cells showed positive staining for SA-β-gal, which colocalized to cells possessing the senescent morphology (Fig. 7B). In contrast, SA-β-gal staining was not detected in EJ–p53 cells grown in the presence of tetracycline (Fig. 7A), in control EJ–CAT cells grown in medium with or without tet (data not shown), or in serum starved, reversibly growth-inhibited EJ cells (data not shown). All of the above findings indicated that p53 induction initiated the senescence program in EJ tumor cells.
Figure 7.
SA–β-gal staining of EJ–p53 cells following induction of wt p53. EJ–p53 cells were seeded onto coverslips and maintained in medium (+)tet or (−)tet for 5 days before SA–β-gal staining. (A) EJ–p53, (+)tet, (B) EJ–p53, (−)tet, (×312.5). Cells were photographed using a Nikon Microphot-FXA microscope.
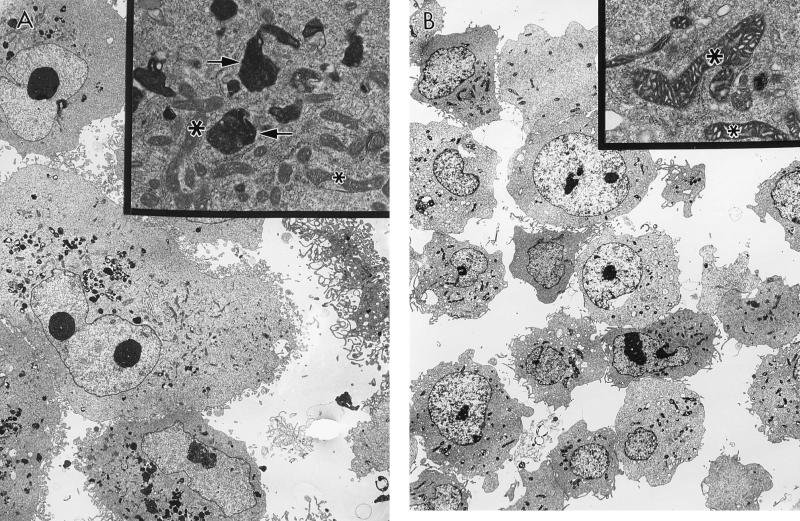
During fluorescence-activated cell sorter analysis, we noted a dramatic change in the light scatter pattern of EJ–p53 cells upon induction of p53 expression. Namely, such cells were characterized by an increase in side scatter (data not shown), a physical measurement of the complexity of a cell—e.g., granularity (38). Using transmission electron microscopy, we found that the p53-overexpressing EJ cells contained many electron-dense cytoplasmic inclusions (Fig. 8A). The contents of these vesicles consisted of lamellar material that resembled lipofuscin, a lipid substance with autofluorescence properties that has been shown to accumulate with aging in the lysosomes of all vertebrates examined to date (39). These ultrastructural changes were detectable within 24 h after tet removal from the medium and temporally correlated with the induction of steady-state levels of p53. In contrast, neither the increase in side scatter nor the appearance of lipofuscin granules was seen in EJ–p53 cells, (+)tet (Fig. 8B), or control EJ cells (data not shown). p53-overexpressing EJ cells also exhibited altered mitochondria, which appeared reproducibly less electron-dense (Fig. 8A) than their counterparts in uninduced cells (Fig. 8B). The significance of this latter alteration is not known. Of note, there were no ultrastructural changes consistent with apoptosis in the induced EJ–p53 cells.
Figure 8.
Ultrastructural changes associated with aging in EJ–p53 cells overexpressing p53. (A and B) Electron micrographs of EJ–p53 cells analyzed using transmission electron microscopy. (A) EJ–p53 cells, (−)tet, 5 days. (B) EJ–p53 cells, (+)tet, 5 days. Lipofuscin vesicles are indicated by arrows. Mitochondria are indicated by asterisks. (×1,820; Insets: ×13,000.)
DISCUSSION
The present studies demonstrate that in tumor cells lacking functional p53, but in which p53 effector pathways remain intact, the induced overexpression of wt p53 triggered a short-term cellular response leading to irreversible growth arrest and senescence. Our evidence included induction of a flattened, enlarged cell morphology, commonly observed with senescent fibroblasts (34); accumulation of lipofuscin granules, an ultrastructural change associated with aging (39); as well as SA–β-gal staining (pH 6.0), a specific biochemical marker of senescent cells (22). The commitment to senescence became irreversible within 48–72 h and no longer required p53 expression. In addition, there were no findings consistent with apoptosis in response to overexpression of p53 in any of the assays used, including the TUNEL assay.
Earlier efforts to study the effects of stably overexpressed wt p53 have relied almost exclusively on the use of a temperature sensitive (ts) mutant system in which p53 exhibits wt function at the permissive temperature but behaves as a mutant at the restrictive temperature due to a conformation change (40, 41). It has been shown that expression of the ts mutant, p53val135, in embryo fibroblasts resulted in a reversible growth arrest in which cells maintained at the permissive temperature (32.5°C) were able to recover from growth arrest when switched to the restrictive temperature (39.5°C) (40, 41). These findings are in striking contrast to our present studies with tumor cells, arguing that the cellular context in which p53 is overexpressed must be a major determinant of the response observed.
In different tumor cells lacking functional p53, the re-introduction of wt p53 has also been reported to result in either programmed cell death or to a growth arrest response that was not otherwise characterized (35, 42, 43). Some colorectal tumor lines overexpressing p53 manifested growth arrest without apoptosis, whereas others underwent apoptosis in response to p53 expression (42). The growth arrest response appeared to require functional p21, a p53-response gene (42). The growth arrest response appeared to require functional p21, a p53-response gene (42). Chen et al. (43) reported that the level of induced wt p53 protein can also help to determine the cellular response. Thus, high levels of wild-type p53 were associated with apoptosis, whereas lower levels of p53 expression in these same cell lines were associated with growth arrest (both G1 and G2) (43). Together, these recent data strongly suggest the existence of complex mechanisms regulating p53-mediated cellular outcomes of growth arrest or apoptosis. Moreover, if the growth arrest in tumor cells observed by other investigators in response to p53 were to reflect activation of the senescence program, then this response may reflect a general mechanism of tumor suppression mediated by p53.
Following completion of this study, Serrano et al. (44) reported that expression of oncogenic ras triggered premature senescence in primary human or rodent fibroblasts, associated with increases in p53, p21, and p16 levels. They further showed that inactivation of p53 or p16 blocked this response and was associated with continued cell proliferation (44). Of note, EJ tumor cells, which lack functional wt p53, are also known to contain an oncogenic ras mutation (23, 24). Thus, our present findings are consistent with the concept that loss of wt p53 function in concert with ras activation may have been critical events to avoiding senescence in the course of EJ tumor evolution. However, we also have evidence that senescence can be induced in other p53 null tumor cells irrespective of the presence of a ras oncogene in such cells (M.M.S. and S.A.A., unpublished results).
p53 induction in EJ–p53 cells led to the rapid onset of a synchronized series of molecular, cellular, biochemical, and ultrastructural changes that have been characterized previously in senescing human fibroblasts (1). In contrast to programmed cell death, the immediate biologic outcome of senescence is irreversible growth arrest. Both programs, however, lead to a common consequence—i.e., loss of further proliferative capacity. The altered state of a tumor cell, which is achieved through progressive genetic adaptations that arise during tumor evolution, may make such tumor cells particularly vulnerable to activation of growth arrest/cell death programs including senescence through the unbalancing effects of reactivation of wt tumor suppressor gene function. The availability of an inducible system in which p53 triggers the rapid, synchronous onset of the senescence program should facilitate the investigation of the biochemical signaling pathways involved in activating this short term cellular response.
Acknowledgments
We thank H. Bujard for tet plasmids; J. Pine and T. Hunter for cDNAs to cyclins A and B; A. Arnold for cDNA to cyclin D1; D. Givol for cDNA to p21; J. Campisi for the SA–β-gal detection protocol; J. Manfredi for antibodies to p53, mdm2, and p21; C. Lackner of the Mount Sinai Flow Cytometry Core Facility for technical assistance with fluorescence-activated cell sorter analysis; R. Gordon for electron microscopy; and special thanks to Y. Hu for expert technical help and B. Dayton for help with computer graphics. This work was initiated by D.Y.S. and S.A.A. while at the Laboratory of Cellular and Molecular Biology, National Cancer Institute, National Institutes of Health. This work was supported in part by National Institutes of Health Grants CA66271-01 and AG08812 (to S.W.L.), and CA66654 and the T. J. Martell Foundation for Leukemia Cancer, and AIDS Research (to S.A.A.). M.M.S. was supported by the Steven Ravitch Fellowship in Pediatric Hematology/Oncology, the Charles H. Revson Postdoctoral Fellowship in the Biomedical Sciences, an American Society of Clinical Oncology Young Investigator Award, and The Child Health Research Center at Mount Sinai (National Institutes of Health Grant P30HD28822).
Footnotes
This paper was submitted directly (Track II) to the Proceedings Office.
Abbreviations: tet, tetracycline; wt, wild type; CAT, chloramphenicol acetyltransferase; SA–β-gal, senescence-associated β-galactosidase.
References
- 1.Smith J R, Pereira-Smith O M. Science. 1996;273:63–67. doi: 10.1126/science.273.5271.63. [DOI] [PubMed] [Google Scholar]
- 2.Ning Y, Weber J L, Killary A M, Ledbetter D H, Smith J R, Pereira-Smith O M. Proc Natl Acad Sci USA. 1991;88:5635–5639. doi: 10.1073/pnas.88.13.5635. [DOI] [PMC free article] [PubMed] [Google Scholar]
- 3.Ogata T, Ayusawa D, Namba M, Takahashi E, Oshimura M, Oishi M. Mol Cell Biol. 1993;13:6036–6043. doi: 10.1128/mcb.13.10.6036. [DOI] [PMC free article] [PubMed] [Google Scholar]
- 4.Hensler P J, Annab L A, Barrett J C, Pereira-Smith O M. Mol Cell Biol. 1994;14:2291–2297. doi: 10.1128/mcb.14.4.2291. [DOI] [PMC free article] [PubMed] [Google Scholar]
- 5.Levine A J. Cell. 1997;88:323–331. doi: 10.1016/s0092-8674(00)81871-1. [DOI] [PubMed] [Google Scholar]
- 6.Lane D P. Nature (London) 1992;358:15–16. doi: 10.1038/358015a0. [DOI] [PubMed] [Google Scholar]
- 7.Hollstein M, Sidransky D, Vogelstein B, Harris C C. Science. 1991;253:49–53. doi: 10.1126/science.1905840. [DOI] [PubMed] [Google Scholar]
- 8.McBride O W, Merry D, Givol D. Proc Natl Acad Sci USA. 1986;83:130–134. doi: 10.1073/pnas.83.1.130. [DOI] [PMC free article] [PubMed] [Google Scholar]
- 9.Isobe M, Emanuel B S, Givol D, Oren M, Croce C M. Nature (London) 1986;320:84–85. doi: 10.1038/320084a0. [DOI] [PubMed] [Google Scholar]
- 10.Bond J A, Wyllie F S, Wynford-Thomas D. Oncogene. 1994;9:1885–1889. [PubMed] [Google Scholar]
- 11.Harvey M, Sands A T, Weiss R S, Hegi M E, Wiseman R W, Pantazis P, Giovanella B C, Tainsky, Bradley A, Donehower L A. Oncogene. 1993;8:2457–2467. [PubMed] [Google Scholar]
- 12.Tsukada T, Tomooka Y, Takai S, Ueda Y, Nishikawa S, Yagi T, Tokunaga T, Takeda N, Suda Y, Abe S, Matsuo I, Ikawa Y, Aizawa S. Oncogene. 1993;8:3313–3322. [PubMed] [Google Scholar]
- 13.Kulju K S, Lehman J M. Exp Cell Res. 1995;217:336–345. doi: 10.1006/excr.1995.1095. [DOI] [PubMed] [Google Scholar]
- 14.Bond J, Haughton M, Blaydes J, Gire V, Wynford-Thomas D, Wyllie F. Oncogene. 1996;13:2097–2104. [PubMed] [Google Scholar]
- 15.Atadja P, Wong H, Garkavtsev, Veillette C, Riabowol K. Proc Natl Acad Sci USA. 1995;92:8348–8352. doi: 10.1073/pnas.92.18.8348. [DOI] [PMC free article] [PubMed] [Google Scholar]
- 16.Noda A, Ning Y, Venable S F, Pereira-Smith O M, Smith J R. Exp Cell Res. 1994;211:90–98. doi: 10.1006/excr.1994.1063. [DOI] [PubMed] [Google Scholar]
- 17.Gossen M, Bujard H. Proc Natl Acad Sci USA. 1992;89:5547–5551. doi: 10.1073/pnas.89.12.5547. [DOI] [PMC free article] [PubMed] [Google Scholar]
- 18.Sambrook J, Fritsch E F, Maniatis T. Molecular Cloning: A Laboratory Manual. 2nd Ed. Plainview, NY: Cold Spring Harbor Lab. Press; 1989. [Google Scholar]
- 19.Gorman C M, Moffat L, Howard B. Mol Cell Biol. 1982;2:1044–1051. doi: 10.1128/mcb.2.9.1044. [DOI] [PMC free article] [PubMed] [Google Scholar]
- 20.Neumann J M, Morency C A, Russian K O. BioTechniques. 1987;5:444–447. [Google Scholar]
- 21.Lee S W. Nat Med. 1996;2:776–782. doi: 10.1038/nm0796-776. [DOI] [PubMed] [Google Scholar]
- 22.Dimri G P, Lee X, Basile G, Acosta M, Scott G, Roskelley C, Medrano E E, Linskens M, Rubelj I, Pereira-Smith O, Peacocke M, Campisi J. Proc Natl Acad Sci USA. 1995;92:9363–9367. doi: 10.1073/pnas.92.20.9363. [DOI] [PMC free article] [PubMed] [Google Scholar]
- 23.Tabin C J, Bradley S M, Bargmann C I, Weinberg R A, Papageorge A G, Scolnick E M, Dhar R, Lowy D R, Chang E H. Nature (London) 1982;300:143–149. doi: 10.1038/300143a0. [DOI] [PubMed] [Google Scholar]
- 24.Reddy E P, Reynolds R K, Santos E, Barbacid M. Nature (London) 1982;300:149–152. doi: 10.1038/300149a0. [DOI] [PubMed] [Google Scholar]
- 25.Sharma S, Schwarte-Waldhoff I, Oberhuber H, Schafer R. Cell Growth Differ. 1993;4:861–869. [PubMed] [Google Scholar]
- 26.Rieger K M, Little A F, Swart J M, Kastrinakis W V, Fitzgerald J M, Hess D T, Libertino J A, Summerhayes I C. Br J Cancer. 1995;72:683–690. doi: 10.1038/bjc.1995.394. [DOI] [PMC free article] [PubMed] [Google Scholar]
- 27.el-Deiry W S, Tokino T, Velculescu V E, Levy D B, Parsons R, Trent J M, Lin D, Mercer W E, Kinzler K W, Vogelstein B. Cell. 1993;75:817–825. doi: 10.1016/0092-8674(93)90500-p. [DOI] [PubMed] [Google Scholar]
- 28.Wu X, Bayle H, Olson D, Levine A J. Genes Dev. 1993;7:1126–1132. doi: 10.1101/gad.7.7a.1126. [DOI] [PubMed] [Google Scholar]
- 29.Barak Y, Juven T, Haffner R, Oren M. EMBO J. 1993;12:461–468. doi: 10.1002/j.1460-2075.1993.tb05678.x. [DOI] [PMC free article] [PubMed] [Google Scholar]
- 30.Runnebaum I B, Nagarajan M, Bowman M, Soto D, Sukumar S. Proc Natl Acad, Sci USA. 1991;88:10657–10661. doi: 10.1073/pnas.88.23.10657. [DOI] [PMC free article] [PubMed] [Google Scholar]
- 31.Steller H. Science. 1995;267:1445–1449. doi: 10.1126/science.7878463. [DOI] [PubMed] [Google Scholar]
- 32.Thompson C B. Science. 1995;267:1456–1462. doi: 10.1126/science.7878464. [DOI] [PubMed] [Google Scholar]
- 33.Linskens M H, Harley C B, West M D, Campisi J, Hayflick L. Science. 1995;267:17. doi: 10.1126/science.7848496. [DOI] [PubMed] [Google Scholar]
- 34.Hayflick L, Moorehead P S. Exp Cell Res. 1961;25:585–621. doi: 10.1016/0014-4827(61)90192-6. [DOI] [PubMed] [Google Scholar]
- 35.Liebermann D A, Hoffman, Steinman R A. Oncogene. 1995;11:199–210. [PubMed] [Google Scholar]
- 36.Yanishevsky R, Mendelsohn M L, Mayall B H, Cristofalo V J. J Cell Physio. 1974;84:165–170. doi: 10.1002/jcp.1040840202. [DOI] [PubMed] [Google Scholar]
- 37.Stein G H, Drullinger L F, Robetorye R S, Pereira-Smith O M, Smith J R. Proc Natl Acad Sci USA. 1991;88:11012–11016. doi: 10.1073/pnas.88.24.11012. [DOI] [PMC free article] [PubMed] [Google Scholar]
- 38.Shapiro H M. Practical Flow Cytometry. 3rd Ed. New York: Wiley–Liss; 1995. pp. 234–235. [Google Scholar]
- 39.Ghadially F N. Ultrastructural Pathology of the Cell. Reading, MA: Butterworths; 1975. pp. 306–309. [Google Scholar]
- 40.Michalovitz D, Halevy O, Oren M. Cell. 1990;62:671–680. doi: 10.1016/0092-8674(90)90113-s. [DOI] [PubMed] [Google Scholar]
- 41.Martinez J, Georgoff I, Martinez J, Levine A J. Genes Dev. 1991;5:151–159. doi: 10.1101/gad.5.2.151. [DOI] [PubMed] [Google Scholar]
- 42.Polyak K, Waldman T, He T-C, Kinzler K W, Vogelstein B. Genes Dev. 1996;10:1945–1952. doi: 10.1101/gad.10.15.1945. [DOI] [PubMed] [Google Scholar]
- 43.Chen X, Ko L J, Jayaraman L, Prives C. Genes Dev. 1996;10:2438–2451. doi: 10.1101/gad.10.19.2438. [DOI] [PubMed] [Google Scholar]
- 44.Serrano M, Lin A W, McCurrach M E, Beach D, Lowe S W. Cell. 1997;88:593–602. doi: 10.1016/s0092-8674(00)81902-9. [DOI] [PubMed] [Google Scholar]


