Abstract
Graft-versus-host disease (GVHD) is the major complication occurring after bone marrow transplantation. The severity of GVHD varies widely, with this variation generally being attributed to variation in the degree of disparity between host and donor for minor histocompatibility antigens. However, it is also possible that other forms of polymorphism, such as polymorphisms in immune effector molecules, might play a significant role in determining GVHD severity. In order to investigate this hypothesis, we are studying the genetic factors that influence GVHD development in a murine model. We here report the first results of this analysis, which demonstrate that a locus on Chromosome 1 of the mouse, and possibly also a locus on Chromosome 4, exert considerable influence over the development of one aspect of acute GVHD – splenomegaly – in a parent→F1 murine model. These results demonstrate that non-MHC genes can exert quite significant effects on the development of GVHD-associated pathology and that gene mapping can be used as a tool to identify these loci. Further analysis of such loci will allow identification of the mechanism whereby they influence GVHD and may lead in the future to improved selection of donors for human bone marrow transplantation.
INTRODUCTION
Graft-versus-host disease (GVHD) is a complex process that is initiated upon recognition of foreign host histocompatibility antigens by engrafted donor T cells. It has generally been accepted that the severity of GVHD is dependent on the extent of disparity between host and donor for major and/or minor histocompatibility antigens. While there can be little doubt that a relationship does exist between the severity of GVHD and the degree of antigen disparity between host and donor, other factors may also influence the severity and associated pathology of this syndrome.
Recently, polymorphisms have been identified in a significant number of immunological effector molecules. Examples include a polymorphism in the interleukin-10 (IL-10) gene promoter,1 polymorphism in the IL-4 gene promoter,2 polymorphisms influencing IL-1 activity,3,4 polymorphism in the IL-2 gene5 and polymorphisms in tumour necrosis factor-α (TNF-α) and TNF-β.6 A growing number of studies are reporting links between such immune polymorphisms and the severity of immunological disease.6–8 It is possible that similar polymorphisms may also influence the course of GVHD.
At least one murine model indicates that such modifying factors may indeed exist. When (C57BL/10×DBA/2)F1 (B10D2F1) mice (H-2b/d) receive spleen cells from B10.D2 (H-2d) donors, an acute, fatal GVHD develops.9 Conversely, when B10D2F1 mice receive spleen cells from DBA/2 (H-2d) donors, a protracted, chronic GVHD with features of the autoimmune syndrome systemic lupus erythematosus (SLE) develops.9–11 In these two combinations (i.e. B10.D2→B10D2F1 and DBA/2→B10D2F1), the major histocompatibility complex (MHC) haplotype of the donor is identical and the MHC disparities being recognized in the host are identical. Therefore, the different course of GVHD must be determined by non-MHC factors.
Analysis of cytokine production during the early development of GVHD in B10D2F1 recipients of either B10.D2 or DBA/2 spleen cells has provided some evidence suggesting that the development of acute versus chronic GVHD in this model reflects the differential predominance of either T helper 1 (Th1) or T helper 2 (Th2) cells, respectively.12–15 If this is the case, then non-MHC genetic differences between the B10.D2 and DBA/2 donor strains must determine whether Th1 or Th2 cells will predominate in this GVH response and thereby influence the nature of GVHD-associated pathology.
In order to explore the hypothesis that polymorphism in immunological effector molecules, as well as antigen disparity, plays a major role in determining the outcome of GVHD, we are mapping the genetic differences between the B10.D2 and DBA/2 strains that influence the outcome of GVHD in the B10D2F1 model. Previous studies investigating genetic influences on GVHD outcome in this model have suggested that a single gene might influence the development of acute versus chronic GVHD.10,11 The results described in this paper extend these earlier studies by suggesting the existence and location of loci that exert a significant influence on development of GVHD-associated splenomegaly in B10D2F1 mice.
MATERIALS AND METHODS
Mice
All mice were purchased from The Jackson Laboratory (Bar Harbor, ME) except the F1 and backcross mice, which were bred in the animal facility of the Department of Biology, IUPUI. Donor and recipient mice were 5–8 weeks of age.
(B10.D2×DBA/2J)F1 hybrid mice (H-2d/d) were backcrossed to either the B10.D2 (H-2d) parental strain or to the DBA/2J (H-2d) parental strain. The backcross mice so generated will hereafter be referred to as B10BX and D2BX mice, respectively.
Induction of GVHD
Spleen cells were isolated from appropriate donor mice and resuspended in saline to a concentration of 2×10⁸–2·4×108 leucocytes/ml. All recipient mice were (C57BL/10×DBA/ 2J)F1 hybrids (H-2b/d), hereafter referred to as B10D2F1 mice. Recipient mice were given 0·25 ml of this cell suspension intraperitoneally. For assessment of GVHD-associated splenomegaly, recipient mice were killed 14 days after cell transfer.
PCR-based linkage analysis
Mapping of the locus influencing GVHD-associated splenomegaly was performed by analysis of simple sequence length polymorphisms, as described by Dietrich et al.16 The length of simple sequence repeats varies considerably between inbred strains of mice and analysis of simple sequence repeat length provides a reliable means of genotyping backcross mice in mapping studies.
DNA was isolated from backcross mice according to the method of Hogan et al.17 One microlitre of DNA was added to 0·1 mm dNTP and 0·25 μm each of the 3′ and 5′ primers specific for the simple sequence repeat of interest in a total volume of 19·5 μl buffer (10 mm Tris-HCl; 50 mm KCl; 1·5 mm MgCl2; pH 8·3). Primers were obtained from Research Genetics (Huntsville, AL). Sequences of all primers used are available from the Mouse Genome Database (MGD) maintained by The Jackson Laboratory (URL: http://www.informatics. jax.org/). The mixture was then covered with 50 μl of mineral oil, incubated at 95° for 1 min and then held at the annealing temperature while 0·5 units of Taq DNA polymerase (1 U/μl) (Sigma, MO) was added. This mixture was then cycled through 95° for 1 min, the annealing temperature for 2 min and 72° for 3 min (extended by 1 second/cycle; a 10-minute extension time was used in the last cycle) for 40 cycles in a Perkin-Elmer (Norwalk, CT) 480 thermal cycler.
Polymerase chain reaction (PCR) products were electrophoresed through a 3–4% (as appropriate) Metaphor agarose (FMC Bioproducts, ME) gel in either tris-acetate-EDTA (TAE) or tris-borate-EDTA (TBE) electrode buffer. Gels were stained in ethidium bromide solution (0·5 μg/ml) for 30 min and assessed under UV light.
Statistical analysis
Comparisons of spleen weights among groups that were genetically homogeneous were performed using the Student’s t-test (Fig. 1). Comparisons between genetically heterogeneous groups were performed using the non-parametric Mann–Whitney U-test method as the results in these groups did not generally show a normal distribution (Figs 2,3 and 5).
Figure 1.
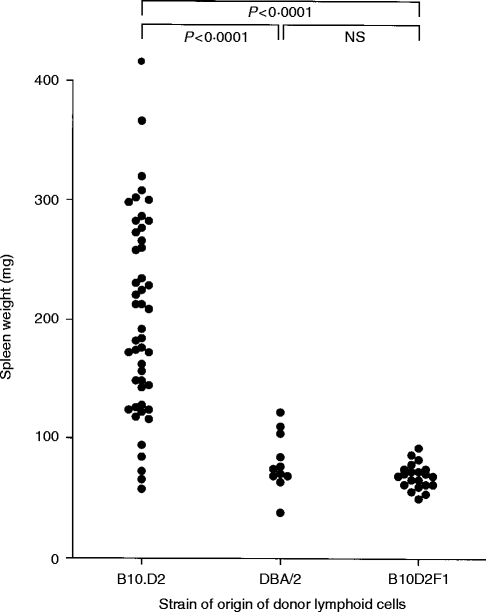
Spleen weight of B10D2F1 recipients 14 days after transfer of 5–6×10⁷ lymphoid cells from B10.D2, DBA/2 or B10D2F1 donors. Probability values were calculated by Student’s t-test comparison of the indicated groups.
Figure 2.
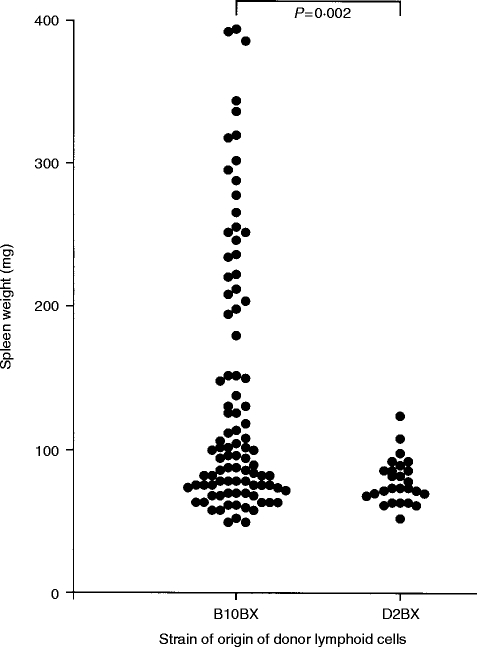
Spleen weight of B10D2F1 recipients 14 days after transfer of 5–6×10⁷ lymphoid cells from (B10.D2×DBA/2)×B10.D2 (B10BX) donors or (B10.D2×DBA/2)×DBA/2 (D2BX) donors. Probability values were calculated by Mann–Whitney U-test comparison of the indicated groups.
Figure 3.
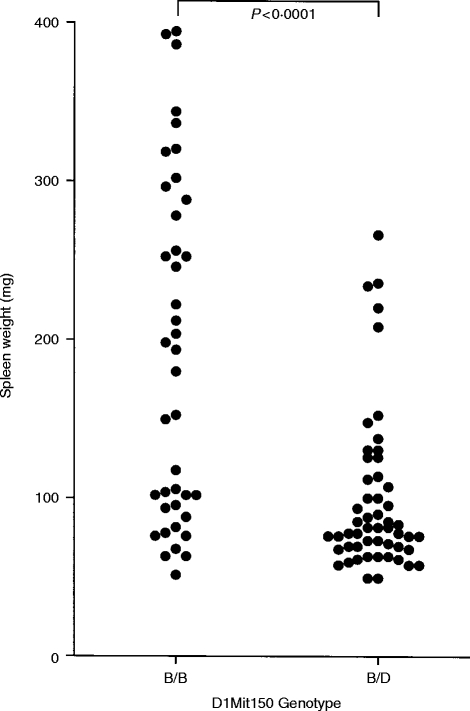
Spleen weight of B10D2F1 recipients 14 days after transfer of 5–6×10⁷ lymphoid cells from (B10.D2×DBA/2)×B10.D2 backcross mice either homozygous (B/B) or heterozygous (B/D) at the D1Mit150 linkage marker. Probability values were calculated by Mann–Whitney comparison of the indicated groups.
Figure 5.
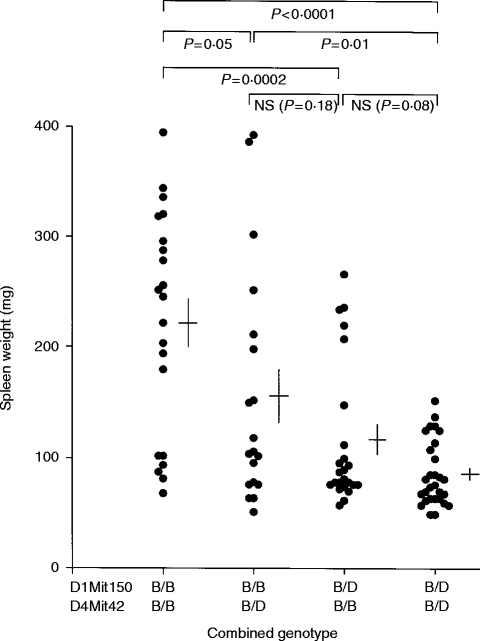
Spleen weight of B10D2F1 recipients 14 days after transfer of 5–6×10⁷ lymphoid cells from (B10.D2×DBA/2)×B10.D2 backcross mice either homozygous or heterozygous at the D1Mit150 and D4Mit42 linkage markers. Cross markings indicate the mean spleen weight ±1 SE. Probability values were calculated by Mann–Whitney comparison of the indicated groups.
Comparisons of the proportions of positive and negative mice in groups of mice homozygous versus heterozygous at specific linkage markers was performed using χ2 analysis Tables 1,2,3).
Table 1.
Genetic analysis of 26 (B10.D2×DBA/2)×B10.D2 backcross mice capable of inducing GVHD-associated splenomegaly in B10D2F1 recipients
*Chromosomal location of the marker.
†Distance in centimorgans of the marker from the centromere, as given in the Mouse Genome Database.23
‡No. of mice homozygous for the B10.D2-derived allele.
§No. of mice heterozygous at the linkage marker.
¶x2 value obtained when results were tested against the null hypothesis that homozygotes and heterozygotes were present in a 1 : 1 ratio.
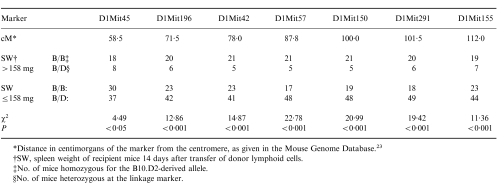
Table 2.
Linkage data obtained with Chromosome 1 markers
*Distance in centimorgans of the marker from the centromere, as given in the Mouse Genome Database.23
†SW, spleen weight of recipient mice 14 days after transfer of donor lymphoid cells.
‡No. of mice homozygous for the B10.D2-derived allele.
§No. of mice heterozygous at the linkage marker.
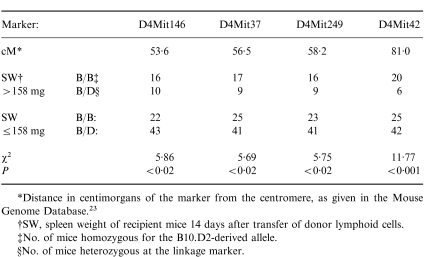
Table 3.
Linkage data obtained with Chromosome 4 markers
*Distance in centimorgans of the marker from the centromere, as given in the Mouse Genome Database.23
†SW, spleen weight of recipient mice 14 days after transfer of donor lymphoid cells.
‡No. of mice homozygous for the B10.D2-derived allele.
§No. of mice heterozygous at the linkage marker.
The significance of log of odds (LOD) scores was determined using the permutation test method of Churchill & Doerge,18 as implemented in the Map Manager QT linkage analysis software.19
RESULTS
Splenomegaly as a marker of acute GVHD in the B10D2F1 model
It has previously been observed that splenomegaly occurs during induction of acute GVHD in B10.D2→B10D2F1 chimeras but does not occur during development of chronic GVHD in DBA/2→B10D2F1 chimeras.20 We therefore investigated whether this could be used as a simple, discrete marker with which to map genes influencing the differential development of acute and chronic GVHD in this model.
As shown in Fig. 1, mean spleen weight of B10D2F1 mice that received 5–6×10⁷ B10.D2 spleen cells 14 days earlier was 203 mg (n = 48) whereas mean spleen weight in the DBA/2 donor group was 80 mg (n = 11) (P < 0·0001 by Student’s t-test). Although as a group the B10.D2 donors induced significantly greater splenomegaly, a wide variation was seen between individual mice. This is similar to the variation in GVHD severity routinely observed in many murine GVHD models21,22 and may be due to kinetic differences in the time of peak splenomegaly in different mice, or to random environmental or experimental variation.
Segregation of the splenomegaly inducing phenotype in (B10.D2×DBA/2)×B10.D2 backcross mice
As there was clearly a genetic component to the ability of donor cells to induce GVHD-associated splenomegaly, and as splenomegaly has long been considered a measure of the intensity of GVHD, the ability of lymphoid cells from (B10.D2×DBA/2)×B10.D2 backcross (i.e. B10BX) mice and (B10.D2×DBA/2)×DBA/2 backcross (i.e. D2BX) mice to induce GVHD-associated splenomegaly in B10D2F1 recipients was investigated. As shown in Fig. 2, spleen cells from D2BX mice did not induce splenomegaly in recipients, whereas spleen cells from a significant number of the B10BX mice clearly induced GVHD-associated splenomegaly.
As none of the D2BX donors induced significant splenomegaly, it is clear that the B10 allele(s) at the locus (loci) involved must be recessive. Furthermore, as approximately one quarter of the B10BX mice induced significant splenomegaly, there are most likely no more than two genes involved.
Linkage analysis: a locus on Chromosome 1 influences GVHD
For the purposes of mapping the gene that influences the degree of splenomegaly occurring in the B10D2F1 model, B10BX mice inducing GVHD-associated splenomegaly greater than 158 mg in B10D2F1 recipients were considered as ‘positive’ for the phenotype. A cut-off of 158 mg was chosen because this represents the 99·9% confidence interval (3·3 standard deviations above the mean) of the negative range obtained with the D2BX mice and therefore ensures that the group studied would include no false positives. The 26 backcross mice that induced splenomegaly greater than 158 mg were assessed for 64 linkage markers spread throughout the genome. It would be expected that any marker linked to the locus that influences the degree of splenomegaly would be homozygous for the B10.D2-derived allele in a majority of the 26 positive mice. The results of this analysis are shown in Table 1. Linkage markers on Chromosome 1 (D1Mit196, D1Mit42, D1Mit57, D1Mit150 and D1Mit291) and Chromosome 4 (D4Mit42) were homozygous in a significant majority of the positive mice (i.e. gave a χ2 value greater than 6·6 (P < 0·01) when tested against a null hypothesis that homozygotes and heterozygotes were present in a 1:1 ratio). This indicated that loci influencing GVHD-associated splenomegaly are most likely located on Chromosome 1 and/or 4. Therefore, a more extensive analysis of these two chromosomes was undertaken.
All of the B10BX mice were then typed for linkage markers on Chromosome 1 – with the results shown in Table 2. These results indicate that there is a high probability (P < 0·001) that a gene on Chromosome 1 influences the degree of splenomegaly induced by donor spleen cells. This is further demonstrated in Fig. 3, in which splenomegaly induced by donors homozygous for the B10 allele at the linkage marker D1Mit150 is compared with splenomegaly induced by donors heterozygous at this locus. The mean spleen weight of recipients of lymphoid cells from homozygous donors was 191·1 mg whereas mean spleen weight of recipients of lymphoid cells from heterozygous donors was 99·5 mg. These two groups of mice were significantly different in their ability to induce this aspect of GVHD (P < 0·00001 by Student’s t-test).
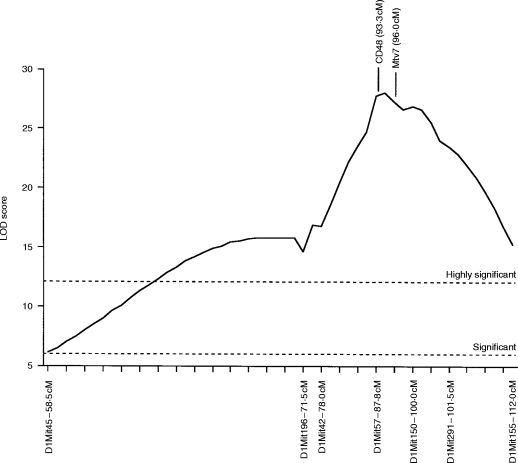
Analysis of the data using the Map Manager QT linkage analysis program19 indicated that the locus involved is most likely situated between the linkage markers D1Mit57 and D1Mit150 (Fig. 4). As shown in Fig. 4, two candidate genes in this region are Mtv7, encoding an endogenous retroviral superantigen, and CD48, the murine ligand of CD2.23
Figure 4.
Likelihood plot obtained for Chromosome 1 using the Map Manager QT linkage analysis program.19 Significance levels were calculated using the permutation test method of Churchill & Doerge,18 as implemented in the Map Manager QT linkage analysis software.19 This method indicated that, for the data set used, LOD scores greater than 6·0 are significant at the P = 0·05 level (indicated as ‘Significant’), while LOD scores greater than 12·1 are significant at the P = 0·001 level (indicated as ‘Highly Significant’). cM values represent distance from the centromere as given in the Mouse Genome Database.23
Evidence for an influence of a Chromosome 4 locus
Further analysis was also performed for Chromosome 4 linkage markers. These results are summarized in Table 3. A significant result was obtained for the marker D4Mit42 but not for any of the more proximal markers investigated (because of the number of linkage tests performed, a P-value of <0·02 is generally not considered significant in a mapping study). The mean spleen weight of recipients of lymphoid cells from donors homozygous at D4Mit42 was 165·2 mg whereas mean spleen weight of recipients of lymphoid cells from donors heterozygous at this marker was 114·2 mg. These two groups of mice were significantly different in this aspect of GVHD (P < 0·006 by Mann–Whitney U-test). Interval mapping of Chromosome 4 using the Map Manager QT program also indicated that a locus in the vicinity of D4Mit42 exerts a significant influence on the splenomegaly phenotype. A peak LOD score of 7·2 was obtained at ≈5 cM proximal of the D4Mit42 marker. Permutation analysis of the data indicated that a LOD score greater than 5·8 can be considered significant.
Further evidence suggesting a role for a Chromosome 4 locus was suggested by analysis of the ability of donor B10BX mice to induce splenomegaly according to their combined genotype at the Chromosome 1 and Chromosome 4 linkage markers D1Mit150 and D4Mit42. As shown in Fig. 5, mice that were heterozygous at both linkage markers were least able to induce acute-GVHD-associated splenomegaly in recipients (mean spleen weight in recipients of 86·2 mg); mice homozygous at D4Mit42 but not at D1Mit150 induced slight splenomegaly (mean spleen weight in recipients of 115·5 mg); mice homozygous at D1Mit150 but not at D4Mit42 induced greater splenomegaly (mean spleen weight in recipients of 156·8 mg); while mice homozygous at both loci induced the greatest level of splenomegaly in recipients (mean spleen weight in recipients of 222·1 mg).
These results therefore suggest that a locus located at the distal end of Chromosome 4 might also exert an influence on this aspect of GVHD in the B10D2F1 model. Furthermore, the proportion of negatives (spleen weight <158 mg) observed in the double homozygous group (6/21, 29%) is comparable to the proportion of false negatives observed in the B10.D2 control group previously studied (17/48=35%, see Fig. 1), suggesting that no other loci contribute to this phenotype.
The only other locus that demonstrated a high proportion of B10 homozygosity in the phenotypically positive B10BX group was D6Mit86 (see Table 1), which showed homozygosity in 19/26 of the mice. When all of the B10BX mice were assessed for this linkage marker, it was found that 25/59 of the phenotypically negative mice were homozygous for the marker, giving an overall χ2 value of 6·814 (P < 0·02) which does not reach the level of significance (P < 0·001) that may be considered meaningful in a mapping study.
DISCUSSION
The results presented here establish that a gene on Chromosome 1, and possibly also a gene on Chromosome 4 of the mouse, exert a significant influence on early events occurring during development of GVHD in the B10D2F1 model. Although these loci were mapped in this study using splenomegaly as a marker of GVHD, further studies currently underway in our laboratory indicate that the Chromosome 1 locus influences not only splenomegaly, but plays a major role in determining whether the GVHD developing in recipient mice is of the acute or chronic type.
Among the genes known to be encoded in the implicated region of Chromosome 1 is the Mtv7 (Mls1) endogenous superantigen.23 A number of recent papers have implicated Mls antigens as being involved in murine GVHD models.24–27 Most notably, Miconnet et al.27 demonstrated that GVHD is significantly more severe in BALB.D2-Mlsa (Mtv-7+) recipients of B10.D2 bone marrow and spleen cells than in BALB/c (Mtv-7−) recipients, thus apparently demonstrating that Mls antigen disparities can influence GVHD. It therefore is likely that the Chromosome 1 gene identified in this study may be Mtv7 (Mls1).
Some evidence has been presented that suggests that T cells recognizing the Mls1 antigen presented by B cells preferentially differentiate along the Th1 pathway.28 This would suggest that the reason for the differential occurrence of acute versus chronic GVHD in B10D2F1 recipients of B10.D2 versus D2 donor spleen cells may be that, in the former case, recognition of the Mls-1 antigen causes a rapid expansion of Mls1-reactive T cells that differentiate along the Th1 pathway, secrete Th1-associated cytokines and cause development of the inflammatory pathology associated with acute GVHD in this model. Conversely, when DBA/2 donor cells are used, there would be no Mls1 disparity, a much lower level of inflammatory cytokines is perhaps present and the GVHD may therefore follow a ‘default’ pathway which in this case leads to a predominance of Th2 cells and to chronic GVHD-associated pathology.
An alternative possibility is that Mls disparity may influence the magnitude of early T-cell activation but that some other factor determines whether these T cells subsequently differentiate into Th1 or Th2 cells. This model is similar to the findings of Scott et al.29 who observed in a model of autoimmune diabetes that the development of diabetes was influenced by a non-MHC gene that determined whether antigen-activated T cells subsequently differentiated along the Th1 or Th2 pathways.
Yet another possibility is that the locus on Chromosome 1 is not Mtv7 but rather a closely linked locus that is capable of influencing early events in acute GVHD. In this respect it is notable that CD48 maps to the same region of Chromosome 1 as Mtv723 and is the murine ligand of CD2, which has recently been implicated in influencing Th1/Th2 switching.30–32 Polymorphism in CD48 might therefore hypothetically also be a possible mechanism whereby genetic differences at Chromosome 1 influence GVHD in this model.
The possible identity of the Chromosome 4 locus is more ambiguous. Mtv13 (Mls2) maps to Chromosome 4 but is more proximal (49·5 cM) than the D4Mit42 linkage marker (81·0 cM).23 Therefore, if indeed a Chromosome 4 locus is involved, it is most likely not an endogenous superantigen but perhaps a polymorphism in another molecule that is influencing early events in the GVHD process. In this light, it is interesting that the gene for CD30, which has been implicated in Th1/Th2 switching,33 is located in the distal region of Chromosome 4 (75·8 cM).23
It is very unlikely that either the Chromosome 1 or the Chromosome 4 loci simply encode traditional minor histocompatibility antigens. In the model studied, donors and hosts differ at the entire MHC region. This is an enormous antigenic mismatch and it is difficult to see how presence or absence of an additional minor histocompatibility antigen disparity would have such a major modifying effect on the GVHD. It seems far more likely that the loci mapped in this study either encode endogenous superantigens or encode immune effector molecules, polymorphic forms of which might have differential effects on the nature of the immune response developing in response to the MHC mismatch and thereby exert a significant influence on the characteristics of the GVHD response.
Further studies will obviously be necessary before a clear answer can be reached on whether the non-MHC loci influencing GVHD in the B10D2F1 and other murine models do so by encoding endogenous superantigens or by encoding such polymorphic forms of immune effector molecules. Either way, the result is of considerable significance to human bone marrow transplantation. Although it was previously thought that humans do not have endogenous superantigens comparable to the Mtv antigens found in the mouse genome, it has recently been convincingly demonstrated that the human genome does contain such antigens and that they may influence immune responses in a manner similar to the endogenous superantigens of the mouse.34,35 The human genome is also known to contain polymorphisms in many immune effector molecules.1–6 Thus, if this type of polymorphism is the basis of the genetic effects on GVHD outcome observed in mice, it could also be exerting an influence on the development of GVHD in human bone marrow transplant recipients.
The wide variation in severity of GVHD observed in MHC-matched human bone marrow transplant recipients may be due to genetic polymorphism at non-MHC loci such as those mapped in this study. Further analysis of murine models will lead to an understanding of the degree to which non-MHC loci that do not encode traditional minor histocompatibility antigens influence GVHD severity. In future, it may be possible to type prospective bone marrow donors for non-MHC polymorphisms known to influence development of GVHD and thus more reliably evaluate the relative risks associated with use of bone marrow from different prospective donors.
Acknowledgments
This work was supported in part by National Institutes of Health Grant AI33026 and by grant no. IRG-161 from the American Cancer Society.
References
- 1.Turner DM, Williams DM, Sankaran D, Lazarus M, Sinnott PJ, Hutchinson IV. An investigation of polymorphism in the interleukin-10 gene promoter. Eur J Immunogen. 1997;24:1. doi: 10.1111/j.1365-2370.1997.tb00001.x. [DOI] [PubMed] [Google Scholar]
- 2.Walley AJ, Cookson WO. Investigation of an interleukin-4 promoter polymorphism for associations with asthma and atopy. J Med Genet. 1996;33:689. doi: 10.1136/jmg.33.8.689. [DOI] [PMC free article] [PubMed] [Google Scholar]
- 3.Bailly S, di Giovine FS, Blakemore AI, Duff GW. Genetic polymorphism of human interleukin-1 alpha. Eur J Immunol. 1993;23:1240. doi: 10.1002/eji.1830230607. [DOI] [PubMed] [Google Scholar]
- 4.Bioque G, Crusius JBA, Koutroubakis I, et al. Allelic polymorphism in interleukin-1 beta and interleukin-1 receptor antagonist (IL-1Ra) genes in inflammatory bowel disease. Clin Exp Immunol. 1995;102:379. doi: 10.1111/j.1365-2249.1995.tb03793.x. [DOI] [PMC free article] [PubMed] [Google Scholar]
- 5.Matesanz F, Alcina A. Glutamine and tetrapeptide repeat variations affect the biological activity of different mouse interleukin-2 alleles. Eur J Immunol. 1996;26:1675. doi: 10.1002/eji.1830260802. [DOI] [PubMed] [Google Scholar]
- 6.Verjans GM, Messer G, Weiss EH, van der Linden SM, Kijlstra A. Polymorphism of the tumor necrosis factor region in relation to disease: an overview. Rheumatic Dis Clin North Am. 1992;18:177. [PubMed] [Google Scholar]
- 7.Blakemore AI, Cox A, Gonzalez AM, et al. Interleukin-1 receptor antagonist allele (IL1RN*2) associated with nephropathy in diabetes mellitus. Hum Genet. 1996;97:369. doi: 10.1007/BF02185776. [DOI] [PubMed] [Google Scholar]
- 8.Duff GW. Interleukin-1 receptor antagonist and genetic susceptibility to inflammation. J Interferon Res. 1994;14:305. doi: 10.1089/jir.1994.14.305. [DOI] [PubMed] [Google Scholar]
- 9.Via CS, Shearer GM. T–cell interactions in autoimmunity: insights from a murine model of graft-versus-host disease. Immunol Today. 1988;9:207. doi: 10.1016/0167-5699(88)91215-7. [DOI] [PubMed] [Google Scholar]
- 10.Fast LD. Identification of a single non-H-2 gene regulating graft-versus-host disease response. J Immunol. 1990;144:4177. [PubMed] [Google Scholar]
- 11.Van Elven EH, Rolink AG, van der Veen F, Gleichmann E. Capacity of genetically different T lymphocytes to induce lethal graft-versus-host disease correlates with their capacity to generate suppression but not with their capacity to generate anti-F1 killer cells. A non-H-2 locus determines the inability to induce lethal graft-versus-host disease. J Exp Med. 1981;153:1474. doi: 10.1084/jem.153.6.1474. [DOI] [PMC free article] [PubMed] [Google Scholar]
- 12.Allen RD, Staley TA, Sidman CL. Differential cytokine expression in acute and chronic murine graft-versus-host disease. Eur J Immunol. 1993;23:333. doi: 10.1002/eji.1830230205. [DOI] [PubMed] [Google Scholar]
- 13.Garlisi CG, Pennline KJ, Smith SR, Siegal MI, Umland SP. Cytokine gene expression in mice undergoing chronic graft-versus-host disease. Mol Immunol. 1993;30:669. doi: 10.1016/0161-5890(93)90078-p. [DOI] [PubMed] [Google Scholar]
- 14.De Wit D, Van Mechelin M, Zanin C, et al. Preferential activation of Th2 cells in chronic graft-versus-host reaction. J Immunol. 1993;150:361. [PubMed] [Google Scholar]
- 15.Via CS, Rus V, Gately MK, Finkelman FD. IL-12 stimulates the development of acute graft-versus-host disease in mice that normally would develop chronic, autoimmune graft-versus-host disease. J Immunol. 1994;153:4040. [PubMed] [Google Scholar]
- 16.Dietrich W, Katz H, Lincoln SE, et al. A genetic map of the mouse suitable for typing intraspecific crosses. Genetics. 1992;131:423. doi: 10.1093/genetics/131.2.423. [DOI] [PMC free article] [PubMed] [Google Scholar]
- 17.Hogan B, Beddington R, Costantini F, Lacey E. Manipulating the Mouse Embryo. Cold Spring Harbor, New York: Cold Spring Harbor Laboratory Press; 1995. [Google Scholar]
- 18.Churchill GA, Doerge RW. Empirical threshold values for quantitative trait mapping. Genetics. 1994;138:963. doi: 10.1093/genetics/138.3.963. [DOI] [PMC free article] [PubMed] [Google Scholar]
- 19.Manly K. Map Manager QT. 1998. World Wide Web ( http://mcbio.med.buffalo.edu/mmQT.html), March.
- 20.Pals ST, Gleichmann E. A sequential alloactivation of subsets of donor T cells underlies the transition from acute graft-versus-host disease (GVHD) to chronic GVHD. Trans Proc. 1983;15:1480. [Google Scholar]
- 21.Korngold R, Sprent J. Variable capacity of L3T4+ T cells to cause lethal graft-versus-host disease across minor histocompatibility barriers in mice. J Exp Med. 1987;165:1552. doi: 10.1084/jem.165.6.1552. [DOI] [PMC free article] [PubMed] [Google Scholar]
- 22.Rolink AG, Pals ST, Gleichmann E. Allosuppressor and allohelper T cells in acute and chronic graft-vs.-host disease. II. F1 recipients carrying mutations at H-2K and/or I-A. J Exp Med. 1983;157:755. doi: 10.1084/jem.157.2.755. [DOI] [PMC free article] [PubMed] [Google Scholar]
- 23.Mouse Genome Database (MGD) Mouse Genome Informatics. Bar Harbor Maine: The Jackson Laboratory; 1998. World Wide Web ( http://www.informatics.jax.org/), March. [Google Scholar]
- 24.Muluk SC, Hakim FT, Shearer GM. Regulation of graft-versus-host-reaction by Mlsa-reactive donor T cells. Eur J Immunol. 1992;22:1967. doi: 10.1002/eji.1830220803. [DOI] [PubMed] [Google Scholar]
- 25.Mann RA, Singh AB, Singh M, Jetzt AE. The host response in graft versus host disease. II. The emergence of host protective cells is in part determined by background genomic compatibility. Cell Immunol. 1993;151:39. doi: 10.1006/cimm.1993.1220. [DOI] [PubMed] [Google Scholar]
- 26.Jones MS, Riley R, Hamilton BL, Paupe J, Perez D, Levy RB. Endogenous superantigens in allogeneic bone marrow transplant recipients rapidly and selectively expand donor T cells which can produce IFN-gamma. Bone Marrow Transplant. 1994;14:725. [PubMed] [Google Scholar]
- 27.Miconnet I, Roger T, Seman M, Bruley-Rosset M. Critical role of endogenous Mtv in acute lethal graft-versus-host disease. Eur J Immunol. 1995;25:364. doi: 10.1002/eji.1830250209. [DOI] [PubMed] [Google Scholar]
- 28.Gollob KJ, Nagelkerken L, Coffman RL. Endogenous retroviral superantigen presentation by B cells induces the development of type 1, CD4+ T helper lymphocytes. Eur J Immunol. 1993;23:2565. doi: 10.1002/eji.1830231028. [DOI] [PubMed] [Google Scholar]
- 29.Scott B, Liblau R, Degermann S, et al. A role for non-MHC genetic polymorphism in susceptibility to spontaneous autoimmunity. Immunity. 1994;1:73. doi: 10.1016/1074-7613(94)90011-6. [DOI] [PubMed] [Google Scholar]
- 30.Biancone L, Andres G, Ahn H, et al. Distinct regulatory roles of lymphocyte costimulatory pathways on T helper type-2 mediated autoimmune disease. J Exp Med. 1996;183:1473. doi: 10.1084/jem.183.4.1473. [DOI] [PMC free article] [PubMed] [Google Scholar]
- 31.Gollob JA, Li J, Kawasaki H, et al. Molecular interaction between CD58 and CD2 counter-receptors mediates the ability of monocytes to augment T cell activation by IL-12. J Immunol. 1996;157:1886. [PubMed] [Google Scholar]
- 32.Gollob JA, Ritz J. CD2–CD58 interaction and the control of T-cell interleukin-12 responsiveness. Adhesion molecules link innate and acquired immunity. Ann N Y Acad Sci. 1996;795:71. doi: 10.1111/j.1749-6632.1996.tb52656.x. [DOI] [PubMed] [Google Scholar]
- 33.Del Prete G, De Carli M, D’Elios MM, et al. CD30-mediated signaling promotes the development of human T helper type 2-like T cells. J Exp Med. 1995;182:1655. doi: 10.1084/jem.182.6.1655. [DOI] [PMC free article] [PubMed] [Google Scholar]
- 34.Boylston AW, Clarke GR, Lancaster FC, Reyburn H. Evidence for an endogenous superantigen deleting human Vβ2 positive T-lymphocytes. Ann N Y Acad Sci. 1995;756:113. doi: 10.1111/j.1749-6632.1995.tb44494.x. [DOI] [PubMed] [Google Scholar]
- 35.Conrad B, Weissmahr RN, Boni J, Arcari R, Schupbach J, Mach B. A human endogenous retroviral superantigen as candidate autoimmune gene in type I diabetes. Cell. 1997;90:303. doi: 10.1016/s0092-8674(00)80338-4. [DOI] [PubMed] [Google Scholar]


