

Abstract
Interleukin-4 (IL-4) plays a major role in immunoglobulin E (IgE) production. Its signal is conferred to effector cells through binding to the α chain of the IL-4 receptor (IL-4Rα). We present further evidence for polymorphisms in the IL-4Rα gene having an effect on IgE regulation. For two of four common polymorphisms, S503P and Q576R, we found an association with lowered total IgE concentrations (P =0·0008 if occurring together). The polymorphism S503P has not yet been described and is located within the I4R motif of the receptor. In vitro analyses using synthetic peptides of this region showed that the tyrosine kinase Janus kinase 1 (JAK1), as well as IRS-1 and IRS-2 bind to the I4R motif irrespective of the polymorphism or a tyrosine phosphorylation. In vivo immunoassays using T cells of four different groups of individuals (S503/Q576; P503/Q576; S503/R576; P503/R576) revealed that only in case of both polymorphisms the phosphorylation of IRS-1 and IRS-2, but not JAK1 was increased. We found no binding of STAT6 to the I4R synthetic peptides; however, the phosphorylation was reduced in the presence of any of the two polymorphisms, including P503 alone. We discuss possible conformational changes of the receptor leading to the observed effects on the phosphorylation status of IRS-1, IRS-2 and STAT6, in addition to previous findings that Q576R alters STAT6 binding. We conclude that P503 and R576 influence the signal transduction pathways through the IL-4Rα, an effect that is magnified by the presence of both polymorphisms. This could explain the observed association effects with lowered total IgE concentrations.
INTRODUCTION
Atopy is the familial syndrome underlying bronchial asthma, atopic eczema and allergic rhinoconjunctivitis. It is characterized by the presence of specific immunoglobulin E (IgE) antibodies to common allergens and elevated total IgE concentrations. The development of allergic symptoms is largely determined by genetic factors.1 Because of high prevalence, age-dependent penetrance and assumed heterogeneity, it has proved difficult to characterize the mode of inheritance and the genes involved in IgE responsiveness.2 Marsh and colleagues showed linkage of markers on chromosome 5q31–33 to a gene controlling total serum IgE concentration in a non-cognate fashion,3 a finding that has caused controversial discussion.4 Besides other candidates, the gene coding for the interleukin-4 (IL-4) molecule is situated in this region. IL-4 plays a major role in stimulating B-cell proliferation, influencing B-cell differentiation towards IgE production and participating in the T helper cell (Th0/Th2) shift.5–7 The IL-4 signal is conferred to effector cells through binding to IL-4 receptors. These represent complex transmembrane receptors composed of a 140 000 MW high affinity binding chain (IL-4Rα) and optionally the common γ chain shared by several interleukin receptors8 or the IL13Rα chain,9 both of them modifying the signal on IL-4 binding.10 All chains are members of the haematopoietin receptor superfamily.11 The IL-4Rα chain binds IL-4 and mediates its effect through kinases of the Janus kinase (JAK) family leading to tyrosine phosphorylation of several substrates. Among those are the receptor by itself, the insulin-receptor-like substrates IRS-1, IRS-2 (4PS), and the STAT6 transcription factor.12–14 The coding gene for IL-4Rα has been localized to the short arm of chromosome 16 (16p12.1).15
In respect of numerous functions in IgE regulation, as well as B- and T-cell differentiation, the IL-4Rα gene represents a candidate gene for atopy.
Our interest has been to analyse common polymorphisms of the IL-4Rα gene, their association with atopic phenotypes and their functional implications in order to underline the potential involvement of the gene in the initiation and maintenance of allergic processes.
MATERIALS AND METHODS
Individuals
The individuals were recruited from two different groups of nuclear families. Population 1: recruited through a population-based study,16 64 families participated. Population 2: 45 families, recruited through our outpatient department, participated. In both populations an atopic child served as the index patient. A medical history was recorded, skin prick tests were performed (using the same aero-allergens) and blood was drawn.
Determination of allele frequencies was performed in the parents of the families regarding them as independent individuals.
The genotyping and the association studies were performed in the children of the families aged from 6 to 22 years (mean 15 years); 91% of them were atopic according to the definition stated below, 77% showed total IgE concentrations above 100 kU/l, and 87% specific sensitization to common inhalant allergens.
Phenotype analysis
Specific IgE was detected by enzyme-linked immunosorbent assay (ELISA) against grass pollens, Dpt, cat dander and birch pollens (Magic Lite; ALK, Denmark). The cut-off point for a positive titre was 1·43 ML units.17 Detectable IgE to one of the four allergens or a positive skin prick test response to one of them were the criteria for ‘any specific sensitization’. Measurement of total serum IgE was carried out by an enzyme allergosorbent test (Phadezym; Pharmacia, Uppsala, Sweden) and measured continuously. Atopy was defined as at least one positive specific IgE titre or an elevated total IgE titre above 100 kU/l.18
Amplification of genomic DNA by polymerase chain reaction (PCR)
DNA was extracted from peripheral blood leukocytes following standard protocols and column purified (DNA midi kit; Qiagen, Germany). To amplify the target DNA in the polymorphic regions we used four oligonucleotide primer pairs: E400A, 5′-TGGAGATCAGCAAGACAGTC-3′ and 5′- GGTCCAGGAACAGGCTCTCT-3′; C431R, 5′-TGTGGCCCGGCTAACAGAGA-3′ and 5′-AGGGTTGCCTGCGATGACGA-3′; S503P, 5′-AAGTCCTCCTGCCAGCCCGA-3′ and 5′-TTTCTGGCTCAGGTTGGGGC-3′; Q576R, 5′- CTCTCTGAGCCAACCACTGT-3′ and 5′-GCTCCACCGCATGTACAAAC-3′. PCR was carried out in a volume of 10 μl containing 30 ng DNA, 5 pmol of each primer, 0·06 U Taq-Polymerase (Pharmacia, Uppsala, Sweden) and 2 mmol dinucleoside triphosphate (dNTP)-mix with the buffer recommended by the supplier. Annealing temperatures were 60° (Q576R), 62° (S503P and C431R) or 64° (E400A).
The numbers of amino acids corresponded to the IL-4α chain precursor as published by Idzerda et al.8 They differ from the numbers as published earlier from our group, those referring to the mature protein.19
Sequencing
Sequencing by the dideoxy chain termination method was performed on an automated sequencer (ALF DNA Analysis System, Pharmacia, Germany).
SSCP-analysis20
The amplified products were resolved on non-denaturing 12% polyacrylamide gels at 20° for 2 hr. Glycerol concentrations in the gel were for E400A 10% and for Q576R 5%. For S503P no glycerol was added. The gels were silver-stained as described elsewhere.21 Two known homozygote individuals and one heterozygote individual as confirmed by sequencing were included in each reaction. The genotyping was performed by two investigators unaware of the phenotypes.
Restriction fragment length polymorphism (RFLP) analysis
Phenotyping of the C431R polymorphism made use of a Tsp45I-RFLP present in the allele coding for arginine. Restriction was performed in a volume of 10 μl containing 5 μl of the PCR-product and the buffer recommended by the supplier for 90 min at 65°. The fragments were resolved on a 12% polyacrylamide gel. The individuals with known phenotypes were included in each reaction. The genotyping was performed by two investigators unaware of the phenotypes.
Statistical analysis
The number of alleles for each polymorphism was counted in all 181 children of the study populations as far as the genotype could be determined unequivocally. To count for the individuals being siblings and to adjusted for age and sex of the study-population, regression analysis have been applied. Logistic regression analysis and linear regression analysis for the explanation of the phenotypes ‘specific sensitization to common inhalant allergens’ treated as a dichotomic parameter and ‘total serum IgE’ treated as a continuous parameter on a logarithmic scale by the genotypes ‘presence of the polymorphic allele’ were performed. Analysis followed the method of Zeger and Liang accounting for the correlation between sibs.22
A P-value below 0·025 was considered significant counting for multiple testing. The average IgE concentration in individuals bearing one of the polymorphisms is calculated by 10 to the estimate.
In vitro binding assays
The following synthetic peptides corresponding to the I4R-motif of the IL-4Rα were used: wildtype unphosphorylated Y497 (NH2-LVIAGNPAYRSFSNSLSQSP-COOH), wildtype phosphorylated Y497 (NH2-LVIAGNPA(pY)RSFSNS LSQSP-COOH) and mutant phosphorylated Y497 (NH2-LVIAGNPA(pY)RSFSNP LSQSP-COOH) (all from SNPE GmbH, Frankfurt, Germany). The peptides were coupled to Affigel 10 beads (BioRad Laboratories, München, Germany) at a ratio of 3 mg peptide per ml of beads. To assess the binding of cellular proteins to the peptides, 20 μl of peptide-conjugated beads were incubated either with 100 ng recombinant IRS-1 (Upstate Biotechnology, New York, NY) or with T-cell lysates (3×10⁷ cells). The peptide associated IRS-1, IRS-2, JAK1 and STAT6 were analysed by immunoblotting with specific antibodies (anti-IRS-1, anti-IRS-2 Upstate Biotechnologies; anti-JAK1 Santa Cruz Laboratories, Santa Cruz, CA; anti-STAT6 Transduction Laboratories, Lexington, KY) and developed using a chemiluminescence kit (ECL, Amersham, Germany).
Cell culture and IL-4 stimulation
Peripheral-blood mononuclear cells derived from four different groups of probands (wildtype: S503/Q576; P503/Q576; S503/R576 and P503/R576) and least least two different individuals in each group were grown for 48–72 hr at 37° and 5% CO2 in the presence of 3 μg/ml phytohaemagglutinin (Gibco BRL, Eggenstein, Germany) in RPMI-1640 containing 2 mm l-glutaminee, 20 mm HEPES, 100 U/ml penicillin, 50 mg/ml streptomycin and 10% fetal calf serum (FCS) (PAN Systems GmbH, Aidenbach, Germany).
Cells were made quiescent for 5–16 hr in RPMI-1640/glutaminee/HEPES/penicillin/streptomycin and 1% FCS. T cells (2±107) were stimulated with 100 nm human IL-4 (PAN Systems GmbH) for 5–15 min at 37°. Cell pellets were then stored at −80°.
Immunoprecipitation and immunoblot
After thawing, cells were suspended in lysis buffer (10 mm Tris (pH 7·8), 5 mm ethylenediamine tetra-acetic acid (EDTA), 50 mm NaCl, 30 mm pyrophosphate, 50 mm sodium fluoride, 20 μm sodium orthovanadate, 1% Triton-X-100, 1 mm phenylmethylsulphonyl fluoride, 5 μg/ml aprotinin, 1 μg/ml pepstatin A and 10 μg/ml leupeptin; 108 cells/ml buffer) and incubated for 60 min at 4°. Insoluable material was removed by centrifugation and equal amounts of cell lysates (BioRad protein assay, BioRad Laboratories) were incubated with the 1 μg/ml of the appropriate antibodies (IRS-1, IRS-2, Jak1 or STAT6) for 16 hr at 4°. Antibodies were precipitated with protein A sepharose beads (Pharmacia). After four washes with lysis buffer, proteins were analysed on sodium dodecyl sulphate–polyacrylamide gel electrophoresis (SDS–PAGE) and transferred onto polyvinylidene difluoride filters (Millipore, Bedford, UK). The residual binding sites on the filters were blocked with triphosphate-buffered saline (TPBS: 150 mm sodium chloride, 3 mm potassium chloride, 1 mm potassium dihydrogen phosphate, 7 mm disodium hydrogen phosphate, 0·05% Tween 20) and 5% non-fat dried milk over night. The filters were incubated with antiphosphotyrosine antibodies (Santa Cruz Laboratories), the appropriate horseradish peroxidase (HRP)-coupled secondary antobodies (Dako GmbH, Germany) and developed with ECL (Amersham). Filters were stripped, washed in TPBS and immunostained with the respective antibody used for precipitation to control protein concentrations.
RESULTS
Allele frequencies
We determined the frequencies of the four alleles diverging from the published genotype as being between 8·9 and 20·9%8 (Table 1). This defines them as polymorphisms rather than mutations.
Table 1.
Allelic frequencies as determined in 141 independent individuals

Frequency =calculated frequency
Association studies
The two polymorphisms S503P and Q576R showed significant association with total IgE concentrations, but not with the phenotype ‘specific sensitization’ (Table 2). The less frequent alleles, P503 and R576, were associated with lower total IgE concentrations. Regarding the parameter estimates, the expected IgE level in the presence of P503 or R576 was 53% of the level in wildtype individuals.
Table 2.
Logistic regression analysis and linear regression analysis for the explanation of the phenotypes ‘specific sensitization to common inhalant allergens’ treated as a dichotomic parameter and ‘total serum IgE’ treated as a logarithmic linear parameter by the genotypes ‘presence of the allele P503 or R576, respectively’

The level of significance was adjusted to P < 0·025 to account for multiple testing. The negative parameter estimate indicates lower total IgE levels in individuals bearing the respective polymorphisms, it allows calculating the average IgE levels.
The most prominent result was seen in individuals presenting both alleles P503 and R576 (P =0·0008).
Linkage disequilibrium
We found substantial linkage disequilibrium in the IL-4 receptor gene. For the polymorphic alleles P503 (allele frequency 15·5%) and R576 (allele frequency 20·9%), 76% of the R576 allele carriers are also carriers for P503. Vice versa, 95% of the P503 allele-carriers are also carriers for R576.
In vitro binding assays
Performing the in vitro assays revealed that IRS-1, IRS-2 and JAK1 bind to all three synthetic peptides tested, including the unphosphorylated wildtype peptide (Fig. 1), but STAT6 (in cell lysates) does not bind to any of them (result not shown). Therefore, STAT6 served as a specificity control.
Figure 1.
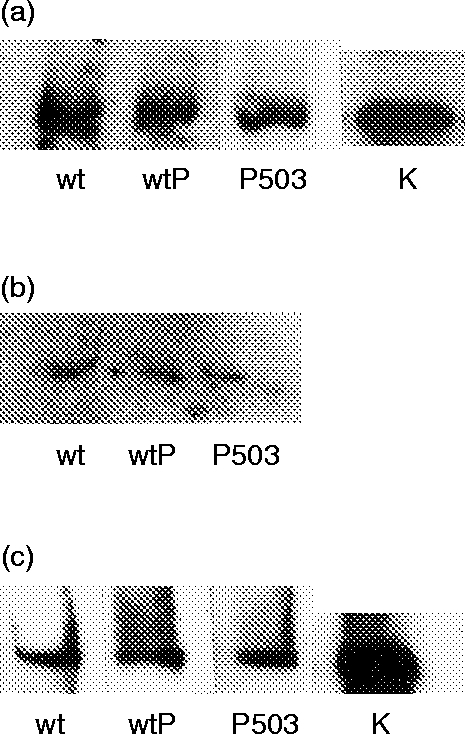
In vitro binding assay with three synthetic peptides (wildtype unphosphorylated =wt; wildtype phosphorylated at Y497 =wtP; polymorphism S503P phosphorylated=p503) corresponding to the I4R motif of IL-4Rα. Peptides were incubated with T-cell lysates (3±107 cells) or recombinant IRS-1 (100 ng), and immunoblotted. JAK1, IRS-1 and IRS-2 bind equally to all three peptides. (a) Binding of JAK1 (cell-lysate); (b) binding of IRS-2 (cell-lysate); (c) binding of IRS-1 (recombinant); K=control of initial substrate concentration.
Immunoassays
To elucidate the functional aspects of the polymorphisms we performed immunoassays in groups of probands presenting wildtype alleles, one polymorphic allele, respectively, or both polymorphic alleles. We could not detect a difference in the self-phosphorylation pattern of JAK1 in T cells of any of the groups (results not shown).
However, the phosphorylation rate of IRS-1 and IRS-2 was increased in proband cells bearing both polymorphisms (P503/R576). Phosphorylation of STAT6 was reduced in proband cells bearing any single or both of the polymorphisms (Fig. 2).
Figure 2.

Representative pictures of in vivo immunoassays with T-cell lysates (5±107) derived from four different groups of individuals. Phenotypes for lanes 1, 2, 3 P503/R576; lanes 4, 5 S503/R576; lanes 6, 7 P503/Q576; lanes 8, 9 wildtype. Control picture of STAT6-phosphorylation: lanes 1–4 unstimulated cells; lane 5 wildtype; lane 6 P503/Q576; lane 7 S503/R576; lane 8 P503/R576. Incubations were performed with antiphosphotyrosine (1:1000) and the respective antibodies (1:1500) against the substrates as a control. P503/R576 individuals show enhanced phosphorylation of IRS-2, whereas STAT6 phosphorylation is reduced in presence of any mutation. (a) IRS-;(b) STAT6.
DISCUSSION
By applying linkage analysis in affected sib-pairs evidence for a gene at the chromosomal region 16p12–11 influencing IgE responsiveness was found.23 Association studies with common polymorphisms in the coding part of the candidate gene IL-4Rα demonstrated a possible involvement of this gene in atopy.19,23,24
We concentrated on four polymorphisms, two of them already known E400A and C431R,19 one recently found to be associated with atopy (Q576R)24 and one which has not yet been described (S503P). Regarding the seven known polymorphisms leading to amino acid exchanges, these four are situated in the intracellular part of the receptor close to significant substrate binding sites. They cover the functionally important parts of the receptor at fairly equal distances. We applied association studies in a population of children and young adults aged between 6 and 22 years in order to distinguish between affected and non-affected individuals. This represents the most reliable test population, eliminating the possibility of sensitization being not yet or no longer detectable.
Association was seen at the known polymorphic site Q576R and to an equal extent at the polymorphic site S503P. The association was only seen regarding lower total serum IgE concentrations. This is striking, as there normally is a great overlap in the phenotypes ‘specific sensitization’ and ‘elevated total serum IgE’.
The most prominent result has been seen in individuals carrying both polymorphic alleles, P503 and R576. This might merely be a statistical artefact, however, it might also indicate interactions of both polymorphic sites.
Very recently association of the polymorphism Q576R with the atopic phenotype has been shown.24 Substrates of this site are STAT6 and the phosphatase SHP-1. The exchange to arginine introduces an additional positive charge and probably alters the binding site for these substrates. On the basis of enhanced CD23 expression the authors of the former study postulate an upregulatory effect in individuals being heterozygous and homozygous for R576 (n =8). Their results stand in direct contrast to our findings. Homo- and heterozygous individuals for R576 (n =66) showed significantly lower IgE levels than those who are homozygous for Q576 (n =113). Moreover, the interpretations are rendered more difficult as S503P stands in direct linkage disequilibrium with Q576R, 76% of the R576 allele carriers are also P503 allele carriers.
In order to explain these contradictions and to elucidate the importance of both polymorphisms in cells, functional studies were performed.
The amino acid at position 503 is part of the insulin-IL-4 receptor motif (I4R). This motif contains a tyrosine residue at position 495, which is phosphorylated by JAK1 in response to IL-4. Furthermore, it has been shown to be crucial for binding and tyrosine-phosphorylation of IRS-1 and IRS-2, which consequently initiates signal transduction cascades towards cell proliferation.25
The serine-proline substitution results in a change in polarity of the receptor and could well affect its conformation (possibly interrupting a β-turn according to secondary structure predictions; data not shown).
For the first time our analyses showed that JAK1 exactly binds to the I4R motif. This was seen regardless of the polymorphism S503P. Futhermore, its self-induced phosphorylation status is not influenced by either polymorphism, S503P or Q576R. Therefore, alterations of the signal transduction cascades can not be caused by altered binding or phosphorylation capacities of the JAK1 kinase.
The IRS molecules bind to the I4R motif, even to the unphosphorylated wildtype peptide, which initially was supposed to serve as a control. This would imply that regulation of these molecules might not depend on binding capacities and that perhaps unphosphorylated IRS molecules interact with the IL-4Rα at any time. Moreover, P503 alone seems to have no effect on IRS-1 and IRS-2 binding and phosphorylation. However, in individuals bearing both polymorphisms (P503/R576) the phosphorylation of the IRS molecules is strongly increased (Fig. 2). This might result from changes in the receptor’s charge and conformation as stated above, leading to a tighter binding of these substrates (Fig.3). Increased phosphorylation of IRS-1 and IRS-2 possibly abolishes the propagation of the IL-4 receptor signal, as has been shown previously for the insulin receptor.26 This in turn would negatively influence B-cell proliferation and IgE levels, as seen in our association results.
Figure 3.

Model of possible conformational and functional changes in the IL-4Rα signal transduction related to two common polymorphisms in the I4R motif and the tyrosine (Y) rich region (575–631). The polymorphisms P503 and R576 independently influence STAT6 interactions with IL-4Rα, but only in the presence of both is the IRS pathway altered. (a) Wildtype situation: substrates IRS and STAT6 bind, phosphorylation status normal (P); (b) polymorphism S503P: conformational change, IRS pathway unaltered; STAT6 binding impaired (XXX), phosphorylation of STAT6 reduced; (c) polymorphism Q576R: introduction of a positive charge (+), IRS pathway unaltered; STAT6 binding impaired (XXX), STAT6 phosphorylation reduced; (d) polymorphisms S503P and Q576R: conformational change and positive charge; IRS phosphorylation increased; STAT6 binding impaired (XXX), STAT6 phosphorylation reduced.
Regarding STAT6, our functional studies revealed a more complicated picture. In vitro assays showed that STAT6 does not bind to the I4R motif. By using cell lysates in our peptide binding assays, we can also exclude the idea that such a binding is mediated through protein tyrosine binding (PTB) domain-containing proteins, which has been suggested in a previous model, analysing artifical mutations of the IL-4 receptor.27
However, the phosphorylation of STAT6 is reduced in case of any polymorphism. We therefore suggest two phenomena independently leading to a reduced STAT6 binding at the tyrosine rich region (575–631).
A proposed conformational change at position 503. In fact, it has already been shown that alterations in the I4R motif alter the STAT6 pathway. We would argue in favour of the second model of Wang et al.,27 in which conformational changes in the receptor cytoplasmatic region lead to the observed effects (Fig.3). Of course, tertiary structure analysis of IL-4R has to be performed in order to verify our proposals.
The introduction of a positive charge at position 576 leading to enhanced binding of STAT6, as has already been shown.24
Phosphorylated STAT6 forms dimers and controls cell differentiation and the trancription of genes, such as the IL-4 expression.28 As IL-4 is an important factor in the initialization of B-cell proliferation, reduced amounts consequently could lead to a reduction in IgE concentrations.
We conclude that S503P and Q576R independently influence STAT6 binding and lead to lowered total IgE levels. In addition, both polymorphisms occurring together influences the IRS pathways, also leading to lowered total IgE levels. This would imply a magnification of effects in the presence of both polymorphisms, and interestingly, would correlate nicely with our association results. We would recommend further studies with recombinant receptor molecules bearing different combinations of polymorphisms in order to study the influence on proliferation and IgE production, as they have been applied for the Ile50Val polymorphism.29
Acknowledgments
We thank Christiane Mehl and Simone Dischinger who carried out field testing. We would also particularly like to express our thanks to all the individuals who participated in our study. This project is supported by a grant from the German Science Foundation (DFG-De386/2-2).
REFERENCES
- 1.Meyers DA, Marsh DG. Allergy and asthma. In: King RA, Rotter JI, Motulsky AG, editors. The Genetic Basis of Common Disease. New York: Oxford University Press; 1991. p. 201. [Google Scholar]
- 2.Morton NE. Major loci for atopy? Clin Exp Allergy. 1992;22:1041. doi: 10.1111/j.1365-2222.1992.tb00126.x. [DOI] [PubMed] [Google Scholar]
- 3.Marsh D, Neely JD, Breazeale DR, et al. Linkage analysis of IL-4 and other chromosome 5q31.1 markers and total serum Immunoglobulin E concentrations. Science. 1994;264:1152. doi: 10.1126/science.8178175. [DOI] [PubMed] [Google Scholar]
- 4.Blumenthal MN, Wang Z, Weber JL, Rich SS. Absence of linkage between 5q markers and serum IgE levels in four large atopic families. Clin Exp Allergy. 1996;26:892. [PubMed] [Google Scholar]
- 5.Howard M, Farrar J, Hilfiker M, et al. Identification of a T cell-derived β cell growth factor distinct from interleukin 2. J Exp Med. 1982;155:914. doi: 10.1084/jem.155.3.914. [DOI] [PMC free article] [PubMed] [Google Scholar]
- 6.Coffman RL, Lebman DA, Rothman P. Mechanism and regulation of immunoglobulin isotype switching. Adv Immunol. 1993;54:229. doi: 10.1016/s0065-2776(08)60536-2. [DOI] [PubMed] [Google Scholar]
- 7.Hu-Li J, Shevach EM, Mizuguchi J, et al. B cell stimulatory factor-1 (interleukin 4) is a potent costimulant for normal resting T lymphocytes. J Exp Med. 1987;165:157. doi: 10.1084/jem.165.1.157. [DOI] [PMC free article] [PubMed] [Google Scholar]
- 8.Idzerda RL, March CJ, Mosley B, et al. Human interleukin-4 receptor confers biological responsiveness and defines a novel receptor superfamily. J Exp Med. 1990;171:861. doi: 10.1084/jem.171.3.861. [DOI] [PMC free article] [PubMed] [Google Scholar]
- 9.Russell SM, Keegan AD, Harada N, et al. The interleukin-2 receptor γ chain is a functional component of the interleukin-4 receptor. Science. 1993;262:1180. doi: 10.1126/science.8266078. [DOI] [PubMed] [Google Scholar]
- 10.Russell SM, Johnston JA, Noguchi M, et al. Interaction of IL-2Rβ and γc chains with Jak1 and Jak3: implications for XSCID and XCID. Science. 1994;266:1042. doi: 10.1126/science.7973658. [DOI] [PubMed] [Google Scholar]
- 11.Cosman D. The hematopoietin receptor superfamily. Cytokine. 1993;5:95. doi: 10.1016/1043-4666(93)90047-9. [DOI] [PubMed] [Google Scholar]
- 12.Ohara J, Paul WE. Receptors for B-cell stimulatory factor-1 expressed on cells of haematopoietic lineage. Nature. 1987;325:537. doi: 10.1038/325537a0. [DOI] [PubMed] [Google Scholar]
- 13.Park LS, Friend D, Grabstein K, Urdal DL. Characterization of the high-affinity cell-surface receptor for murine B-cell-stimulating factor 1. Proc Natl Acad Sci. 1987;84:1669. doi: 10.1073/pnas.84.6.1669. [DOI] [PMC free article] [PubMed] [Google Scholar]
- 14.Yin T, Tsang ML.-S, Yang Y-C. Jak1 kinase forms complexes with interleukin-4 receptor and 4PS/Insulin receptor substrate-1-like protein and is activated by interleukin-4 and interleukin-9 in T lymphocytes. J Biol Chem. 1994;269:26614. [PubMed] [Google Scholar]
- 15.Pritchard MA, Baker E, Whitmore SA, et al. The interleukin-4 receptor gene (IL4R) maps to 16p11.2p12.1 in the human and to the distal region of mouse chromosome 7. Genomics. 1991;10:801. doi: 10.1016/0888-7543(91)90466-r. [DOI] [PubMed] [Google Scholar]
- 16.Kuehr J, Karmaus W, Forster J, et al. Sensitization to four common inhalant allergens within 302 nuclear families. Clin Exp Allergy. 1993;23:600. doi: 10.1111/j.1365-2222.1993.tb00900.x. [DOI] [PubMed] [Google Scholar]
- 17.Kleine-Tebbe T, Eickholt M, Gätjen M, et al. Comparison between MAGIC LITE®- and CAP®-system: two automated specific IgE antibody assays. Clin Exp Allergy. 1992;22:475. doi: 10.1111/j.1365-2222.1992.tb00150.x. [DOI] [PubMed] [Google Scholar]
- 18.Kjellman N-I.M, Johannson SJ.O, Roth A. Serum IgE levels in healthy children quantified by a sandwich technique (PRIST) Clin Allergy. 1976;6:51. doi: 10.1111/j.1365-2222.1976.tb01411.x. [DOI] [PubMed] [Google Scholar]
- 19.Deichmann KA, Bardutzky J, Forster J, et al. Common polymorphisms in the coding part of the IL4-receptor gene. Biochem Biophys Res Comm. 1997;231:696. doi: 10.1006/bbrc.1997.6115. [DOI] [PubMed] [Google Scholar]
- 20.Orita M, Youichi S, Sekiya S. Rapid and sensitive detection of point mutations and DNA polymorphisms using the polymerase chain reaction. Genomics. 1989;5:156. doi: 10.1016/0888-7543(89)90129-8. [DOI] [PubMed] [Google Scholar]
- 21.Hiort O, Wodtke A, Struve D, et al. Detection of point mutations in the androgen receptor gene using non-isotopic single strand conformation polymorphism analysis. German collaborative intersex study group. Hum Mol Genet. 1994;3/7:1163. doi: 10.1093/hmg/3.7.1163. [DOI] [PubMed] [Google Scholar]
- 22.Zeger SL, Liang KY. The analysis of discrete and continous longitudinal data. Biometrics. 1986;42:121. [PubMed] [Google Scholar]
- 23.Deichmann KA, Heinzmann A, Forster J, et al. Linkage and allelic association of atopy and markers flanking the IL4-receptor gene. Clin Exp Allergy. 1998;28:151. doi: 10.1046/j.1365-2222.1998.00159.x. [DOI] [PubMed] [Google Scholar]
- 24.Hershey GK.K, Friedrich MF, Esswein LA, et al. The association of atopy with a gain-of-function mutation in the α subunit of the interleukin-4 receptor. N Engl J Med. 1997;337:1720. doi: 10.1056/NEJM199712113372403. [DOI] [PubMed] [Google Scholar]
- 25.Keegan AD, Nelms K, White M, et al. An IL-4 receptor region containing an insulin receptor motif is important for IL-4 mediated IRS-1 phosphorylation and cell growth. Cell. 1994;76:811. doi: 10.1016/0092-8674(94)90356-5. [DOI] [PubMed] [Google Scholar]
- 26.Paz K, Hemi R, Leroith D, et al. A molecular basis for insulin resistence. J Biol Chem. 1997;272:29911. doi: 10.1074/jbc.272.47.29911. [DOI] [PubMed] [Google Scholar]
- 27.Wang H, Zamorano J, Keegan A. A role for the insulin-interleukin (IL) -4 receptor motif of the IL-4 receptor α-chain in regulating activation of the insulin receptor substrate 2 and signal transducer and activator of transcription 6 pathways. J Biol Chem. 1998;273:9898. doi: 10.1074/jbc.273.16.9898. [DOI] [PubMed] [Google Scholar]
- 28.Curiel R, Lahesmaa R, Subleski J, et al. Identification of a Stat-6-responsive element in the promotor of the human interleukin-4 gene. Eur J Immunol. 1997;27:1982. doi: 10.1002/eji.1830270823. [DOI] [PubMed] [Google Scholar]
- 29.Mitsuyasu H, Izuhara K, Mao XQ, et al. Ile50Val variant of IL4R alpha upregulates IgE synthesis and associates with atopic asthma. Nature Genet. 1998;19:119. doi: 10.1038/472. [DOI] [PubMed] [Google Scholar]