Abstract
When T effector cells meet antigen-bearing target cells, there is a specific accumulation of T-cell receptors, co-receptors and structural proteins at the point of cell–cell contact. Ly49 inhibitory receptors bind to murine major histocompatibility complex (MHC) class I molecules and prevent natural killer-(NK) cell cytotoxicity. In this study we have tested whether inhibitory receptors accumulate at the point of cell–cell contact when NK cells encounter target cells bearing MHC class I ligands for those inhibitory receptors. We have used RNK-16 effector cells that express Ly49A receptors and have found that there was a specific accumulation of Ly49A receptors at the point of NK cell–target cell contact when the target cells expressed H-2Dd. We also observed that engagement of Ly49A on NK cells resulted in an altered redistribution of potential triggering receptors CD2 and NKR-P1. These data indicate that inhibitory receptors, like activating receptors, may specifically aggregate at the point of cell–cell contact which may be necessary for them to mediate their full inhibitory effect.
INTRODUCTION
Natural killer (NK) cells are large granular lymphocytes that can kill tumour and virus-infected target cells in what has been described as a non-major histocompatibility complex-(MHC) restricted manner.1 The ability of NK cells to kill target cells is believed to be determined by both positive (activating) and negative (inhibitory) signals.2–4 Evidence suggests that there are several activation and/or adhesion receptors that can be involved in NK-cell recognition and lysis of different target cells. Which specific activating receptors are required probably depends on which particular target cell is encountered. Several putative activation receptors, such as CD2, NKR-P1, and FcRγIII, have all been proposed to be involved in NK cell recognition of target cells.
Extensive families of inhibitory receptors have been found on mouse, rat and human NK cells.5,6 Inhibitory receptors belonging to the murine Ly49 receptor family have been shown to transduce a negative signal into NK cells when engaging MHC class I ligands on target cells and thereby prevent killing of tumour targets expressing the corresponding ligands for the receptor.7–9 Ly49A binds specifically to H-2Dd and H-2Dk MHC class I molecules on target cells and inhibits lysis of cells expressing these MHC class I ligands.7,10,11
Although many details remain unclear, the general picture that has emerged suggests that when an NK cell encounters a target cell there is an initial activation by triggering receptors that leads to Ca2+ mobilization and activation of various kinases.12–15 These kinases will activate a series of signalling events that eventually lead to a co-ordinate repositioning of the Golgi apparatus (GA) and microtubule-organizing centre (MTOC) inside the NK cell towards the target cell, resulting finally in a polarized secretion of cytotoxic granules.16,17 The release of the granule contents, including perforin and various granzymes, leads to death of the target cell. The inhibitory receptors of the Ly49, CD94 and KIR families recognizing MHC class I molecules on target cells recruit specific phosphatases, notably SHP1, and prevent the lytic process.18–20
In addition to the rearrangement of the MTOC and GA, there is an initial accumulation of specific activating receptors and structural proteins at the point of cell–cell contact.21 When cytotoxic T lymphocytes (CTL) recognize target cells, the T-cell receptor (TCR) and CD8 co-receptor accumulate at the point of contact between the CTL and the target cell.17 Secretory granules containing lytic proteins also reorient within the CTL towards the cell–cell contact area.17,22 In the case of T helper cells encountering an antigen-pulsed, antigen-presenting cell (APC), the TCR, CD4 and lymphocyte function-associated antigen-1 (LFA-1) all aggregate at the point of T-cell–APC contact.16 In this case cell differentiation rather than cell killing is involved, however, intracellular rearrangements such as a rapid MTOC/GA reorientation and talin redistribution appear to be similar to those observed in CTL.
Many inhibitory receptors have been identified in the past several years, yet nothing is known about how they are distributed during cell–cell interactions and how they may alter the accumulation of other receptors and proteins. Although triggering receptors have been demonstrated to accumulate to the point of cell–cell contact, there is no a priori reason that inhibitory receptors must behave in the same manner. In this study we addressed these issues by examining the distribution of murine Ly49A receptors during NK cell–target cell interactions. We also studied the localization of potential triggering receptors CD2 and NKR-P1 on NK cells when bound to susceptible target cells compared with resistant target cells expressing H-2Dd. Our findings indicate that Ly49A inhibitory receptors localize to the cell–cell contact point between NK cells and target cells expressing the MHC class I ligand for Ly49A, H-2Dd. Furthermore, our data suggest that accumulation of Ly49A alters the redistribution of triggering receptors CD2 and NKR-P1 upon NK-cell interaction with resistant target cells compared to susceptible target cells.
MATERIALS AND METHODS
Cell culture and cell lines
The following cells were used in these experiments: the RNK-16 49·9 rat NK leukaemia (referred to in this paper as RNK-16 49A) and the YB2/0 (YB) and YB2/0-Dd (YB-Dd) rat B-cell lines have been previously described.20 The cells were cultured in RPMI-1640 glutamax (Gibco) supplemented with 50×10−6 m 2-mercaptoethanol (2-ME), 10 U/ml penicillin, 10 μg/ml streptomycin and 10% fetal calf serum (FCS). The transfectants were maintained in 1 mg/ml G418 for selection purposes. All cells were mycoplasma free. EL4KK is an Ly49A-expressing variant of EL4. EL4-Dd is a stable H-2Dd transfectant of EL4.23 EL4KK, EL4 and EL4-Dd cells were cultured in RPMI-1640 medium supplemented with 10 U/ml penicillin, 10 μg/ml streptomycin, 0·15% sodium bicarbonate, 2 mm l-glutamine and 5% FCS in 5% CO2 at 37°.
Antibodies
A1 (anti-Ly49A) antibodies from hybridoma supernatants were affinity purified over a protein G column. The following fluorescein isothiocyanate (FITC) -conjugated antibodies were used: MRC OX-34 (anti-CD2; Nordic Biosite, Täby, Sweden), 10/78 (anti-NKR-P1; PharMingen, San Diego, CA) and goat anti-mouse immunoglobulin (IgG+IgM) antisera (Caltag, Burlingame, CA).
Immunofluorescence microscopy
To distinguish target cells from RNK-16 49A or EL4KK cells, 500 000 target cells were first labelled with biotin (300 μg/ml) in 100 μl phosphate-buffered saline (PBS) for 25 min at room temperature, extensively washed and labelled with StreptaLite™ Cascade Blue© (Molecular Probes, Leiden, the Netherlands) for 30 min at 4°. Cells were then washed and used as target cells in subsequent cytotoxicity assays or cell–cell conjugation experiments. In the conjugation experiments NK cells and tumour target cells were mixed at a ratio of 1:1 and subjected to low speed centrifugation (100 g, 5 min) in order to promote conjugation. Cells were gently resuspended and allowed to settle on to poly l-lysine-coated glass slides. Cells were incubated together for the indicated time periods at 37° in a humidified 5% CO2 atmosphere. Cells were subsequently fixed in acetone for 10 min at 4° or fixed in 2% paraformaldehyde/PBS for 20 min at 4°, washed and labelled with primary A1 mAb (anti-Ly49A) followed by FITC-conjugated goat anti-mouse antisera, or FITC-conjugated anti-CD2 or FITC-conjugated anti-NKR-P1. After washing, the cells were mounted in p-phenylenediamine (PPD)/glycerol. All slides in the experiments were coded in a blinded manner and analysed under an immunofluorescence microscope as follows. The slides were searched for target cells (blue colour) that were bound to an effector cell (non-blue cell). The morphology of the cell couple was checked under phase contrast and finally the expression and distribution of the cell surface receptors (green colour) was analysed. Cell couples that met all criteria as acceptable conjugates were scored for distribution of the FITC label as aggregated or non-aggregated. Digital pictures from the conjugation experiments were taken using a Zeiss Axiophot universal microscope connected to a Hamamatsu 3CCD C5810 colour camera. Appropriate filters for immunofluorescence analysis of labelled conjugates were used and images were aquired using associated software and imported into Adobe Photoshop™.
Chromium release assays
Chromium release assays were performed as previously described.24 YB and YB-Dd target cells were first surface biotinylated as described above, and labelled with 100 μCi of Na251CrO4 (Amersham, Bucks, UK) for 1 hr and washed before their use as targets in subsequent cytotoxicity assays. Target cells were then added to the effector cells in triplicate wells of U-bottomed 96-well microtitre plates in a final volume of 200 μl. After 4 hr of incubation 100 μl of the supernatant was harvested and its radioactive content was assayed in a gamma-counter. The mean percentage specific lysis of triplicate wells was calculated using the following formula: % specific lysis=[(experimental release−spontaneous release)/ (maximum release−spontaneous release)]×100.
Statistics
Statistical comparisons were done using Fisher’s exact test. P > 0·05 was considered not statistically significant (NS).
RESULTS
Accumulation of Ly49A at cell–cell interface when target cells express H-2Dd
Receptor accumulation to the cell–cell contact area has been demonstrated for activating receptors.16,17 As a first approach to test whether inhibitory receptors aggregate at the point of cell–cell contact with target cells that express ligands that can engage these receptors, we used a model system using cells that expressed the Ly49A receptor (EL4KK) together with tumour ‘target’ cells that did or did not express the Ly49A MHC class I ligand H-2Dd (EL4-Dd and EL4, respectively).
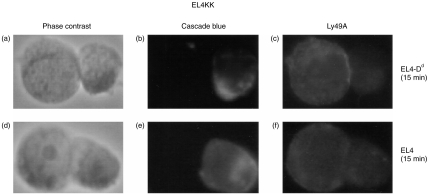
In order to determine if Ly49A receptor could redistribute on EL4KK in the presence of H-2Dd MHC molecules on the target cells, EL4 or EL4-Dd tumour cells were mixed with EL4KK cells at a 1:1 ratio and subjected to low speed centrifugation to promote conjugation. Cells were then gently resuspended before being allowed to settle onto glass slides. To make it possible to distinguish targets from EL4KK cells during analysis, EL4 and EL4-Dd tumour cells were surface biotinylated and labelled with StreptaLite™-Cascade Blue© prior to conjugation and subsequent staining procedures. There was considered to be specific aggregation at the point of cell–cell contact if the intensity of anti-Ly49A staining was much brighter than the parts of the Ly49A+ cell (EL4KK cells) not in contact with the target cell. Figure 1 shows typical examples of aggregated and non-aggregated Ly49A receptors.
Figure 1.
Ly49A accumulates at cell–cell contact point on EL4KK cells. EL4KK cells were incubated for 15 min with EL4-Dd (a–c) or EL4 cells (d–f). The EL4KK-target conjugates were then acetone fixed and stained for Ly49A (c,f). (a,d) and (b,e) show phase contrast images and Cascade Blue© staining on target cells, respectively.
Figure 1(a)–(c) show an EL4KK–EL4-Dd conjugate demonstrating increased Ly49A aggregation at the contact zone between EL4KK and EL4-Dd. When H-2Dd was absent on the target cell there was no aggregation of Ly49A (Fig. 1d–f) and the staining was evenly distributed around the EL4KK cells. The results of Ly49A receptor redistribution on all EL4KK–target conjugates are presented in Table 1. There was a significant difference in Ly49A staining on EL4KK cells conjugated to EL4-Dd cells expressing the ligand after 15 min (EL4-Dd, 43% and EL4, 25%; P < 0·001), but not after 5 min of incubation (EL4-Dd, 18% and EL4, 14%; P > 0·05).
Table 1.
Localization of Ly49A on EL4KK–target cell conjugates
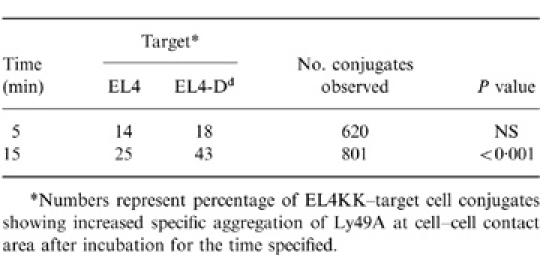
*Numbers represent percentage of EL4KK–target cell conjugates showing increased specific aggregation of Ly49A at cell-cell contact area after incubation for the time specified.
To investigate Ly49A receptor redistribution in a functionally active cell system, we used the Ly49A transfected rat NK-cell leukaemia RNK-16 (RNK-16 49A), together with YB (a susceptible rat B-cell line) or YB-Dd (H-2Dd-transfected YB). These Ly49A-transfected RNK-16 cells have been shown to be unable to kill targets expressing H-2Dd due to the expression of Ly49A.20 However, to rule out the possibility that the biotinylation and labelling procedure might interfere with target cell recognition by the RNK-16 49A cells, cytotoxicity assays were performed using surface biotinylated and labelled YB or YB-Dd cells as targets. This surface labelling treatment did not affect target recognition since YB cells were killed (34% at 60:1 E : T ratio), whereas expression of H-2Dd MHC molecules completely inhibited killing of the YB-Dd cells by RNK-16 49A cells (Fig. 2).
Figure 2.
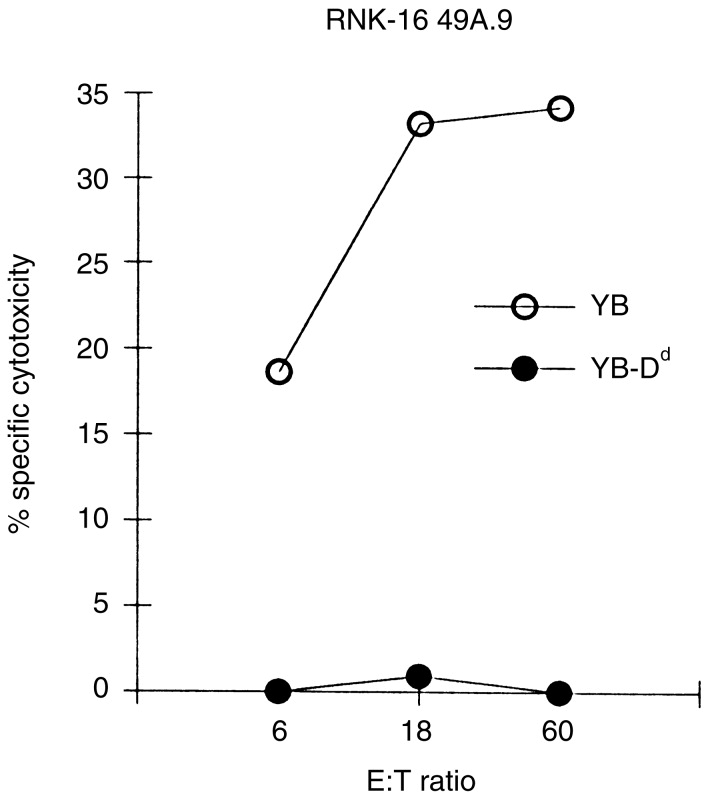
Prelabelling of target cells with Cascade Blue© does not alter NK cell recognition. RNK-16 49A effector cells were assayed for their ability to lyse YB or YB-Dd tumour target cells. The target cells were surface biotinylated and labelled with Cascade Blue© prior to use in 4-hr 51Cr-release assays. The results are representative of three independent experiments.
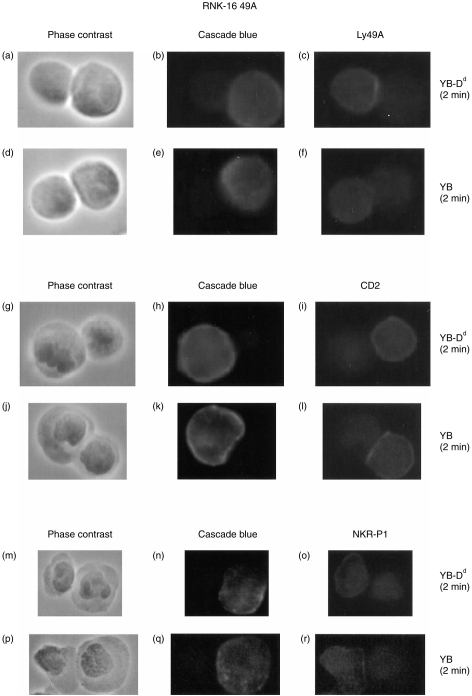
Next we tested these RNK-16 49A cells to see whether Ly49A would redistribute to the point of cell–cell contact between NK cells and H-2Dd-expressing target cells. Analysis of effector–target conjugates using RNK-16 49A cells and YB or YB-Dd cells as targets showed that at the 2 min time-point the Ly49A receptor had already redistributed to the contact area between effector and H-2Dd targets (Table 2). We found significantly more aggregation in the RNK-YB-Dd conjugates after 2 min (33%), compared to that seen with the YB target cells (9%), P < 0·001 (Table 2 and Fig. 3a–f). After 15 min we also found a significant difference between the two types of target cells used in the binding of RNK-16 49A cells. Here we observed specific localization in 45% of the effector–YB-Dd conjugates, compared to 30% seen with the YB target cells (P < 0·01). These data differed slightly from the data obtained in the EL4KK cell system, where after 5 min of incubation no such specific accumulation of Ly49A could be detected (Table 1). These findings suggested that in a functionally active cytotoxic NK-cell system, redistribution of inhibitory receptors may be faster when binding to, and preventing killing of H-2Dd expressing targets. The proportion of cell–cell doublets that were scored positive for Ly49A accumulation on the effector cells increased with both target cell types over time (9–30%, YB and 33–45%, YB-Dd). Statistical analysis comparing the cell types at each individual time-point were found to be significant in both cases (2 min, P < 0·001 and 15 min, P < 0·01). These observations indicated that Ly49A inhibitory receptors specifically redistributed to the cell–cell contact area on RNK-16 49A and EL4KK cells upon binding target cells expressing H-2Dd MHC class I molecules.
Table 2.
Localization of surface receptors on RNK-16 49A–target conjugates
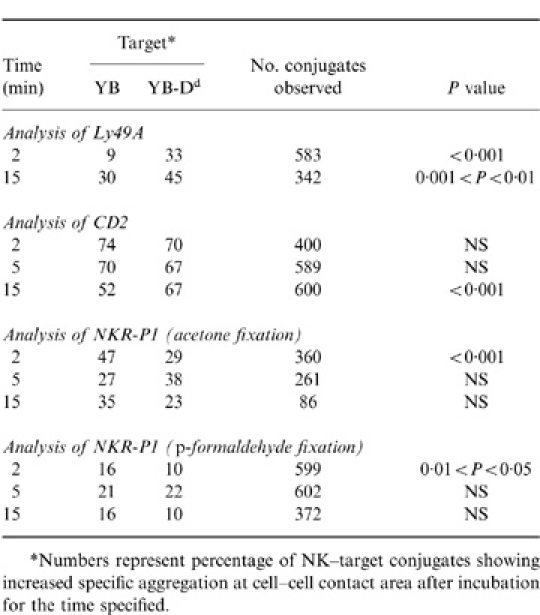
*Numbers represent percentage of NK–target conjugates showing increased specific aggregation at cell-cell contact area after incubation for the time specified.
Figure 3.
Analysis of cell surface receptors on RNK-16 49A cells. RNK-16 49A cells were incubated for 2 min with YB-Dd (a–c), (g–i) and (m–o) or with YB (d–f), (j–l) and (p–r). The effector–target conjugates were then fixed in acetone (a–f) or in paraformaldehyde (g–r), and stained for Ly49A (c,f), CD2 (i,l) or NKR-P1 (o,r). (a, d, g, j, m and p) show phase contrast images of effector–target conjugates, and (b, e, h, k, n and q) show Cascade Blue© staining on target cells.
Analysis of CD2 and NKR-P1 on RNK-16 conjugates
Since Ly49A receptor distribution was different for resistant and susceptible target cells, we addressed the question whether Ly49A could influence the redistribution of potential triggering receptors, CD2 and NKR-P1, on the surface on RNK-16 49A cells. Initially we observed a high proportion (67–74%) of effector–target conjugates that had aggregated CD2 at the site of cell–cell contact, consistent with CD2 being an activation receptor for RNK-16 cells.
Analysis of RNK-16 49A–target cell conjugates for the CD2 receptor (Table 2, Fig. 3g–i) showed no target cell-specific correlation in the redistribution of this molecule at the first two time-points (2 min, 5 min). However, after 15 min, a significant difference in the number of effector–target conjugates scored positive for CD2 aggregation was found (YB-Dd, 67% and YB, 52%; P < 0·001). The amount of CD2 aggregation seen with YB-Dd was around 70% after 2 min of incubation and did not change over time, whereas the proportion of effector–YB conjugates that had CD2 aggregated decreased significantly between the 5 min (70%) and 15 min (52%) time-points. Figure 3 shows an RNK-16 49A cell with increased aggregation of CD2 (Fig. 3j–l) as well as an effector–target conjugate demonstrating no specific localization at the cell–cell interface (Fig. 3g–i).
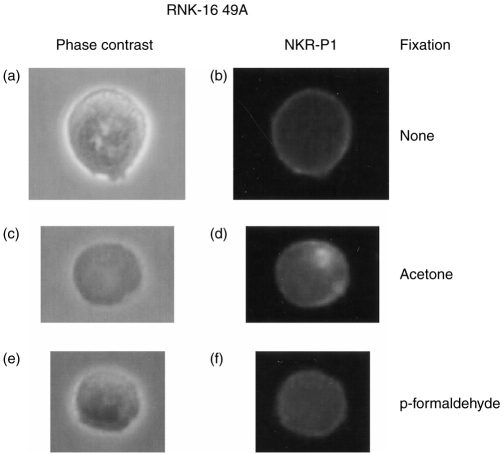
NKR-P1 accumulation at the cell–cell interface was observed at the 2 min time-point on RNK-16 49A cells when using acetone (YB, 47% and YB-Dd, 29%; P < 0·001) as fixation reagent. Incubation for 5 or 15 min did not show any significant differences in receptor localization (Table 2). Interestingly, we also noticed a difference in the intracellular staining pattern with NKR-P1 which was not observed with any of the other cell surface molecules tested. Acetone fixation revealed small ‘clouds’ of NKR-P1 inside almost every cell (Fig. 4c,d), whereas when using no fixation (Fig. 4a,b) or paraformaldehyde (Fig. 4e,f), no such ‘clouds’ could be demonstrated. NKR-P1 staining of RNK-16 49A cells permeabilized with Triton-X-100 resulted in a similar intracellular ‘cloud’ staining pattern (data not shown). This suggested that NKR-P1 is sequestered inside RNK-16 49A cells and that this molecule localizes to specific regions inside the effector cells, although it cannot be ruled out that this antibody cross-reacts with an epitope revealed by acetone fixation or Triton permeabilization. A similar intracellular pattern of expression has been observed for CD86.25 To rule out that bright intracellular staining influenced analysis of receptor cell surface distribution, we analysed NKR-P1 after paraformaldehyde fixation. In general, less aggregation was observed when using paraformaldehyde fixation (10–22%) when compared to acetone (23–47%), which could reflect the brighter staining we found to be associated with the latter method. However, similar results with regard to NKR-P1 expression were found using paraformaldehyde as fixation method, where significant accumulation of NKR-P1 was detected with YB target cells (YB, 16% and YB-Dd, 10%; P < 0·05) at the 2 min time-point (Table 2 and Fig. 3m–r).
Figure 4.
NKR-P1 accumulates inside RNK-16 49A effector cells. Surface- and intracellular staining of NKR-P1 in non-fixed (b), acetone-fixed (d), and paraformaldehyde fixed (f) RNK-16 49A cells. (a, c, and e) show phase contrast images of the antibody-labelled effector cells.
DISCUSSION
In this paper we examined the ability of Ly49 inhibitory receptors to alter the distribution of cell surface receptors on NK cells at various time-points following binding to tumour target cells that did or did not express the MHC ligand for the inhibitory receptors. This study included analysis of Ly49A inhibitory receptors as well as localization of potential triggering receptors NKR-P1 and CD2.
To investigate Ly49 receptor distribution on NK cells we used a cell model system consisting of a rat NK-cell line transfected with Ly49A (RNK-16 49A) as effector cells, and a rat B-cell line (YB) as target cells. This allowed us to examine the surface distribution of Ly49A inhibitory receptors on RNK-16 49A cells when conjugated to resistant H-2Dd-transfected target cells (YB-Dd) as well as effectors bound to susceptible targets (YB) in the absence of other endogenous murine molecules. The RNK-16 49A system avoids the complexity of cells expressing multiple inhibitory and/or activating Ly49 receptors for H-2Dd, such as Ly49G2 and Ly49D. We demonstrated an increased accumulation of Ly49A receptor molecules on rat RNK-16 49A cells conjugated to the H-2Dd-transfected rat B-cell line YB-Dd, but not with the H-2Dd-negative target YB. We also observed an increased redistribution of Ly49A on EL4KK tumour cells after conjugation to EL4-Dd cells compared to non-transfected EL4 cells. These data suggest that Ly49A localizes to the cell–cell contact point after binding target cells expressing its H-2Dd MHC ligand. Specific accumulation of the Ly49A receptor was observed after only 2 min on RNK-16 49A cells, however, specific Ly49A aggregation on EL4KK cells was not observed until 15 min of incubation with EL4-Dd. This may reflect the fact that binding of significant amounts of inhibitory receptors to H-2Dd MHC ligands may take slightly longer in the EL4 cell system compared to the RNK-16 49A–target cell system, where an active redistribution of the Ly49A receptor may have a functional relevance for the recognition, and the response to, H-2Dd-expressing target cells. It is possible that engagement of Ly49A with its H-2Dd ligand prevented binding of anti-Ly49A monoclonal antibody to the receptor and led to an underestimation of the amount of Ly49A on effector cells that accumulated upon interaction with H-2Dd-expressing target cells. However, specific aggregation of Ly49A was observed with both RNK-16 49A and EL4KK cells.
Cross-linking of NKR-P1 leads to cell proliferation and interferon-γ release,26 and NKR-P1 has been demonstrated to be required for killing of some tumour targets by RNK-16 cells.27 Significant accumulation at the binding-site with YB targets was observed for the NKR-P1 receptor at the 2 min time-point in effector cells fixed either in acetone or in paraformaldehyde. Since this receptor may have a role in the triggering of early activating signals in NK cells,27 it is possible that it acts early in the cell–cell encounter. Therefore these observations may simply reflect the kinetics of a molecule that mediate most of its function at a time-point where the effector first meets its target. We also found that NKR-P1 appeared to be localized to specific regions inside RNK-16 49A cells and that these patches mostly were restricted to one part of the cytosol (Fig. 4). Specific localization of CD86 to granules inside cells has been proposed to be important for regulating CD86 expression and function.25
The involvement of CD2 in cell–cell adhesion as well as in signalling has been extensively studied.28 Cross-linking of CD2 on RNK-16 cells has been shown to induce intracellular Ca2+ release and phosphatidylinositol signalling and has also been suggested as a possible NK-cell-activating receptor.29 We found that a rather high percentage (67–74%) of the RNK-16 49A cells had accumulated CD2 to the point of cell–cell contact at the 2 and 5 min time-points, but no significant differences between the two targets could be demonstrated during the first 5 min of incubation. At the 15 min time-point, however, the drop in the number of effector–YB conjugates with specific CD2 accumulation (down to 52%) resulted in a significant difference when compared to H-2Dd-expressing targets (67%). The reasons for this could be due to a rather rapid delocalization of CD2 on the NK cell binding to a YB target cell, observed at or after a time-point where the NK cell prepares to detach from the YB target, or alternatively, a shift into subsequent stages of target lysis where the early CD2–target cell interactions may be no longer necessary. A significantly higher proportion of CD2 accumulation upon engagement of the Ly49A receptor with H-2Dd on YB-Dd cells at the 15 min time-point, relative to that observed with YB cells, may be due to the fact that Ly49A prevented delocalization of CD2 at the contact point, which may be important for preventing cytotoxicity, or that it stopped activation pathways prior to CD2 disengagement. Thus the effect of inhibition of NK-cell cytotoxicity by Ly49 receptors may prevent the redistribution of cell surface molecules.
Interestingly, we could detect intercellular staining of Ly49A with EL4KK–EL4, increasing over time from 14% to 25%, and in RNK-16 49A effector–YB target conjugates increasing from 9% after 2 min of incubation reaching 30% after 15 min. This non-H-2Dd-associated staining could result from several causes, including non-specific binding of antibodies associated with the intercellular structure of the cell–cell contact area or a possible co-localization of Ly49A with some other molecule or molecules normally expressed on the cell surface of NK or EL4KK cells during conjugate binding. Since it is likely that the level of background staining (non-H-2Dd-specific) is similar for each type of target cell, an observed difference between them should be due to specific Ly49A accumulation related to H-2Dd class I expression on the target cells. It is also possible that accumulation of Ly49A receptors may result from the presence of activating receptors or adhesion molecules colocalizing, through low-affinity binding, with the Ly49A inhibitory receptor. These activating receptors and their associated kinases may be responsible for phosphorylating the cytoplasmic tail of the Ly49A inhibitory receptor following its binding to H-2Dd class I ligand on the target cell.
Accumulation/cross-linking of Ly49 receptors at the effector–target interface through interaction with H-2Dd molecules may serve to concentrate phosphatases near the cell contact area leading to rapid dephosphorylation of early activating signals that have been initiated by recognition of the target cell. The rapid recruitment of intracellular phosphatases such as SHP1 and SHP2 by the Ly49A receptor in this way could quickly prevent an NK cell from entering an activated state by initiating dephosphorylation events and terminating the lytic process. Apart from being responsible for directly abrogating early activating signals in the encounter with resistant targets, cross-linked Ly49A receptors or Ly49A receptor complexes could co-operate in, or allow other pathways to proceed, such as cytoskeletal changes necessary to allow detachment from the target, internalization of receptors from the surface, or prevention of organelle rearrangements associated with the lytic process. In summary, our data indicate that inhibitory receptors, like activating receptors, may specifically aggregate at the point of cell–cell contact which may be necessary for them to mediate their full inhibitory effect.
Acknowledgments
This work was supported by grants from the Swedish Medical Research Council, the Swedish Cancer Society, and the Umeå Cancer Society.
Abbreviations
- GA
Golgi apparatus
- MTOC
microtubule organizing centre
REFERENCES
- 1.Trinchieri G. Biology of natural killer cells. Adv Immunol. 1989;47:187. doi: 10.1016/S0065-2776(08)60664-1. [DOI] [PMC free article] [PubMed] [Google Scholar]
- 2.Gumperz JE, Parham P. The enigma of the natural killer cell. Nature. 1995;378:245. doi: 10.1038/378245a0. [DOI] [PubMed] [Google Scholar]
- 3.Lanier LL. Natural killer cell receptors and MHC class I interactions. Curr Opin Immunol. 1997;9:126. doi: 10.1016/s0952-7915(97)80169-0. [DOI] [PubMed] [Google Scholar]
- 4.Yokoyama WM. Natural killer cell receptors. Curr Opin Immunol. 1998;10:298. doi: 10.1016/s0952-7915(98)80168-4. [DOI] [PubMed] [Google Scholar]
- 5.Yokoyama WM. Natural killer cell receptors. Curr Opin Immunol. 1995;7:110. doi: 10.1016/0952-7915(95)80036-0. [DOI] [PubMed] [Google Scholar]
- 6.Takei F, Brennan J, Mager DL. The Ly-49 family: genes, proteins and recognition of class I MHC. Immunol Rev. 1997;155:67. doi: 10.1111/j.1600-065x.1997.tb00940.x. [DOI] [PubMed] [Google Scholar]
- 7.Karlhofer FM, Ribaudo RK, Yokoyama WM. MHC class I alloantigen specificity of Ly-49+ IL-2-activated natural killer cells. Nature. 1992;358:66. doi: 10.1038/358066a0. [DOI] [PubMed] [Google Scholar]
- 8.Yu YY, George T, Dorfman JR, Roland J, Kumar V, Bennett M. The role of Ly49A and 5E6 (Ly49C) molecules in hybrid resistance mediated by murine natural killer cells against normal T cell blasts. Immunity. 1996;4:67. doi: 10.1016/s1074-7613(00)80299-x. [DOI] [PubMed] [Google Scholar]
- 9.Mason LH, Ortaldo JR, Young HA, Kumar V, Bennett M, Anderson SK. Cloning and functional characteristics of murine large granular lymphocyte-1: a member of the Ly-49 gene family (Ly-49G2) J Exp Med. 1995;182:293. doi: 10.1084/jem.182.2.293. [DOI] [PMC free article] [PubMed] [Google Scholar]
- 10.Kane KP. Ly-49 mediates EL4 lymphoma adhesion to isolated class I major histocompatibility complex molecules. J Exp Med. 1994;179:1011. doi: 10.1084/jem.179.3.1011. [DOI] [PMC free article] [PubMed] [Google Scholar]
- 11.Daniels BF, Karlhofer FM, Seaman WE, Yokoyama WM. A natural killer cell receptor specific for a major histocompatibility complex class I molecule. J Exp Med. 1994;180:687. doi: 10.1084/jem.180.2.687. [DOI] [PMC free article] [PubMed] [Google Scholar]
- 12.Windebank KP, Abraham RT, Powis G, Olsen RA, Barna TJ, Leibson PJ. Signal transduction during human natural killer cell activation: inositol phosphate generation and regulation by cyclic AMP. J Immunol. 1988;141:3951. [PubMed] [Google Scholar]
- 13.Einspahr KJ, Abraham RT, Binstadt BA, Uehara Y, Leibson PJ. Tyrosine phosphorylation provides an early and requisite signal for the activation of natural killer cell cytotoxic function. Proc Natl Acad Sci USA. 1991;88:6279. doi: 10.1073/pnas.88.14.6279. [DOI] [PMC free article] [PubMed] [Google Scholar]
- 14.Biondo A, Paganin C, Rossi V, et al. Expression of lineage-restrticted protein tyrosine kinase genes in human natural killer cells. Eur J Immunol. 1991;21:843. doi: 10.1002/eji.1830210348. [DOI] [PubMed] [Google Scholar]
- 15.Cone JC, Lu Y, Trevillyan JM, Björndahl JM, Phillips CA. Association of the p56lck tyrosine kinase with the FcgammaIIIA/CD16 complex in human natural killer cells. Eur J Immunol. 1993;23:2488. doi: 10.1002/eji.1830231017. [DOI] [PubMed] [Google Scholar]
- 16.Kupfer A, Singer SJ. Cell biology of cytotoxic and helper T cell functions: immunofluorescence microscopic studies of single cells and cell couples. Annu Rev Immunol. 1989;7:309. doi: 10.1146/annurev.iy.07.040189.001521. [DOI] [PubMed] [Google Scholar]
- 17.Berke G. The binding and lysis of target cells by cytotoxic lymphocytes: molecular and cellular aspects. Annu Rev Immunol. 1994;12:735. doi: 10.1146/annurev.iy.12.040194.003511. [DOI] [PubMed] [Google Scholar]
- 18.Binstadt BA, Brumbaugh KM, Dick CJ, et al. Sequential involvement of Lck and SHP-1 with MHC-recognizing receptors on NK cells inhibits FcR-initiated tyrosine kinase activation. Immunity. 1996;5:629. doi: 10.1016/s1074-7613(00)80276-9. [DOI] [PubMed] [Google Scholar]
- 19.Olcese L, Lang P, Vely F, et al. Human and mouse killer-cell inhibitory receptors recruit PTP1C and PTP1D protein tyrosine phosphatases. J Immunol. 1996;156:4531. [PubMed] [Google Scholar]
- 20.Nakamura MC, Niemi EC, Fisher MJ, Shultz LD, Seaman WE, Ryan JC. Mouse Ly-49A interrupts early signaling events in natural killer cell cytotoxicity and functionally associates with the SHP-1 tyrosine phosphatase. J Exp Med. 1997;185:673. doi: 10.1084/jem.185.4.673. [DOI] [PMC free article] [PubMed] [Google Scholar]
- 21.Carpen O, Virtanen I, Lehto V-P, Saksela E. Polarization of NK cell cytoskeleton upon conjugation with sensitive target cells. J Immunol. 1983;131:2695. [PubMed] [Google Scholar]
- 22.Griffiths GM. The cell biology of CTL killing. Curr Opin Immunol. 1995;7:343. doi: 10.1016/0952-7915(95)80108-1. [DOI] [PubMed] [Google Scholar]
- 23.Glas R, Öhlén C, Höglund P, Kärre K. The CD8+ T cell repertoire in beta 2-microglobulin-deficient mice is biased towards reactivity against self-major histocompatibility class I. J Exp Med. 1994;179:661. doi: 10.1084/jem.179.2.661. [DOI] [PMC free article] [PubMed] [Google Scholar]
- 24.Sentman CL, Olsson MY, Salcedo M, Höglund P, Lendahl U, Kärre K. H-2 allele-specific protection from NK cell lysis in vitro for lymhoblasts but not tumor targets: protection mediated by a1/a2 domains. J Immunol. 1994;153:5482. [PubMed] [Google Scholar]
- 25.Smyth C, Logan G, Weinberger RP, Rowe PB, Alexander IE, Smythe JA. Identification of a dynamic intracellular reservoir of CD86 protein in peripheral blood monocytes that is not associated with the golgi complex. J Immunol. 1998;160:5390. [PubMed] [Google Scholar]
- 26.Arase H, Arase N, Saito T. Interferon gamma production by natural killer (NK) cells and NK1.1+ T cells upon NKR-P1 cross-linking. J Exp Med. 1996;183:2391. doi: 10.1084/jem.183.5.2391. [DOI] [PMC free article] [PubMed] [Google Scholar]
- 27.Ryan JC, Niemi EC, Nakamura MC, Seaman WE. NKR-P1 is a target-specific receptor that activates natural killer cell cytotoxicity. J Exp Med. 1995;181:1911. doi: 10.1084/jem.181.5.1911. [DOI] [PMC free article] [PubMed] [Google Scholar]
- 28.Davis SJ, Van Der Merwe PA. The structure and ligand interactions of CD2: implications for T-cell function. Immunol Today. 1996;17:177. doi: 10.1016/0167-5699(96)80617-7. [DOI] [PubMed] [Google Scholar]
- 29.Seaman WE, Eriksson E, Dobrow R, Imboden JB. Inositol trisphosphate is generated by a rat natural killer cell tumor in response to target cells or to crosslinked monoclonal antibody OX-34: possible signaling role for the OX-34 determinant during activation by target cells. Proc Natl Acad Sci USA. 1987;84:4239. doi: 10.1073/pnas.84.12.4239. [DOI] [PMC free article] [PubMed] [Google Scholar]


