Abstract
Oral administration of soluble protein antigen induces tolerance, while particulate antigens encountered in the intestine provoke active immunity. Although the events that lead to these distinct outcomes are not yet fully characterized, they may reflect differences at the antigen-presenting cell (APC) level. The role of dendritic cells (DC) in regulating responses at mucosal sites has remained largely undefined because of the low frequency of DC in mucosal-associated tissues. In this study we have used the growth factor Flt3-ligand (Flt3L) to expand DC populations in vivo, in combination with an adoptive transfer system, in order to track antigen-specific T cells during oral tolerance induction. We observed rapid T-cell activation, localized particularly in the mucosal tissues, within hours after feeding the soluble protein antigen, ovalbumin (OVA). The response was enhanced in Flt3L-treated mice, indicating an important role for DC during the inductive phase of tolerance.
INTRODUCTION
It is well established that oral administration of soluble protein antigen induces a state of systemic immunological hyporesponsiveness (oral tolerance), whereas live organisms and particulate antigens encountered in the gut provoke active local and systemic immune responses.1,2 The mucosal immune system has therefore developed sophisticated means for discriminating between pathogens and innocuous antigens, such as dietary proteins and commensal bacteria. However, the events that lead to active immunity, on the one hand, and profound tolerance, on the other, are not yet fully understood. As it has recently been suggested that oral tolerance may be exploited as a therapeutic approach for the treatment of several human autoimmune diseases,3,4 defining the cellular and molecular interactions involved in inducing this form of tolerance is clearly of great importance.
The outcome of an immune response can vary, depending on the type of antigen-presenting cells (APCs) involved during its initiation.5–8 We have recently demonstrated that in vivo administration of Flt3-ligand (Flt3L), a growth factor known to dramatically expand dendritic cell (DC) populations in a number of tissues including the gut,9,10 increases the level of systemic unresponsiveness observed after feeding the protein antigen ovalbumin (OVA).10 Although these findings indicate a critical role for DC:T-cell interactions following oral administration of protein antigen, little is known about where or when antigen is presented to T cells after entry via the oral route. Furthermore, the early inductive events that occur following feeding and ultimately promote tolerance remain uncharacterized. Here, we have utilized an adoptive transfer system developed by Kearney et al.11 in which OVA T-cell receptor (TCR) transgenic (Tg) T cells are transferred into unmanipulated syngeneic BALB/c recipients. Tg T cells can then be detected by flow cytometry using the anticlonotypic monoclonal antibody (mAb) KJ1-26. Using this approach, in combination with Flt3L treatment to expand DC populations in vivo, we tracked antigen-specific T cells in situ after feeding OVA. We report here the kinetics of T-cell reactivity during oral tolerance induction and assess the effect of elevated numbers of DC during the inductive response.
MATERIALS AND METHODS
Mice
Female BALB/c mice (6–10 weeks of age) were obtained from Taconic Laboratories (Germantown, NY) and maintained in a specific pathogen-free (SPF) facility at Immunex Corporation, in accordance with approved ethical guidelines. BALB/c DO11.10 OVA TCR Tg 12 were bred and maintained in the SPF facility at Immunex.
In vivo treatment of mice with Flt3L
Flt3L-treated mice were injected intraperitoneally (i.p.) once daily with purified Chinese hamster ovary (CHO)-derived human Flt3L (10 μg in 100 μl) for 10 days. Control mice received 100 μl of phosphate-buffered saline (PBS) i.p. for the same time-period. Flt3L was produced and purified at Immunex, as previously described.13
Adoptive transfer and feeding
BALB/c mice were treated daily with Flt3L or PBS for 8 days before and for 2 days after adoptive transfer of OVA TCR Tg T cells. Adoptive transfer was performed essentially as described previously.11 Briefly, lymphocytes were obtained from the axilliary, inguinal, popliteal and mesenteric lymph nodes and spleens of female DO11.10 mice, and single cell suspensions were prepared. Syngeneic female BALB/c recipient mice were then reconstituted intravenously (i.v.) with 2·5×106 clonotypic TCR+ (CD4+, KJ1-26+) Tg T cells. Two days after adoptive transfer, chimeric mice were fed a single dose of 0, 5 or 25 mg OVA (Fraction V; Sigma Chemical Co., St Louis, MO), in 0·2 ml of PBS, by gavage.
Assessment of tolerance in transfer mice
Seven days after adoptive transfer of OVA Tg T cells (i.e. 5 days after feeding OVA), mice were immunized subcutaneously (s.c.) in the footpad with 100 μg OVA in adjuvant (RIBI adjuvant system; RIBI Immunochemicals Research, Inc, Hamilton, MT). After an additional 4 days, draining popliteal lymph nodes were removed and cultured in RPMI medium supplemented with 10% fetal bovine serum (FBS; Gibco BRL, Gaithersburg, MD), penicillin/streptomycin and β-mercaptoethanol, in a humidified 6% CO2 incubator, at a density of 2×10⁵ cells/well for 48–96 hr. All cultures were performed in triplicate in 96-well flat bottomed plates in a total volume of 200 μl, either alone or in the presence of 1 mg/ml OVA. Proliferation was assessed by the addition of 1 μCi/well [3H]thymidine (Amersham, Little Chalfont, Bucks, UK) 18 hr before harvesting. The amount of radioactivity incorporated into DNA was measured using a Matrix-96 cell harvester (Inotech, Lansing, MI) and a direct β-counter (Packard, Meridian, CT). The data are reported as the mean counts per minute (c.p.m.)±1 standard error of the mean (SEM) of three individual mice/group. The Student’s t-test was used to compare data from different groups.
Cell isolation
Single cell suspensions were prepared from mesenteric lymph nodes (MLN), spleen, Peyer’s patches (PP) and peripheral (inguinal and popliteal) lymph nodes (PLN), of two to three mice per group, by teasing tissues apart in RPMI/10% FBS followed by passage through nylon mesh. Intestinal intraepithelial lymphocyte (IEL) cell suspensions were prepared from intestines opened longitudinally and cut into segments of ≈1 cm. Tissues were then incubated at 37° in 1 mm EDTA in Ca2+- and Mg2+-free Hank’s balanced salt solution (CMF HBSS; Gibco BRL), for three sequential 15-min incubations, to remove the epithelial layer. The resulting cell suspension was then washed in RPMI/10% FBS and passed over a prewet glass-wool column. Lamina propria lymphocytes (LPL) were isolated by further digestion of the denuded small intestine fragments with Type VIII collagenase (90 U/ml; Sigma) in RPMI/10% FBS, followed by passage over a glass-wool column.
Flow cytometric analysis of isolated cells
To determine the proportion of OVA-specific CD4+ Tg T cells expressing the clonotypic TCR in adoptive transfer recipients, isolated cells from two to three individual mice per group were stained with fluorescein isothiocyanate (FITC)-labelled anti-Tg TCR clonotype mAb KJ1-26 (2 μg/ml) and phycoerythrin (PE)-labelled anti-CD4 (5 μg/ml) for 30 min at 4° in 50 μl of blocking buffer containing 10 μg/ml anti-CD16 (Pharmingen Inc., San Diego, CA), 10% normal goat serum and 1% normal mouse serum (NMS). Between 30 000 and 60 000 lymphocytes were analysed per sample. To determine expression of CD69 and CD45RB on the Tg T-cell population, three-colour fluorescence-activated cell sorter (FACS) analysis was performed. Briefly, cells were incubated with FITC-KJ1-26/PE-CD4, as described above, together with 5 μg/ml biotinylated anti-CD69 or anti-CD45RB (Pharmingen) for 30 min at 4°. Cells were then washed twice with PBS/2% FBS and incubated with 10 μg/ml allophycocyanin (APC)-labelled streptavidin (Molecular Probes, Eugene, OR) for an additional 15 min. Samples were then washed three times, resuspended in PBS supplemented with 1% paraformaldehyde and stored at 4° until analysis on a FACScalibur flow cytometer (Becton-Dickinson, San Jose, CA). Data were analysed using Cellquest software (Becton Dickinson). Each experiment was performed a total of three or four times.
RESULTS
Localization of adoptively transferred OVA TCR Tg T cells in vivo
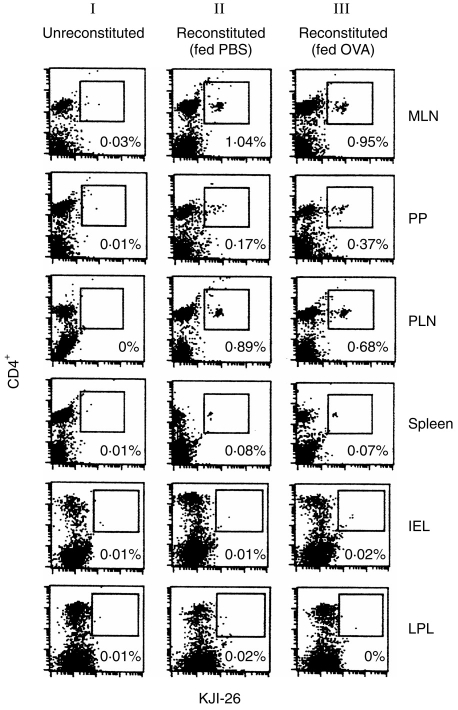
To first determine the distribution of OVA-specific CD4+ Tg T cells following their adoptive transfer into normal BALB/c recipients, we performed flow cytometric analysis on cells isolated from both peripheral lymphoid organs (spleens and PLN) and gut-associated lymphoid tissues (GALT), of three mice per group, using the anticlonotypic mAb KJ1-26. As shown in Fig. 1, on day 3 post-transfer, CD4+ KJ1-26+ Tg T cells could be readily detected in the MLN, PP and PLN of all groups of reconstituted mice (Fig. 1, column II). Tg cells were rare in the spleen and were often undetectable in the IEL and LPL compartments of transfer animals by FACS analysis (Fig. 1). The relative proportion of Tg cells in each tissue was similar in mice analysed 1 day after OVA feeding (Fig. 1, column III), although there was a small increase in Tg T-cell numbers in the PP compartment.
Figure 1.
Localization of adoptively transferred ovalbumin (OVA) T-cell receptor (TCR) transgenic (Tg) T cells in vivo. Chimeric BALB/c mice were generated by intravenous (i.v.) injection of 2·5×106 OVA-specific Tg T cells. Groups of three of these reconstituted mice were fed phosphate-buffered saline (PBS) or 25 mg OVA 2 days after adoptive transfer. Cells were isolated from the peripheral lymphoid organs and gut-associated lymphoid tissue (GALT) of normal, unreconstituted BALB/c mice (column I), reconstituted BALB/c mice fed PBS (column II) and reconstituted BALB/c mice fed 25 mg OVA (column III). Two-colour fluorescence-activated cell sorter (FACS) analysis was performed on day 3 post-transfer (day 1 postfeed), to identify the proportion of CD4+Tg T cells in each tissue, using fluorescein isothiocyanate (FITC)-labelled anti-Tg TCR clonotype monoclonal antibody (mAb) KJ1-26 and phycoerythrin (PE)-labelled CD4 mAb. Between 30 000 and 60 000 lymphocytes were analysed per sample. Data shown are representative of three individual mice per group. Similar results were achieved in four separate experiments. IEL, intraepithelial lymhocytes; LPL, lamina propria lymphocytes; MLN, mesenteric lymph nodes; PLN, popliteal lymph nodes; PP, Peyer’s patches.
Oral administration of OVA induces expansion of Tg T cells in GALT
10 and 14 have previously used the OVA-specific adoptive transfer system to study oral tolerance of T cells in a physiological manner. As shown in Fig. 2, cells from the popliteal lymph nodes of both PBS- and Flt3L-treated mice that were fed saline before immunization proliferated vigorously in response to OVA stimulation in vitro, whereas cells isolated from PBS- and Flt3L-treated mice fed 25 mg OVA showed significantly reduced proliferative responses. As we have described in detail previously,10 cells from Flt3L-treated mice fed OVA exhibited significantly decreased proliferation compared with cells from PBS-treated mice fed OVA (Fig. 2).
Figure 2.
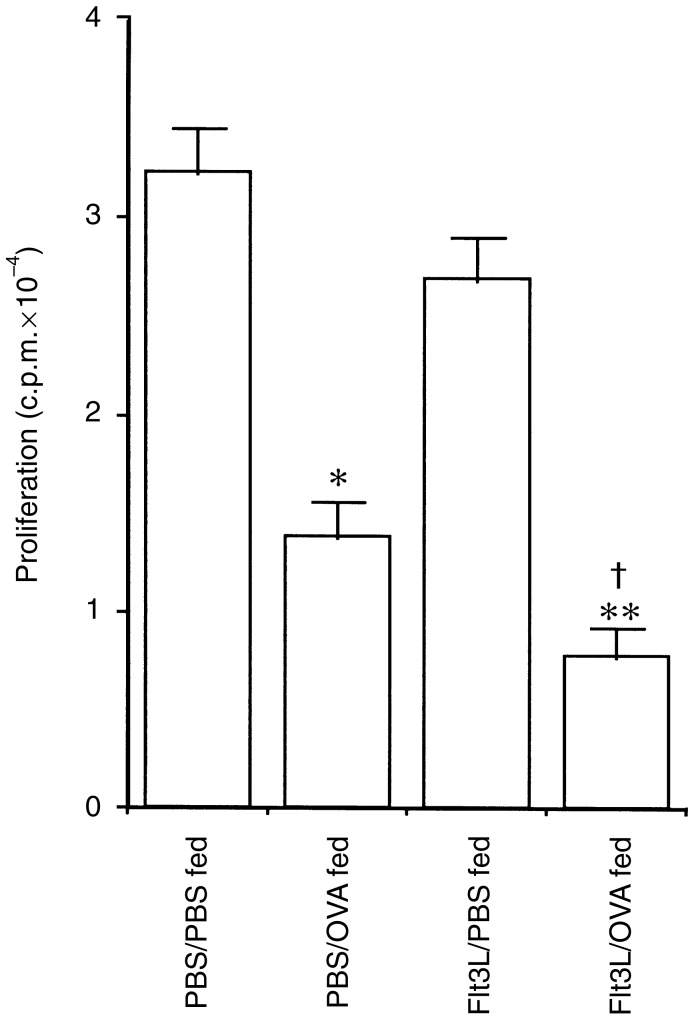
Functional tolerance of antigen (Ag)-specific T cells in Flt3-ligand (Flt3L)-treated adoptive transfer mice fed ovalbumin (OVA). Draining lymph node cells from adoptively transferred phosphate-buffered saline (PBS)- or Flt3L-treated mice were cultured with 1 mg/ml OVA and their proliferative capacity examined at 72 hr. PBS-treated mice fed 25 mg OVA had significantly reduced Ag-specific proliferative responses compared with PBS-treated mice fed PBS (*P < 0·005). Flt3L-treated mice fed OVA exhibited significantly reduced proliferative responses compared with PBS-treated mice fed either PBS (**P < 0·001) or OVA (†P < 0·05). The data are the mean±1 SEM of individual lymph node isolates from three mice per group and are representative of six experiments.
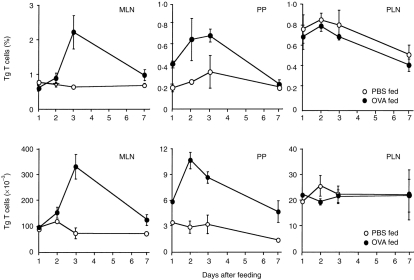
In this study, we were particularly interested in examining the events that occur immediately after antigen feeding and which lead to profound tolerance. We therefore proceeded to assess the effect of OVA feeding on the Tg population localized in the different lymphoid organs identified in Fig. 1. Cells were isolated from each of these tissues at various time-points during the 7 days after OVA feeding and were analysed by flow cytometry. In control mice fed PBS alone, the Tg T-cell population localized within each of the tissues remained relatively stable, with no significant difference in the percentage (Fig. 3, upper panel) or absolute numbers (Fig. 3, lower panel) of Tg cells detected during the time course examined. Conversely, Tg cells localized in the different lymphoid compartments showed differential responsiveness after OVA feeding. In the MLN, the percentage and absolute number of Tg T cells showed a marked increase 3 days after feeding OVA and a subsequent decline by day 7. Similarly, the population of OVA-specific Tg cells found in the PP also increased greatly during the first 3 days post-feeding and, again, had declined by the later time-point. In contrast, feeding OVA did not alter either the percentage or absolute number of Tg cells in the PLN. Furthermore, oral administration of this dose of OVA had no effect on the number of Tg cells observed in the spleen, IEL or LPL compartments of reconstituted mice at any time-point (days 1–7; data not shown).
Figure 3.
Antigen-specific transgenic (Tg) T cells expand in the gut-associated lymphoid tissue (GALT) but not the popliteal lymph nodes (PLN) of reconstituted mice fed ovalbumin (OVA). Mice were adoptively transferred with OVA-specific Tg T cells, as described in the legend to Fig. 1, and fed either phosphate-buffered saline (PBS) or 25 mg OVA 2 days later. Cells were isolated from the mesenteric lymph nodes (MLN), Peyer’s patches (PP) and PLN of three reconstituted mice per group, at different times postfeed, and fluorescence-activated cell sorter (FACS) analysis was performed to determine the percentage (upper panel) and absolute number (lower panel) of CD4+ KJ1-26+ Tg T cells. Results show the mean±1 SD from three individual mice per group and are representative of four experiments.
Expanding DC in vivo augments the antigen-induced expansion of T cells in GALT after feeding
In order to better understand the role of DC during oral tolerance induction, we utilized the OVA TCR Tg T-cell transfer system to examine the effect of increasing the number of DC on the antigen-specific T-cell response after feeding. Mice were treated with Flt3L or PBS for 8 days before and for 2 days after adoptive transfer of OVA TCR Tg T cells. Chimeric animals were then fed a single dose of 25 mg OVA or PBS on the final day of Flt3L treatment, when DC numbers are maximal.13
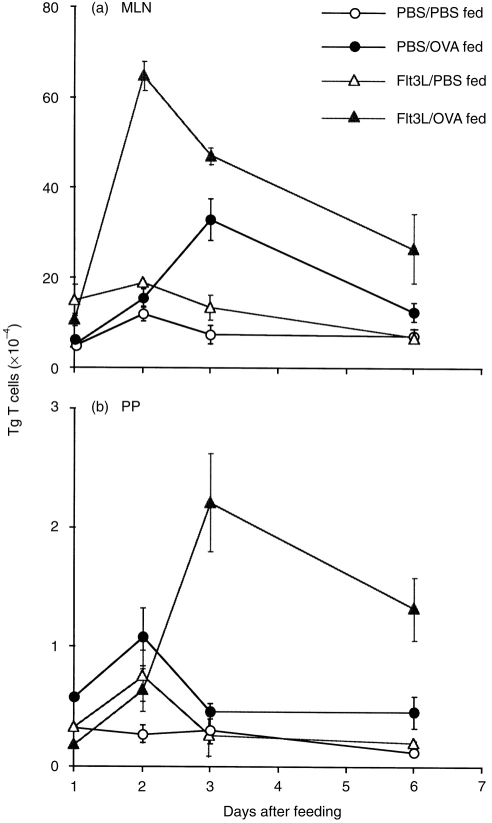
We again observed an increase in OVA-specific Tg T cells in both the PP and MLN of PBS-treated transfer mice after oral administration of OVA (Fig. 4a, 4b). Administering Flt3L to expand DC prior to feeding OVA caused a marked enhancement of these responses, resulting in a significant increase in the number of Tg T cells in both the MLN and PP after feeding (Fig. 4a, 4b). Interestingly, Flt3L-treatment also appeared to alter the kinetics of the response, as the expansion of Tg cells observed in the MLN of Flt3L-treated mice peaked on day 2, compared with day 3 in similar PBS-treated animals (Fig. 4a). In contrast, the expansion of Tg T cells evident in the PP appeared to peak on day 3 in Flt3L-treated mice, compared with day 2 in PBS-treated mice (Fig. 4b). At present, we have no explanation for this shift in the kinetic response. Flt3L treatment did not stimulate expansion of the Tg T-cell population localized in the PLN, spleen, IEL or LPL of OVA-fed mice (data not shown).
Figure 4.
Flt3-ligand (Flt3L) treatment enhances the antigen-induced expansion of transgenic (Tg) T cells observed in the gut-associated lymphoid tissue (GALT) of mice fed ovalbumin (OVA). The absolute number of Tg T cells in the mesenteric lymph nodes (MLN) (a) and Peyer’s patches (PP) (b) of phosphate-buffered saline (PBS)- versus Flt3L-treated reconstituted mice was determined by fluorescence-activated cell sorter (FACS) analysis at different times after feeding 25 mg OVA. Data shown are the average number of Tg T cells from two mice per group, and the bars show the variance between individual animals. The data are representative of four separate experiments.
Oral administration of antigen elicits rapid T-cell activation
Little is known about the early events that occur after antigen administration via the oral route. As our results indicated that feeding OVA induced a rapid T-cell expansion in the organized lymphoid tissue of the gut, it was of interest to examine the activation status of Tg T cells in the organized GALT after feeding and determine how this may be affected by the presence of increased numbers of DC. As described above, mice were treated with Flt3L or PBS for 8 days before and for 2 days after adoptive transfer of OVA TCR Tg T cells. Chimeric mice were fed a single dose of OVA (or PBS) on the final day of Flt3L treatment. The CD4+ KJ1-26+ Tg T-cell population was then analysed for surface markers indicative of activation, such as CD69, an activation antigen that is up-regulated on T lymphocytes early after stimulation.15
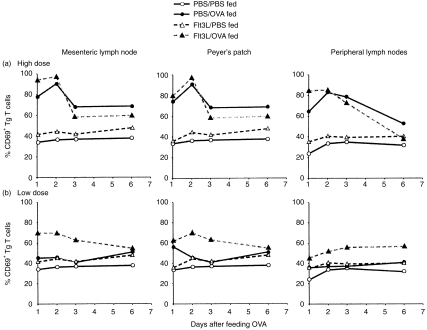
Feeding OVA elicited rapid T-cell activation in both the mucosal and peripheral lymphoid tissues in a dose-dependent manner (Fig. 5). Within 24 hr after a single high-dose feed of 25 mg OVA, ≈75–80% of the OVA-specific CD4+ Tg T cells localized in the MLN and PP of PBS-treated mice expressed high levels of CD69, with a significant proportion of these cells remaining CD69+ throughout the study (Fig. 5a). Interestingly, despite the fact that we did not observe an expansion of Tg T cells in the PLN after feeding OVA, the Tg cells localized in the PLN did express surface CD69 after OVA feeding (Fig. 5a). Similar results were achieved when we examined CD69 expression on CD4+ Tg T cells in the MLN, PP and PLN of mice that had been pretreated with Flt3L before feeding a high dose of OVA. Tg T cells in each of these tissues in the Flt3L-treated mice also rapidly up-regulated CD69 within 24 hr after feeding, with an equivalent or slightly higher percentage of CD69+ Tg T cells observed than found in PBS-treated animals fed this dose of OVA. It should be noted that there was no up-regulation of CD69 expression on cells isolated from PBS-fed control mice.
Figure 5.
Rapid T-cell activation is induced by feeding ovalbumin (OVA). Chimeric mice were generated as before and fed phosphate-buffered saline (PBS), high- (25 mg) (a), or low- (5 mg) (b) dose OVA. Cells were isolated from mesenteric lymph nodes (MLN), Peyer’s patches (PP) and popliteal lymph nodes (PLN) of PBS- or Flt3-ligand (Flt3L)-treated mice at various times after feeding. Three-colour fluorescence-activated cell sorter (FACS) analysis was performed to assess levels of the activation marker, CD69, on the transgenic (Tg) T-cell population in each tissue. Data shown are the average of two individual mice per group and are representative of three separate experiments.
Our previous studies have shown that the ability of Flt3L to enhance oral tolerance is most clearly demonstrable when low, suboptimal doses of antigen are fed, which are often insufficient to provoke tolerance in normal mice.10 As we found that feeding 25 mg OVA elicited such rapid, intense T-cell activation, we predicted that the enhancing effect of Flt3L on an already maximal response may be hard to detect. We therefore thought it important to also examine the effect of Flt3L treatment on the T-cell response induced by feeding a lower (5 mg) dose of OVA, assuming that this might reveal greater differences between Flt3L-treated and PBS-treated mice. Feeding this lower dose of OVA was insufficient to induce CD69 up-regulation on OVA-specific Tg T cells in the MLN or PLN of PBS-treated mice at any time, although we did observe a minimal, transient increase in CD69 levels in the PP at 24 hr (Fig. 5b). However, in mice pretreated with Flt3L, a marked increase in CD69 expression could be observed on Tg T cells found in each of these tissues at all time-points after feeding (Fig. 5b), indicating that the rapid T-cell activation induced in both the GALT and peripheral lymphoid tissue after feeding high doses of antigen can be induced in Flt3L-treated mice using low doses of antigen that are normally ineffective in control animals. This shows that the tolerogenic response to fed antigen is enhanced in the presence of increased numbers of DC.
Development of an antigen-specific memory T-cell population following oral administration of soluble antigen
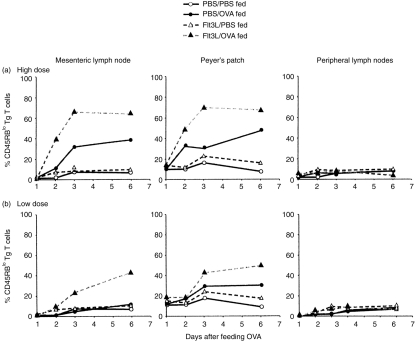
As we had observed evidence of antigen-specific T-cell activation, we were interested in examining whether feeding antigen also promoted the generation of a memory T-cell population. We therefore carried out similar dose–response studies to those described above, but analysed the OVA-specific Tg T cells for levels of CD45RB expression, a cell-surface marker that is down-regulated on memory T cells. Memory T-cell development can indeed be observed after feeding OVA because Tg T cells with a CD45RBlo phenotype could be detected in both the MLN and PP of PBS-treated mice within 3 days after feeding a single, high dose of 25 mg OVA (Fig. 6a). In contrast, despite evidence of up-regulated CD69 expression on Tg T cells in the PLN (Fig. 5), CD45RBlo memory T cells could not be detected in the PLN of any transfer mice at any time-point examined (Fig. 6a, 6b).
Figure 6.
Oral administration of antigen is associated with memory T-cell development. Chimeric mice were generated as before and fed phosphate-buffered saline (PBS), high- (25 mg) (a), or low- (5 mg) (b) dose ovalbumin (OVA). Cells were isolated from mesenteric lymph nodes (MLN), Peyer’s patches (PP) and popliteal lymph nodes (PLN) of PBS- or Flt3-ligand (Flt3L)-treated mice at various times after feeding. Three-colour fluorescence-activated cell sorter (FACS) analysis was performed to assess levels of CD45RB on the transgenic (Tg) T-cell population in each tissue. Data shown are the average of two individual mice per group and are representative of three separate experiments.
Flt3L treatment enhanced the T-cell response to fed antigen by promoting the development of CD45RBlo memory T cells. Mice that had been pretreated with Flt3L before being fed 25 mg OVA showed a striking twofold increase in the percentage of CD45RBlo Tg T cells in MLN and PP compared with PBS-treated mice fed 25 mg OVA (Fig. 6a). However, once again, the most dramatic difference between PBS- and Flt3L-treated mice was evident in animals fed a lower dose (5 mg) of OVA (Fig. 6b). Whereas PBS-treated mice fed this low dose of antigen did not develop significant numbers of CD45RBlo OVA-specific Tg T cells in their MLN at any time-point examined, Flt3L-treated mice fed 5 mg OVA showed progressive memory T-cell development from day 3 onwards (Fig. 6b). A similar pattern was observed in the PP of mice fed 5 mg OVA, where a significant memory T-cell population was evident in Flt3L- but not in PBS-treated mice from day 3 post-feed (Fig. 6b).
DISCUSSION
Although oral administration of soluble protein antigen is known to down-regulate systemic immune responses, the initial events that occur after antigen feeding are unclear. By utilizing mice adoptively transferred with DO11.10 OVA TCR Tg T cells, we were able to track an antigen-specific T-cell population in vivo and characterize its response early after cognate interaction with fed antigen. In addition, by expanding DC in vivo prior to antigen feeding, we defined a role for DC in presenting orally administered antigens to T cells. Our results show that although the end result of feeding soluble protein antigen is profound systemic unresponsiveness, the induction of oral tolerance is an active process. The earliest events that occur after antigen feeding appear to be an activation of and increase in the number of antigen-specific T cells in the organized lymphoid tissues of the gut. Furthermore, our data reveal that the early T-cell response to fed antigen is enhanced in the presence of increased DC numbers, thereby implicating DC as critical tolerogenic APC during oral tolerance induction.
The site where antigen-specific T cells become tolerized following oral administration of antigen has largely remained undefined until now. One might assume that tolerance would occur in the GALT because this is obviously where orally introduced antigen will first come into contact with a variety of different types of professional APC, including DC, B cells and macrophages, as well as less conventional APC, such as intestinal epithelial cells (reviewed in 2). However, this has never been formally demonstrated. Indeed, some antigens, including OVA, can enter the circulation very rapidly after feeding,16–18 thereby suggesting that the inductive events that lead to oral tolerance could potentially occur elsewhere at peripheral sites. Our data indicate that the gut does indeed appear to be the primary site where antigen:T-cell interactions occur. We observed a striking increase in Tg T cells in the MLN and PP, but not in the peripheral lymphoid organs, during the first 3 days after feeding a single dose of antigen.
Recent studies by two other groups have also focused on analysing the T-cell response to fed antigen. Chen et al.19 saw an expansion of antigen-reactive T cells in the PP after feeding antigen, whereas Gutgemann et al.20 reported both gut-associated and systemic expansion of antigen-reactive T cells after feeding. Both of these latter studies utilized a multiple-dose feeding regimen, which is believed to induce tolerance via regulatory T cells secreting interleukin (IL)-10 and/or transforming growth factor-β (TGF-β).4 The differences between these and our studies emphasize that the mechanistic processes of tolerance induction are highly dependent on feeding protocols, and serious consideration should be given to these matters before attempting tolerance therapy.
One of the most interesting findings to come from our study was the observation that oral tolerance induction is associated with the same events that normally proceed after the induction of active T-cell responses, namely, rapid CD69 up-regulation and clonal expansion, followed by the generation of a CD45RBlo antigen-specific memory T-cell population. The up-regulated CD69 expression on the Tg T-cell population in the MLN and PP after feeding OVA is particularly striking as, within 24 hr post high-dose feed, 75–80% of the OVA-specific T cells are CD69+. Although the generation of a memory T-cell population is more gradual, within 3 days after feeding a high dose of OVA, high numbers of CD45RBlo T cells can be detected in both the MLN and PP of OVA-fed mice, and these persisted for the duration of our study. The data shown here thus formally demonstrate that although tolerogenic responses that occur in the gut are qualitatively different from stimulatory responses in the periphery, they are both actively induced. We did see a marked up-regulation of the T-cell activation marker CD69 on Tg T cells in the PLN within 24 hr after feeding OVA, although no subsequent expansion of Tg cells was observed. We have no explanation for this finding, but it is possible that antigen is distributed systemically from the gut lumen to the peripheral lymph nodes where it provokes some T-cell reactivity, but no expansion. Alternatively, it is feasible that the CD69+ Tg T cells localizing in the PLN have trafficked from the gut to promote systemic tolerance. Distinguishing between these possibilities is important and is the current focus of our studies.
Using a classical model of oral tolerance, as well as the adoptive transfer system described here, we have previously demonstrated that mice treated with Flt3L to expand DC in vivo exhibit more profound systemic tolerance after feeding OVA than do PBS-treated control mice fed OVA.10 The results of this current study provide further insight into the role of DC during the induction of oral tolerance by showing that in the presence of increased DC numbers, the normal events that occur after feeding are enhanced. This was evidenced by the higher proportion of antigen-specific T cells that become activated, increase in number and develop into cells with a memory phenotype in mice that have been treated with Flt3L. Of particular note is our finding that the activation events which occur after feeding a high dose of antigen can now be seen in Flt3L-treated mice fed a low, suboptimal dose of antigen, which is ineffective in control mice. The reason for the apparent difference in kinetics of the response between PBS-treated and Flt3L-treated mice is not clear at present and further in-depth studies will be required to address this point.
If both immunogenic and tolerogenic responses can be elicited by DC, at what level are these different outcomes regulated? Several recent studies have emphasized that it is the qualitative nature of the APC:T-cell interaction which determines the outcome of the subsequent response.7,21,22 Thus it has been hypothesized that APC which express low levels of the co-stimulatory molecules B7.1/2 preferentially interact with T cells via the high-affinity T-cell surface receptor, CTLA4, providing an interaction that promotes tolerance.21 In contrast, APC expressing high levels of B7.1/2 might preferentially interact with T cells via the CD28 receptor, resulting in a stimulatory signal to the T cell.21 As we have shown that intestinal DC expanded by Flt3L express relatively low levels of co-stimulatory molecules in situ.10 we have postulated that these APC are capable of presenting antigen in a tolerogenic manner. Certainly our data support this hypothesis. Tolerance is enhanced in mice with Flt3L-expanded DC populations, implying that there may be an increased probability of antigen-laden DC interacting in a tolerogenic manner with naive T cells. It will now be important to determine the relative importance of B7.1/2 and CD28/CTLA4 interactions during oral tolerance, particularly in mice with elevated DC numbers.
Adjuvants provoke local secretion of the necessary proinflammatory cytokines required to up-regulate B7.1/2 and CD40 expression on DC, which in turn promote activation of naive T cells.23,24 Peripheral tolerance elicited by the i.v. route can be abrogated by concomitant administration of inflammatory cytokines,22 perhaps explaining why it is necessary to administer antigen with an appropriate adjuvant in order to elicit an effective stimulatory response. As mucosal adjuvants, such as cholera toxin, prevent oral tolerance induction,25 and oral tolerance cannot be induced in mice with active intestinal inflammation,26 it seems reasonable that DC in the intestinal tract might behave in a similar way to DC in the peripheral lymphoid organs and can be converted from tolerogenic into immunogenic APC if the correct signals are provided. To this end, studies are currently in progress to assess whether oral tolerance can indeed be reversed by converting DC from a resting to an activated phenotype.
In summary, our demonstration of the central role of DC in regulating mucosal immune responses has important implications in the design of mucosal vaccines and will provide us with a better understanding of how oral tolerance may potentially be utilized as therapy.
REFERENCES
- 1.Mowat AM. The regulation of immune responses to dietary protein antigens. Immunol Today. 1987;8:93. doi: 10.1016/0167-5699(87)90853-X. [DOI] [PubMed] [Google Scholar]
- 2.Mowat AM, Viney JL. The anatomical basis of intestinal immunity. Immunol Rev. 1997;156:145. doi: 10.1111/j.1600-065x.1997.tb00966.x. [DOI] [PubMed] [Google Scholar]
- 3.Weiner HL, Friedman A, Miller A, et al. Oral tolerance: immunologic mechanisms and treatment of animal and human organ specific autoimmune diseases by oral administration of autoantigens. Annu Rev Immunol. 1994;12:809. doi: 10.1146/annurev.iy.12.040194.004113. [DOI] [PubMed] [Google Scholar]
- 4.Weiner HL. Oral tolerance: immune mechanisms and treatment of autoimmune diseases. Immunol Today. 1997;18:335. doi: 10.1016/s0167-5699(97)01053-0. [DOI] [PubMed] [Google Scholar]
- 5.Jenkins MK, Shwartz RH. Antigen presentation by chemically modified splenocytes induces antigen-specific T cell unresponsiveness in vitro and in vivo. J Exp Med. 1987;165:302. doi: 10.1084/jem.165.2.302. [DOI] [PMC free article] [PubMed] [Google Scholar]
- 6.Eynon EE, Parker DC. Small B cells as antigen-presenting cells in the induction of tolerance to soluble protein antigens. J Exp Med. 1992;175:131. doi: 10.1084/jem.175.1.131. [DOI] [PMC free article] [PubMed] [Google Scholar]
- 7.Finkelman FD, Lees A, Birnbaum R, Gause WC, Morris SC. Dendritic cells can present antigen in vivo in a tolerogenic or immunogenic fashion. J Immunol. 1996;157:1406. [PubMed] [Google Scholar]
- 8.Steinman RM. The dendritic cell and its role in immunogenicity. Annu Rev Immunol. 1991;9:271. doi: 10.1146/annurev.iy.09.040191.001415. [DOI] [PubMed] [Google Scholar]
- 9.Maraskovsky E, Brasel K, Teepe M, et al. Dramatic increase in the numbers of functionally mature dendritic cells in Flt3 ligand-treated mice: multiple dendritic cell subpopulations identified. J Exp Med. 1996;184:1953. doi: 10.1084/jem.184.5.1953. [DOI] [PMC free article] [PubMed] [Google Scholar]
- 10.Viney JL, Mowat AM, O’malley JM, Williamson E, Fanger NA. Expanding dendritic cells in vivo enhances the induction of oral tolerance. J Immunol. 1998;160:5815. [PubMed] [Google Scholar]
- 11.Kearney ER, Pape KA, Loh DY, Jenkins MK. Visualization of peptide-specific T cell immunity and peripheral tolerance induction in vivo. Immunity. 1994;1:327. doi: 10.1016/1074-7613(94)90084-1. [DOI] [PubMed] [Google Scholar]
- 12.Murphy KM, Heimberger AB, Loh DY. Induction by antigen of intrathymic apoptosis of CD4+ CD8+ TCRlo thymocytes in vivo. Science. 1990;250:1720. doi: 10.1126/science.2125367. [DOI] [PubMed] [Google Scholar]
- 13.Brasel K, McKenna HJ, Morrissey PJ, et al. Hematologic effects of flt3 ligand in vivo in mice. Blood. 1996;88:2004. [PubMed] [Google Scholar]
- 14.Van Houten N, Blake SF. Direct measurement of anergy of antigen-specific T cells following oral tolerance induction. Immunol Today. 1996;157:1337. [PubMed] [Google Scholar]
- 15.Testi R, D’ambrosio D, De Maria R, Santoni A. The CD69 receptor: a multipurpose cell-surface trigger for hematopoietic cells. Immunol Today. 1994;15:479. doi: 10.1016/0167-5699(94)90193-7. [DOI] [PubMed] [Google Scholar]
- 16.Peng HJ, Turner MW, Strobel S. The generation of a ‘tolerogen’ after the ingestion of ovalbumin is time-dependent and unrelated to serum levels of immunoreactive antigen. Clin Exp Immunol. 1990;81:510. doi: 10.1111/j.1365-2249.1990.tb05365.x. [DOI] [PMC free article] [PubMed] [Google Scholar]
- 17.Bruce MG, Ferguson A. Oral tolerance to ovalbumin in mice: studies of chemically modified and ‘biologically filtered’ antigen. Immunology. 1986;57:627. [PMC free article] [PubMed] [Google Scholar]
- 18.Swarbrick ET, Stokes CR, Soothill JF. Absorption of antigens after oral immunization and the simultaneous induction of specific systemic tolerance. Gut. 1979;20:121. doi: 10.1136/gut.20.2.121. [DOI] [PMC free article] [PubMed] [Google Scholar]
- 19.Chen Y, Inobe J, Weiner HL. Inductive events in oral tolerance in the TCR transgenic adoptive transfer model. Cell Immunol. 1997;178:62. doi: 10.1006/cimm.1997.1119. [DOI] [PubMed] [Google Scholar]
- 20.Gutgemann I, Fahrer AM, Altman JD, Davis MK, Chien Y-H. Induction of rapid T cell activation and tolerance by systemic presentation of an orally administered antigen. Immunity. 1998;8:667. doi: 10.1016/s1074-7613(00)80571-3. [DOI] [PubMed] [Google Scholar]
- 21.Perez VL, Van Parijs L, Biuckians A, et al. Induction of peripheral T cell tolerance in vivo requires CTLA-4 engagement. Immunity. 1997;6:411. doi: 10.1016/s1074-7613(00)80284-8. [DOI] [PubMed] [Google Scholar]
- 22.Pape KA, Khoruts A, Mondino A, Jenkins MK. Inflammatory cytokines enhance the in vivo clonal expansion and differentiation of antigen-activated CD4+ T cells. J Immunol. 1997;159:591. [PubMed] [Google Scholar]
- 23.Inaba K, Witmer-Pack M, Inaba M, et al. The tissue distribution of the B7 costimulator in mice: abundant expression on dendritic cells in situ and during maturation in vitro. J Exp Med. 1994;180:1849. doi: 10.1084/jem.180.5.1849. [DOI] [PMC free article] [PubMed] [Google Scholar]
- 24.Grewal IS, Xu J, Flavell RA. Impairment of antigen-specific T-cell priming in mice lacking CD40 ligand. Nature. 1995;378:617. doi: 10.1038/378617a0. [DOI] [PubMed] [Google Scholar]
- 25.Elson CO, Ealding W. Cholera toxin feeding did not induce oral tolerance in mice and abrogated oral tolerance to an unrelated protein antigen. J Immunol. 1984;133:2892. [PubMed] [Google Scholar]
- 26.Strobel S, Mowat AM, Ferguson A. Prevention of oral tolerance induction to ovalbumin and enhanced antigen presentation. Immunology. 1985;56:57. [PMC free article] [PubMed] [Google Scholar]


