Abstract
In lipopolysaccharide (LPS)‐hyporesponsive C3H/HeJ mice, alveolar macrophages (AMφ) produce much more tumour necrosis factor‐α than peritoneal macrophages (PMφ) when stimulated with LPS (10 µg/ml), but the induction of inducible nitric oxide synthase (iNOS) gene expression and production of nitric oxide (NO) in AMφ are not found. In the present study, we determined the induction of iNOS gene expression, using semi‐quantitative reverse transcription–polymerase chain reaction, and the release of NO in AMφ and PMφ from C3H/HeJ and C3H/HeN mice. The results showed the induction of iNOS mRNA accumulation in a dose‐dependent manner by LPS alone or in combination with interferon‐γ in both macrophages. The effects of the stimuli on iNOS gene expression and NO production were significantly higher in AMφ than in the PMφ of C3H/HeJ mice. The response of macrophages from C3H/HeN mice was similar to those from C3H/HeJ mice, but the difference of iNOS gene expression between AMφ and PMφ in C3H/HeN mice was not as striking as in C3H/HeJ mice. The results show that the iNOS gene expression and NO production were activated differently in AMφ and PMφ and suggest that the functional properties of macrophages isolated from distinct origins are different.
Introduction
Nitric oxide (NO) is an important factor produced by macrophages in defence against microbial disease.1,2 The release of NO from murine peritoneal macrophages (PMφ) is enhanced upon activation by lipopolysaccharide (LPS) and interferon‐γ (IFN‐γ) mainly through an increase of the inducible isoform of NO synthase (iNOS).3–5 The expression of the iNOS gene is induced within a few hours by LPS or IFN‐γ.6–8 However, costimulation of the macrophage‐like cell line RAW 264.7 with both LPS and IFN‐γ results in higher steady‐state levels of iNOS mRNA accumulation.7,8 NO synthesis in mouse macrophages induced by IFN‐γ, LPS alone, or both is partially dependent on the endogenous production of tumour necrosis factor‐α (TNF‐α).9–11 Although TNF‐α can synergize with IFN‐γ to induce NO synthesis, by itself it is unable to induce NO production.12,13
The Lps gene, located on murine chromosome 4, controls the LPS responsiveness. A single mutation in the Toll‐like receptor 4 (TLR4) gene, which has been localized to the same region of the Lps locus,14,15 renders the C3H/HeJ mice highly refractory to stimulation with LPS.16 Stimulation of PMφ from C3H/HeJ mice with LPS (100 ng–50 µg/ml) did not cause NO release,17–20 but this defect can be corrected by stimulation with high concentrations of IFN‐γ or heat‐killed Bacillus Calmette–Guérin (BCG).18,19 In contrast, PMφ from LPS‐responsive C3H/HeN mice, can release NO in response to LPS (0·1 µg/ml) stimulation.17 A previous study has shown that macrophages from LPS‐hyporesponsive C3H/HeJ mice did respond to 1 ng/ml LPS to activate the nuclear transcription factor NF‐κB, which is involved in the LPS‐induced iNOS gene expression.17,21 Nevertheless, the induction of iNOS gene expression by LPS in macrophages of C3H/HeJ mice remains unclear. Recently, it has been shown that alveolar macrophages (AMφ) of C3H/HeJ mice, produce a normal level of TNF‐α, compared with PMφ, in response to a higher dose of LPS (10 µg/ml).22 These results suggest that NO synthesis in AMφ and PMφ might be regulated differently, as in the case of TNF‐α production. Since the induction of iNOS gene expression and release of NO from AMφ of C3H/HeJ mice has not been reported, we hypothesized that their expression in AMφ and PMφ would be different when activated by LPS and IFN‐γ, similar to their TNF‐α production in C3H/HeJ mice.22 Therefore, in this study, we compared the inducing effect of LPS and IFN‐γ on iNOS gene expression and production of NO in resident AMφ and PMφ from C3H/HeJ and C3H/HeN mice.
Materials and methods
Animals
C3H/HeJ and C3H/HeN mice were purchased from the animal facility of Medical College, National Cheng Kung University, but were originally obtained from the Jackson Laboratory (Bar Harbor, ME). They were maintained on standard laboratory chow and water ad libitum. Eight‐ to 12‐week‐old females were used in all experiments.
Reagents
LPS (Escherichia coli serotype 0111:B4) was obtained from Sigma (St. Louis, MO). Murine recombinant IFN‐γ (specific activity 4 × 10⁶ U/mg) was from R & D (Minneapolis, MN).
Macrophage culture
Resident peritoneal cells were obtained by lavage of the peritoneal cavity with cold RPMI‐1640 medium. Bronchoalveolar cells were harvested from lung lavage with cold RPMI‐1640 in 1 ml aliquots. The cells were washed with cold RPMI‐1640 by centrifugation at 200 g for 10 min at 4° and resuspended in the RPMI‐1640 medium supplemented with 10% fetal calf serum (Hyclone, Logan, UT), 2 mm glutamine, 100 U/ml penicillin and 100 µg/ml streptomycin. Peritoneal exudate cells or bronchoalveolar cells containing 106 macrophages/well were incubated in 24‐well plates (Costar, Cambridge, MA) overnight at 37° in 5% CO2. Non‐adherent cells were removed and washed twice with warm RPMI‐1640. Complete medium was added with the indicated experimental reagents.
NO assay
Nitrite, measured by Griess reaction, was taken as a measure of NO production. Briefly, 100 µl of culture supernatant was reacted with an equal volume of Griess reagent (1 part 0·1% naphthylethylenediamine, 1 part 1% sulfanilamide in 5% H3PO4) in 96‐well tissue culture plates for 10 min at room temperature in the dark. The absorbency at 570 nm was determined using a microplate reader (Dynatech MR700, Alexandra, VA).
Isolation of RNA, and semi‐quantitative reverse transcription‐polymerase chain reaction
Cells were treated with IFN‐γ or LPS, alone or combined, for studying iNOS mRNA expression. After stimulation, cells were lysed with a cold RNA extraction solution (Ultraspec RNA; Biotecx Lab. Inc., Houston, TX). The reverse transcription–polymerase chain reaction (RT‐PCR) assays were performed with a Titan™ One Tube RT‐PCR System kit (Boehringer Mannheim GmbH, Mannheim, Germany). Briefly, equal amounts of total RNA from each sample were added to 50 µl of a reaction mixture containing 0·2 mm dNTP, 0·4 µm each of specific primers, 5 mm dithiothreitol, 5 U RNase inhibitor, 1 µl of avian myeloblastosis virus (AMV) reverse transcriptase and Expand™ High Fidelity enzyme mix. The primer sequences were as follows: 5′ CATGGCTTGCCCCTGGAAGTTTCTCTTCAAAG, 3′ GCAGCATCCCCTCTGATGGTGCCATCG for iNOS [754 base pair (bp) fragment], and 5′ GTGGGCCGCTCTAGGCACCAA, 3′ CTCTTTGATGTCACGCACGATTTC for β‐actin (540 bp fragment), as a control. RT‐PCR was carried out in a Perkin Elmer Cetus thermocycler. PCR consisted of denaturation at 94° for 45 seconds, primer annealing at 55° (for iNOS) or 60° (for β‐actin) for 45 seconds, and extension at 72° for 2 min. The number of cycles was determined for samples not reaching the amplification plateau (28–30 cycles for iNOS in HeN or HeJ mice, respectively, and 25 cycles for β‐actin). The PCR product was visualized by electrophoresis in a 3% agarose gel (consisting of 2% Nusieve GTG agarose and 1% agarose), and by staining with 0·5 µg/ml ethidium bromide.
Statistical methods
The Mann–Whitney Rank test was used for the analysis of data; P‐values less than 0·05 were considered significant. All analyses were performed with statview version 3·0 for Macintosh (Abacus Concepts, Inc., Berkeley, CA).
Results
Induction of iNOS mRNA in AMφ and PMφ by LPS
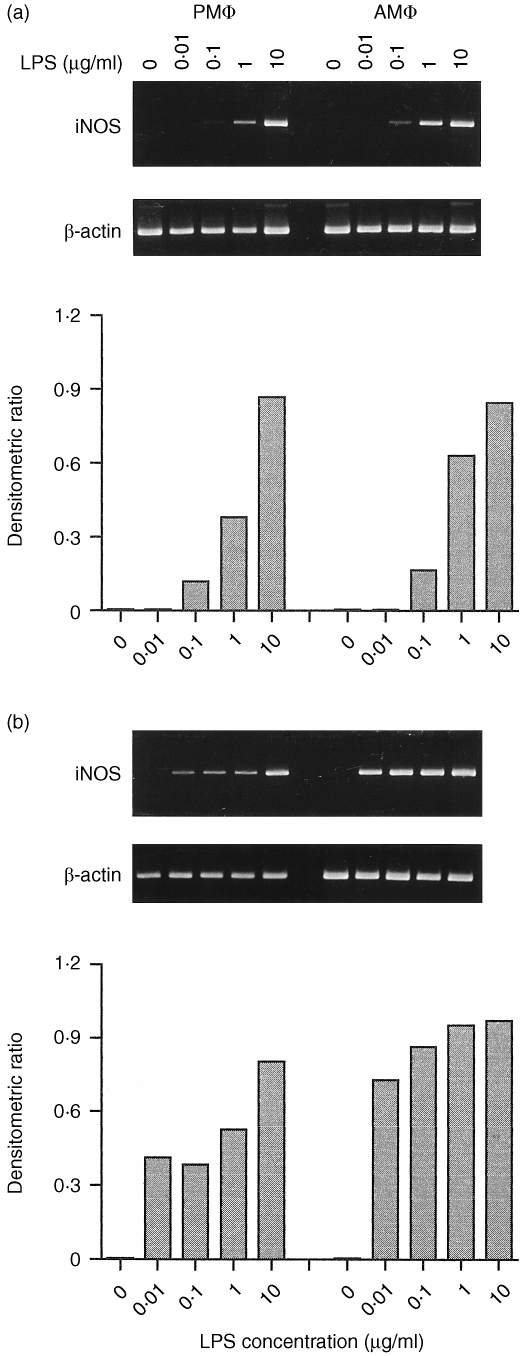
The stimulating effect of LPS on the accumulation of iNOS mRNA is shown in Fig. 1. The iNOS mRNA was not detectable in either C3H/HeJ macrophage populations untreated or exposed to a low concentration of LPS (0·01 µg/ml) (Fig. 1a). However, the iNOS mRNA was induced by LPS in a dose‐dependent manner and its expression in AMφ was greater than that in PMφ treated with LPS(0·1–1 µg/ml). When treated with 10 µg/ml of LPS, both macrophages expressed equally high levels of iNOS mRNA.
Figure 1.
Dose–response analysis of iNOS mRNA induction by LPS in macrophages from C3H/HeJ (a) or C3H/HeN (b) mice. Cells were incubated for 4 hr with various concentrations of LPS (0·01–10 µg/ml). Levels of iNOS and β‐actin mRNAs were determined by RT‐PCR analysis (top panel). Results of scanning densitometric analysis of the gel are presented as iNOS : β‐actin ratio (bottom panel).
In C3H/HeN macrophages, the steady‐state levels of iNOS mRNA were slightly increased by increasing doses of LPS (Fig. 1b) and AMφ had a higher level of iNOS mRNA induction by LPS than PMφ. In contrast to C3H/HeJ mice, macrophages from C3H/HeN mice responded to 0·01 µg/ml of LPS and expressed high levels of iNOS mRNA.
Next, the induction of iNOS gene by LPS (1 µg/ml) in C3H/HeN and C3H/HeJ macrophages was compared. The results showed that LPS‐stimulated AMφ and PMφ from C3H/HeN mice expressed higher levels of iNOS mRNA than did those from C3H/HeJ mice, as indicated by the higher number of amplification cycles required to detect the gene in C3H/HeJ mice (more than three cycles were used in C3H/HeN samples; data not shown).
Induction of iNOS mRNA in AMφ and PMφ by combination of LPS and IFN‐γ
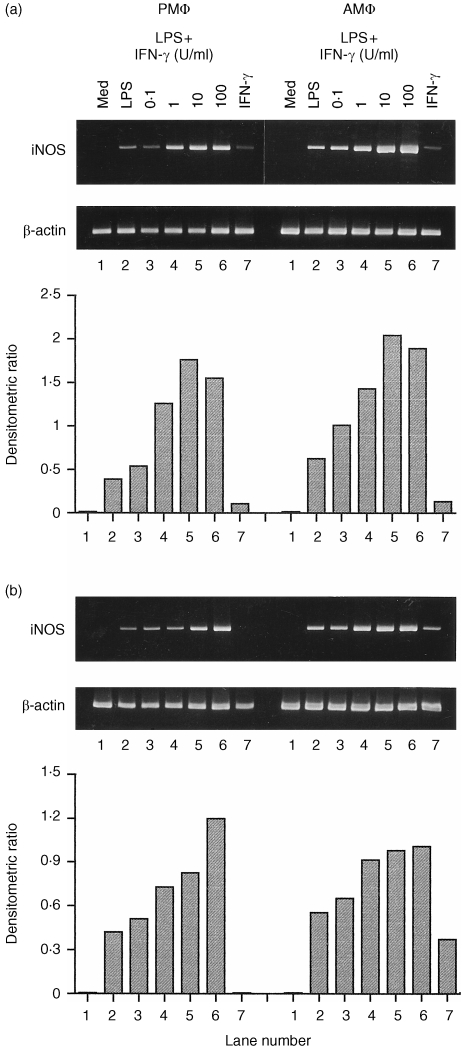
The synergistic effect of stimuli on the expression of iNOS mRNA is shown in Fig. 2. Treatment of C3H/HeJ macrophages with IFN‐γ alone could induce a detectable amount of iNOS mRNA. However, the amount was significantly less than that with the treatment with LPS alone (Fig. 2a). LPS (1 µg/ml) combined with various concentrations of IFN‐γ induced iNOS mRNA in a dose‐dependent manner. The level of iNOS mRNA in AMφ was significantly greater than in PMφ when stimulated with LPS plus IFN‐γ.
Figure 2.
Induction of iNOS mRNA by combination of LPS and various concentrations of IFN‐γ in macrophages from C3H/HeJ (a) or C3H/HeN (b) mice. Cells were incubated for 4 hr either in medium alone (lane 1) or with LPS (1 µg/ml, lane 2), IFN‐γ (100 U/ml, lane 7), or LPS (1 µg/ml) combined with IFN‐γ (0·1, 1, 10, or 100 U/ml, lanes 3–6). The iNOS and β‐actin mRNAs were assayed as described in Fig. 1.
Likewise, LPS induced greater iNOS mRNA levels than IFN‐γ in both types of C3H/HeN macrophage (Fig. 2b). When treated with IFN‐γ alone, AMφ could express a detectable amount of iNOS mRNA but PMφ did not. The induction of iNOS mRNA increased dose‐dependently in C3H/HeN macrophages treated with LPS combined with IFN‐γ and the mRNA level in AMφ was greater than in PMφ. However, the difference in iNOS gene expression between stimulated AMφ and PMφ from C3H/HeN mice was less dramatic than in macrophages from C3H/HeJ mice.
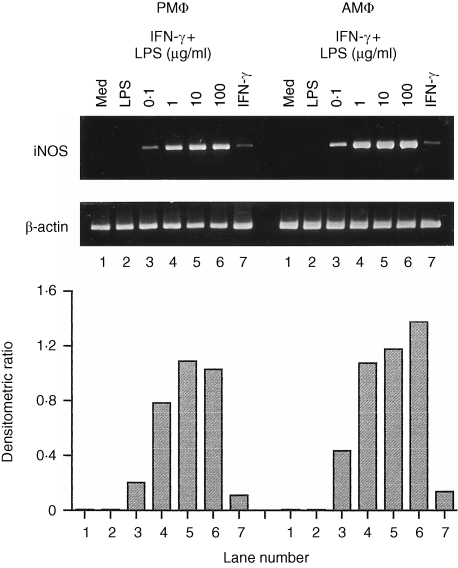
To determine the restoration of LPS responses on induction of iNOS mRNA accumulation by IFN‐γ, C3H/HeJ macrophages were treated with IFN‐γ (100 U/ml) in the presence of varying concentrations of LPS, and the accumulation of iNOS mRNA was measured. When stimulated with 0·01 µg/ml LPS alone, C3H/HeJ macrophages did not accumulate iNOS mRNA. However, in the presence of IFN‐γ (100 U/ml), iNOS mRNA was induced by this dose of LPS stimulation and increased in a dose‐dependent manner (Fig. 3). In C3H/HeJ AMφ, the expression of iNOS mRNA was greater than in PMφ treated with these stimuli.
Figure 3.
The restoration of LPS‐induced iNOS mRNA accumulation by IFN‐γ in macrophages from C3H/HeJ mice. Cells were incubated for 4 hr either in medium alone (lane 1) or with LPS (0·01 µg/ml, lane 2), IFN‐γ (100 U/ml, lane 7), or IFN‐γ (100 U/ml) combined with LPS (0·01, 0·1, 1, or 10 µg/ml, lanes 3–6). The iNOS and β‐actin mRNAs were assayed as described in Fig. 1.
Kinetics of iNOS mRNA induction in AMφ and PMφ
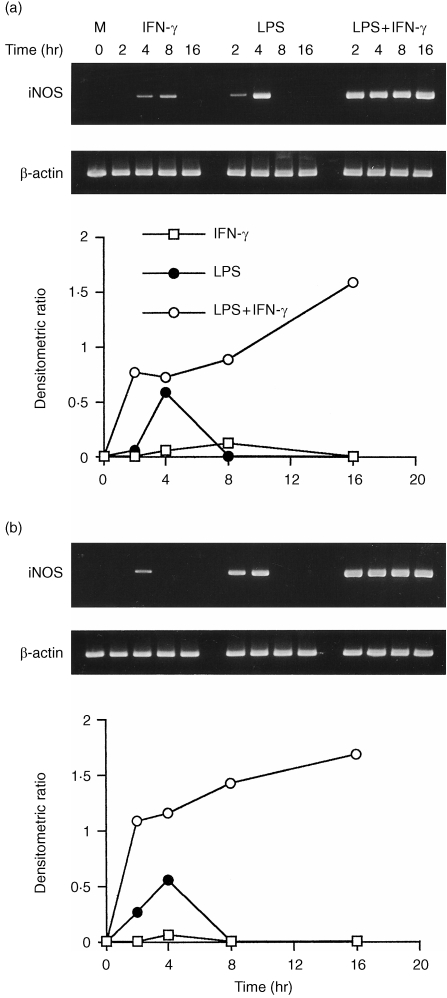
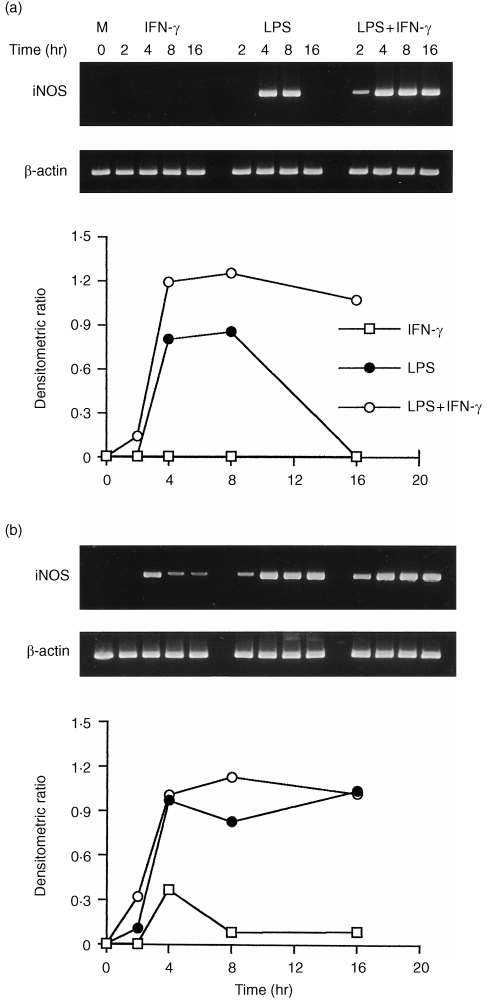
The constitutive iNOS gene expression was not detected in unstimulated cells. A low level of iNOS mRNA was expressed in cells from C3H/HeJ mice 4 hr after stimulation with IFN‐γ alone (Fig. 4a,b). The level of iNOS mRNA in PMφ peaked at 8 hr and disappeared thereafter. The accumulation of iNOS mRNA in both macrophages was detected at 2 hr after stimulation with LPS (10 µg/ml) alone, peaked at 4 hr and decreased to control levels thereafter. In comparison, the accumulation of iNOS mRNA occurred most rapidly during the first 2 hr after stimulation with LPS plus IFN‐γ, attaining a level higher than with LPS alone, after which the level increased at a slower rate until it reached a maximum at 16 hr. The induction of iNOS mRNA in AMφ was more rapid than in PMφ, after exposure to LPS alone or in combination with IFN‐γ.
Figure 4.
Kinetics of induction of iNOS mRNA by LPS, IFN‐γ, or combined stimulation in peritoneal (a) and alveolar (b) macrophages from C3H/HeJ mice. Cells were stimulated with medium alone, IFN‐γ (100 U/ml), LPS (10 µg/ml), or LPS plus IFN‐γ. Total RNA was extracted at the following times after stimulation: 0, 2, 4, 8 and 16 hr. The iNOS and β‐actin mRNAs were assayed as described in Fig. 1.
In C3H/HeN mice, iNOS mRNA expression in PMφ was not induced by IFN‐γ alone during the stimulation time (Fig. 5a). By contrast, the expression of iNOS mRNA in AMφ was induced 4 hr after exposure to IFN‐γ alone, after which its level declined with time to a constant level by 8–16 hr (Fig. 5b). The iNOS mRNA in AMφ was induced 2 hr after stimulation with LPS alone, reached a maximum at 4 hr, and remained relatively unchanged up to 16 hr. In contrast, iNOS mRNA in PMφ was not induced by stimulating with LPS alone at 2 hr, but the iNOS mRNA accumulated after 4–8 hr exposure to the stimulus, then declined to the basal level thereafter. Inducible NOS mRNAs in both macrophages stimulated with LPS plus IFN‐γ accumulated most rapidly during the first 4 hr, after which their levels did not increase significantly. Interestingly, iNOS gene expression did not further up‐regulate in AMφ costimulated with a saturated concentration of LPS (10 µg/ml) and IFN‐γ than with LPS alone after 4 hr.
Figure 5.
Kinetics of induction of iNOS mRNA by LPS, IFN‐γ, or combined stimulation in peritoneal (a) and alveolar (b) macrophages from C3H/HeN mice. Treatment conditions were identical to those for Fig. 4.
Differential expression of iNOS gene in AMφ and PMφ from C3H/HeJ mice
To further investigate the finding that AMφ from C3H/HeJ mice expressed higher levels of iNOS mRNA than did PMφ exposed to the same stimuli, both cells were stimulated with LPS alone (1 µg/ml), LPS (1 µg/ml) plus IFN‐γ (10 U/ml), or LPS (0·1 µg/ml) plus IFN‐γ (100 U/ml) for 4 hr. The results showed that higher levels of iNOS mRNA were expressed in AMφ than in PMφ from C3H/HeJ mice under these stimulation conditions, as indicated by the greater number of PCR amplification cycles required to detect the gene in PMφ (data not shown).
NO production in AMφ and PMφ
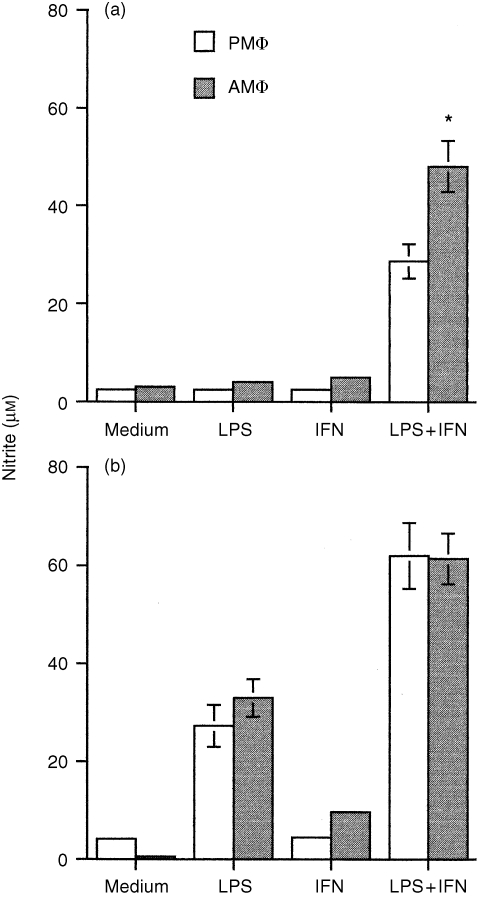
Both macrophages stimulated with LPS plus IFN‐γ produced large amounts of nitrite, and the release of nitrite was significantly greater than that produced by treatment with LPS alone. The release of nitrite by macrophages from C3H/HeN mice was significantly greater (P < 0·0001) than that from C3H/HeJ mice. LPS alone could induce the nitrite released in culture supernatants from C3H/HeN mice but not from C3H/HeJ mice. Results in C3H/HeJ mice showed that the amounts of nitrite in the AMφ cultures exposed to LPS plus IFN‐γ were significantly greater (P < 0·01) than those in PMφ cultures (Fig. 6).
Figure 6.
NO production in macrophages from C3H/HeJ (a) and C3H/HeN (b) mice. Cells were stimulated with medium alone, IFN‐γ (100U/ml), LPS (10 µg/ml), or LPS plus IFN‐γ. Culture supernatants were collected at 48 hr and assayed for nitrite content as described in the Materials and Methods. *, P < 0·01 as compared to the stimulated PMφ.
Discussion
The present study demonstrated that each population of macrophages from C3H/HeJ mice expressed detectable amounts of iNOS mRNA in response to LPS above 0·1 µg/ml dose. In C3H/HeJ mice, AMφ released significantly more nitrite than PMφ (P < 0·01) in the culture supernatants when exposed to LPS plus IFN‐γ. Macrophages of C3H/HeN mice released more nitrite under these stimulation conditions than did those of C3H/HeJ mice. In addition, the defect in LPS‐induced NO production might be attributed to transcriptional, post‐transcriptional and translational defects in C3H/HeJ macrophages.
Because macrophage function is dependent, in part, on signals received from the immediate microenvironment, it is likely that macrophage heterogeneity may arise from the unique conditions within specific tissues.23 Obviously, the sterile, anaerobic environment of the peritoneum imparts different constraints on resident macrophages than does the aerobic environment of the AMφ, which contains numerous external factors.23 In addition, the NO and cytokine production in AMφ after LPS stimulation may be important to anti‐microbial and anti‐tumour responses.24,25 Numerous reports have shown that AMφ produce more TNF‐α, macrophage inflammatory protein‐1α (MIP‐1α) and macrophage colony‐stimulating factor‐1 than PMφ or monocytes after LPS treatment.22,26,27 This makes AMφ the first line of defence against pathogens that reach the airspace of the lung. However, a relationship between the induction of the iNOS gene and NO in AMφ has not been reported, particularly in LPS‐hyporesponsive C3H/HeJ mice. The present study demonstrated that iNOS mRNA in AMφ and PMφ was induced in a dose‐dependent fashion by LPS alone, or combined with IFN‐γ. Furthermore, the steady‐state iNOS mRNA accumulated in AMφ was significantly greater than in PMφ by LPS stimulation alone or combined with IFN‐γ. The results also showed that the production of NO in C3H/HeJ AMφ was significantly greater than in PMφ when treated with the combined stimuli. In addition, the kinetic study of iNOS mRNA induction showed a difference in the iNOS gene expression between these two macrophage populations after treatment with LPS, IFN‐γ alone, or combined. These results support the role of AMφ as the first line of defence against pathogens.
Although the iNOS mRNA in AMφ and PMφ from C3H/HeJ mice was induced by 0·1 µg/ml of LPS and increased in a dose‐dependent manner, nitrite was not detected in these culture supernatants. By contrast, nitrite in the culture supernatants was associated with LPS‐induced iNOS mRNA levels of macrophage from C3H/HeN mice. A previous study showed that macrophages from C3H/HeJ mice failed to produce TNF‐α in response to LPS.28 A dual defect appears to prevent TNF‐α expression in C3H/HeJ mice. First, they failed to exhibit a normal transcriptional response to low concentrations of LPS. Second, they also have a post‐transcriptional defect that prevents LPS‐induced TNF‐α production.28 Nevertheless, this LPS defect, resulting from a single mutation in the TLR4 gene, may not be absolute, since certain partial responses are preserved under the usual conditions of stimulation,29 while others are evoked by higher concentrations of, or after longer exposures to, LPS.17,30 Whether this TLR4 defect is also associated with the MD‐2 molecule in C3H/HeJ mice remains unclear at present.31 Therefore, the defect in LPS‐induced NO production might be attributed to transcriptional and post‐transcriptional defects in macrophages of C3H/HeJ mice due to the defective Lps gene. In addition, the kinetic study showed that LPS‐induced iNOS mRNA in macrophages of C3H/HeJ mice was not detectable at 8 hr. By contrast, LPS‐induced iNOS mRNA in macrophages of C3H/HeN mice were still detectable at 8–16 hr. These results also suggest that iNOS mRNA might be more unstable in the macrophages of C3H/HeJ mice than in those of C3H/HeN mice, and this might cause, in part, the defect of NO production in C3H/HeJ mice.
LPS and IFN‐γ are the two best known activators of macrophage functions and stimulators of NO production.7,8,32 The 5′‐flanking region of the iNOS gene contains multiple regulatory elements. These include 10 copies of the IFN‐γ response element, two copies of NF‐κB, two copies of the TNF response element and others.4 This suggests that the induction of iNOS in mouse macrophages by LPS and IFN‐γ can be synergistic at the transcriptional level.3,4 Indeed, IFN‐γ in synergy with LPS induced a higher iNOS gene expression and nitrite in macrophage cultures from both strains of mice. In macrophages of C3H/HeJ mice, IFN‐γ has been shown to augment LPS‐induced TNF‐α biosynthesis, acting at both transcriptional and post‐transcriptional levels.33 Recently, it has been shown that secretory leucocyte protease inhibitor (SLPI) was produced in murine LPS‐hyporesponsive macrophage cell lines, primary macrophages and polymorphonuclear leucocytes.34 Transfection of macrophages with SLPI suppressed LPS‐induced NF‐κB activation and NO production. It is possible that IFN‐γ could suppress the expression of SLPI in LPS‐hyporesponsive cells and restore their NO production in response to lower concentrations of LPS.34 Therefore in the presence of IFN‐γ, lower concentration of LPS (0·01 µg/ml) could induce iNOS mRNA in macrophages of C3H/HeJ mice.
In conclusion, the defect in LPS‐induced NO production by C3H/HeJ macrophages might be attributed to transcriptional, post‐transcriptional, and translational defects, according to the findings as follows. First, the accumulation of iNOS mRNA in C3H/HeJ macrophages was less than that obtained in C3H/HeN macrophages in response to lower concentrations of LPS; second, the iNOS mRNA in C3H/HeJ macrophages was more unstable than that in C3H/HeN macrophages; and third, the iNOS mRNA could be induced by LPS, but nitrite was not detected in C3H/HeJ macrophages. Since AMφ expressed more iNOS mRNA and released more nitrite than PMφ in C3H/HeJ mice, it suggests that resident macrophages in the lung and peritoneum have heterogeneous responses to stimuli.
Acknowledgments
The authors would like to thank Dr J.‐S. Kuo, Department head, for his support. Grant sponsors: National Science Council 86‐2314B075 A009 and Taichung Veterans General Hospital TCVGH897307C, Taiwan, ROC.
Glossary
Abbreviations
- AMφ
alveolar macrophages
- iNOS
inducible NO synthase
- NO
nitric oxide
- PMφ
peritoneal macrophages
References
- 1.Nathan CF, Hibbs JB., Jr Role of nitric oxide synthesis in macrophage antimicrobial activity. Curr Opin Immunol. 1991;3:65. doi: 10.1016/0952-7915(91)90079-g. [DOI] [PubMed] [Google Scholar]
- 2.De Groote A, Fang FC. NO inhibitions: antimicrobial properties of nitric oxide. Clin Infect Dis. 1995;21:S162. doi: 10.1093/clinids/21.supplement_2.s162. [DOI] [PubMed] [Google Scholar]
- 3.Lowenstein CJ, Alley ZW, Raval P, et al. Macrophage nitric oxide synthase gene: two upstream regions mediate induction by interferon γ and lipopolysaccharide. Proc Natl Acad Sci USA. 1993;90:9730. doi: 10.1073/pnas.90.20.9730. [DOI] [PMC free article] [PubMed] [Google Scholar]
- 4.Xie QW, Whisnant R, Nathan C. Promoter of the mouse gene encoding calcium‐independent nitric oxide synthase confers inducibility by interferon γ and bacterial lipopolysaccharide. J Exp Med. 1993;177:1779. doi: 10.1084/jem.177.6.1779. [DOI] [PMC free article] [PubMed] [Google Scholar]
- 5.Xie QW, Nathan C. The high‐output nitric oxide pathway: role and regulation. J Leukoc Biol. 1994;56:576. doi: 10.1002/jlb.56.5.576. [DOI] [PubMed] [Google Scholar]
- 6.Deng W, Thiel B, Tannenbaum CS, Hamilton TA, Stuehr DJ. Synergistic cooperation between T cell lymphokines for induction of the nitric oxide synthase gene in murine peritoneal macrophages. J Immunol. 1993;151:322. [PubMed] [Google Scholar]
- 7.Lorsbach RB, Murphy WJ, Lowenstein CJ, Snyder SH, Russel SW. Expression of nitric oxide synthase gene in mouse macrophages activated for tumor cell killing. J Biol Chem. 1993;268:1908. [PubMed] [Google Scholar]
- 8.Weisz A, Oguchi S, Cicatiello L, Esumi H. Dual mechanism for the control of inducible‐type NO synthase gene expression in macrophages during activation by interferon‐γ and bacterial lipopolysaccharide. J Biol Chem. 1994;269:8324. [PubMed] [Google Scholar]
- 9.Frankova D, Zidek Z. IFN‐γ induced TNF‐α is a prerequisite for in vitro production of nitric oxide generated in murine peritoneal macrophages by IFN‐γ. Eur J Immunol. 1998;28:838. doi: 10.1002/(SICI)1521-4141(199803)28:03<838::AID-IMMU838>3.0.CO;2-T. [DOI] [PubMed] [Google Scholar]
- 10.Ancuta P, Fahmi H, Pons JF, Blay KL, Chaby R. Involvement of the membrane form of tumour necrosis factor‐α in lipopolysaccharide induce priming of mouse peritoneal macrophages for enhanced nitric oxide response to lipopolysaccharide. Immunology. 1997;92:259. doi: 10.1046/j.1365-2567.1997.00338.x. [DOI] [PMC free article] [PubMed] [Google Scholar]
- 11.Goureau O, Amiot F, Dautry F, Courtois Y. Control of nitric oxide production by endogenous TNF‐α in mouse retinal pigmented epithelial and muller glial cells. Biochem Biophys Res Commun. 1997;240:132. doi: 10.1006/bbrc.1997.7581. [DOI] [PubMed] [Google Scholar]
- 12.Ding AH, Nathan CF, Stuehr DJ. Release of reactive nitrogen intermediates and reactive oxygen intermediates from mouse peritoneal macrophages. J Immunol. 1988;141:2407. [PubMed] [Google Scholar]
- 13.Drapier J‐C, Wietzerbin J, Hibbs JB., Jr Interferon‐γ and tumor necrosis factor induce the l‐arginine‐dependent cytotoxic effector mechanism in murine macrophages. Eur J Immunol. 1988;18:1587. doi: 10.1002/eji.1830181018. [DOI] [PubMed] [Google Scholar]
- 14.Poltorak A, He X, Smirnova I, et al. Defective LPS signaling in C3H/HeJ and C57BL/10ScCr mice: mutaions in Tlr4 gene. Science. 1998;282:2085. doi: 10.1126/science.282.5396.2085. [DOI] [PubMed] [Google Scholar]
- 15.Hoshino K, Takeuchi O, Kawai T, et al. Toll‐like receptor 4 (TLR4) ‐deficient mice are hyporesponsive to lipopolysaccharide: evidence for TLR4 as the Lps gene product. J Immunol. 1999;162:3749. [PubMed] [Google Scholar]
- 16.Sultzer BM, Castagna R, Bandekar J, Wong P. Lipopolysaccharide nonresponder cells: the C3H/HeJ defect. Immunobiology. 1993;187:257. doi: 10.1016/S0171-2985(11)80343-8. [DOI] [PubMed] [Google Scholar]
- 17.Ding A, Hwang S, Lander HM, Xie QW. Macrophages derived from C3H/HeJ (Lpsd) mice respond to bacterial lipopolysaccharide by activating NF‐κB. J Leukoc Biol. 1995;57:174. doi: 10.1002/jlb.57.1.174. [DOI] [PubMed] [Google Scholar]
- 18.Stuehr DJ, Marletta MA. Mammalian nitrate biosynthesis: mouse macrophages produce nitrite and nitrate in response to Escherichia coli lipopolysaccharide. Proc Natl Acad Sci USA. 1985;82:7738. doi: 10.1073/pnas.82.22.7738. [DOI] [PMC free article] [PubMed] [Google Scholar]
- 19.Stuehr DJ, Marletta MA. Induction of nitrite/nitrate synthesis in murine macrophages by BCG infection, lymphokines, or interferon‐γ. J Immunol. 1987;139:518. [PubMed] [Google Scholar]
- 20.Dong Z, Qi X, Xie K, Fidler IJ. Protein tyrosine kinase inhibitors decrease induction of nitric oxide synthase activity in lipopolysaccharide‐responsive and lipopolysaccharide‐nonresponsive murine macrophages. J Immunol. 1993;151:2717. [PubMed] [Google Scholar]
- 21.Xie QW, Kashiwabara Y, Nathan C. Role of transcription factor NF‐κB/Rel in induction of nitric oxide synthase. J Biol Chem. 1994;269:4705. [PubMed] [Google Scholar]
- 22.Ryan LK, Vermeulen MW. Alveolar macrophages from C3H/HeJ mice show sensitivity to endotoxin. Am J Respir Cell Mol Biol. 1995;12:540. doi: 10.1165/ajrcmb.12.5.7742017. [DOI] [PubMed] [Google Scholar]
- 23.Rutherford MS, Witsell A, Schook LB. Mechanisms generating functionally heterogeneous macrophages: chaos revisited. J Leukoc Biol. 1993;53:602. doi: 10.1002/jlb.53.5.602. [DOI] [PubMed] [Google Scholar]
- 24.Laichalk LL, Kunkel SL, Strieter RM, Danforth JM, Bailie MB, Standiford TJ. Tumor necrosis factor mediates lung antibacterial host defense in murine Klebsiella pneumonia. Infect Immun. 1996;64:5211. doi: 10.1128/iai.64.12.5211-5218.1996. [DOI] [PMC free article] [PubMed] [Google Scholar]
- 25.Skerrett SJ, Martin TR. Roles for tumor necrosis factor alpha and nitric oxide in resistance of rat alveolar macrophages to Legionella pneumophila. Infect Immun. 1996;64:3236. doi: 10.1128/iai.64.8.3236-3243.1996. [DOI] [PMC free article] [PubMed] [Google Scholar]
- 26.Vanotteren GM, Standiford TJ, Kunkel SL, et al. Expression and regulation of macrophage inflammatory protein‐1α by murine alveolar and peritoneal macrophages. Am J Respir Cell Mol Biol. 1994;10:8. doi: 10.1165/ajrcmb.10.1.8292385. [DOI] [PubMed] [Google Scholar]
- 27.Becker S, Devlin RB, Haskill JS. Differential production of tumor necrosis factor, macrophage colony‐stimulating factor, and interleukin 1 by human alveolar macrophages. J Leukoc Biol. 1989;45:353. [PubMed] [Google Scholar]
- 28.Beutler B, Krochin N, Milsark IW, Luedke C, Cerami A. Control of cachectin (tumor necrosis factor) synthesis: mechanisms of endoxin resistance. Science. 1986;232:977. doi: 10.1126/science.3754653. [DOI] [PubMed] [Google Scholar]
- 29.Coutinho A, Gronowicz E, Sultzer BM. Genetic control of B‐cell responses. I. Selective unresponsiveness to lipopolysaccharide. Scand J Immunol. 1975;4:139. doi: 10.1111/j.1365-3083.1975.tb02610.x. [DOI] [PubMed] [Google Scholar]
- 30.Sultzer BM. Genetic control of leukocyte responses to endotoxin. Nature. 1968;219:1253. doi: 10.1038/2191253a0. [DOI] [PubMed] [Google Scholar]
- 31.Shimazu R, Akashi S, Ogata H, et al. MD‐2, a molecule that confers lipopolysaccharide responsiveness on Toll‐like receptor 4. J Exp Med. 1999;189:1777. doi: 10.1084/jem.189.11.1777. [DOI] [PMC free article] [PubMed] [Google Scholar]
- 32.Adams DO, Hamilton TA. The cell biology of macrophage activation. Annu Rev Immunol. 1984;2:283. doi: 10.1146/annurev.iy.02.040184.001435. [DOI] [PubMed] [Google Scholar]
- 33.Beutler B, Tkacenko V, Milsark I, Krochin N, Cerami A. Effect of γ interferon on cachectin expression by mononuclear phagocytes. J Exp Med. 1986;164:1791. doi: 10.1084/jem.164.5.1791. [DOI] [PMC free article] [PubMed] [Google Scholar]
- 34.Jin F‐Y, Nathan C, Radzioch D, Ding A. Secretory leukocyte protease inhibitor: a macrophage product induced by and antagonistic to bacterial lipopolysaccharide. Cell. 1997;88:417. doi: 10.1016/s0092-8674(00)81880-2. [DOI] [PubMed] [Google Scholar]


