Abstract
Exposure to optimal peptide antigen concentrations induces human CD4+ T-cell clones to proliferate and secrete various cytokines. Higher (>10-fold optimal) antigen concentrations cause long-term proliferative unresponsiveness, which can be reversed by exogenous interleukin-2 (IL-2). We call this condition ‘tolerance’. We used intracellular cytokine staining and flow cytometric analysis to investigate the kinetics of interferon-γ, tumour necrosis factor-α, IL-4 and IL-5 production during the initial phase of tolerance induction. Single cell analysis of interferon-γ and IL-4 or IL-5 coexpression showed functional heterogeneity of cloned human CD4+ T cells. Superstimulation with phorbol 12-myristate 13-acetate and ionomycin (PI) revealed enhanced responsiveness shortly after tolerizing treatment, followed by reduced responsiveness. Both tolerized and activated T cells had similarly reduced cytokine responses when further stimulated with antigen during the following 48 hr, with limited enhancement following additional stimulation with PI. We conclude that cytokine induction is normally followed by a refractory phase, but that the expression of cytokines is enhanced in the initial phase of tolerance induction.
INTRODUCTION
T‐cell receptor (TCR) engagement by specific ligand [appropriate peptide antigen bound to human leucocyte antigen (HLA) class II molecules] induces human CD4+ T cells to begin functional programmes, including proliferation, lymphokine synthesis and secretion, phenotypic modulation of surface markers, tolerance and apoptosis. The microenvironment, e.g. antigen dose, the type of antigen‐presenting cells (APC) and cytokines, is thought to be the primary determinant of these responses. Clonal tolerance in antigen‐specific human CD4+ T cells has generated much research activity and interest because of its therapeutic potential in allergy, transplantation and autoimmune disease, but the molecular mechanisms involved in peripheral tolerance are not fully elucidated. Several tolerance models involve ‘anomalous’ triggering of the TCR complex: high antigen1 or low antigen2 concentration; altered peptide ligands or partial agonists;3, 4 superantigens, 5 or the presence of antibodies to CD3 and/or CD4 during antigen exposure6, 7 can all induce tolerance.
Down‐regulation of TCR/CD3 and CD4 occurs in human T cells after antigen contact, but tolerance persists after the return of antigen receptor and associated accessory molecules to previous levels.8 There are several models of tolerance in man and mouse, in vitro and in vivo and variously defined terms, such as tolerance, anergy, functional unresponsiveness and ignorance, are used by different authors. Here we use the term ‘tolerance’ to indicate the proliferative unresponsiveness induced in human CD4+ T‐cell clones by incubation with ‘high’ concentrations of peptide antigen (> 10‐fold those required for optimal proliferation). T cells exposed to an ‘optimal’ concentration of specific antigen and APC (i.e. conditions that induce maximal proliferation of T‐cell clones in vitro) will proliferate and synthesize cytokines, including interleukin‐2 (IL‐2), IL‐4, IL‐5, interferon‐γ (IFN‐γ) and tumour necrosis factor‐α (TNF‐α). These responses are transient, but can be re‐induced indefinitely by periodic (weekly) stimulation, a fact that allows long‐term expansion of antigen‐specific T cells in vitro. However, exposure to high dose antigen (‘tolerizing conditions’) can result in long‐term proliferative unresponsiveness, with varied effects on cytokine production.8–10
It is important to distinguish between the initial phase of tolerance induction, investigated in this study, and the subsequent established tolerant state. Previous studies have shown abundant secretion of IFN‐γ and IL‐4 by human T cells during tolerance induction, with proliferation and IL‐4 (but not IFN‐γ) responses becoming suppressed in established tolerance.8
The induction of tolerance by high antigen concentration is accompanied by enhanced expression of mRNA for TNF‐α, IL‐8, macrophage inflammatory protein (MIP)‐1α, MIP‐1β, although secretion of the corresponding proteins does not necessarily follow, 11 suggesting that in tolerance some post‐transcriptional mechanism is regulating cytokine secretion.
Previous studies on tolerance in cloned T‐cell populations from mouse or man have detected cytokine production by enzyme‐linked immunosorbent assay (ELISA) or reverse transcription–polymerase chain reaction (RT‐PCR). Such approaches cannot discriminate between low expression by many cells and high expression by a few cells, nor inform on coexpression of different cytokines by the same cell.
For these reasons, we investigated single cell expression of cytokines during antigenic stimulation and tolerance induction in human CD4+ T‐cell clones.
MATERIALS AND METHODS
T‐cell clones
Human CD4+ T‐cell clone AC1.112 was maintained by weekly stimulation with irradiated HLA‐DR11+ peripheral blood mononuclear cells (PBMC; 3500 rads) or Epstein–Barr virus (EBV) ‐transformed lymphoblastoid cell line ACE (7000 rads) plus 5 μg/ml of Der p II peptide (28–40). Influenza haemagglutinin (HA) ‐specific human T‐cell clone HA1.713 was maintained by weekly stimulation with irradiated HLA‐DR1+ PBMC or EBV‐transformed lymphoblastoid cell line L‐NAT and 1 μg/ml HA peptide (306–318). T cells were used 7–8 days after re‐stimulation.
Stimulations
Cells were washed and incubated at 105−106/ml in fresh RPMI‐1640 supplemented with heat‐inactivated 5% human serum type AB (RPMI/5). Cells were stimulated with peptide antigen and HLA‐matched irradiated APC or with phorbol 12‐myristate 13‐acetate (PMA; 50–10 ng/ml) and ionomycin (500–100 ng/ml) (PI). Cytokine secretion was inhibited by treatment with 10 μg/ml brefeldin A (last 2 hr of incubation) or 2 μm monensin (last 4 hr). These secretion inhibitors produced similar accumulation of intracellular cytokines (data not shown).
Intracellular cytokine staining
Stimulated cells were washed in phosphate‐buffered saline (PBS) and fixed for 20 min at room temperature in 2% formaldehyde in PBS. After a further wash, fixed cells were resuspended in PBS containing 1% bovine serum albumin (BSA) and 0·1% sodium azide. Fixed cells were permeabilized by incubation in PBS containing 1% (w/v) BSA or fetal calf serum (FCS; v/v), 0·1% (w/v) saponin and 0·1% (w/v) sodium azide (permeabilization buffer) for 10 min at room temperature.
Antibodies
The following monoclonal antibodies were used to detect intracellular cytokines: fluorescein isothiocyanate (FITC) ‐conjugated 4S.B3 for IFN‐γ (Pharmingen, c/o Becton-Dickinson UK Ltd, Cowley, UK); phycoerythrin (PE) ‐conjugated 8D4‐8 for IL‐4 (Pharmingen); PE‐conjugated TRFK‐5 for IL‐5 (Pharmingen); 156.9.1 for TNF‐α, either directly FITC‐conjugated (kindly provided by Dr Milton Rossman, University of Pennsylvania Medical Center, Philadelphia, PA) or by indirect staining using FITC‐conjugated goat anti‐mouse antibody (Sigma-Aldrich Co. Ltd, Poole, Dorset, UK). Antibodies were diluted in permeabilization buffer and incubated with permeabilized cells for 30 min at room temperature. Positive staining was determined using isotype‐matched controls (Sigma, Pharmingen) and by comparing the histograms of stimulated and unstimulated cultures.
Flow cytometry
A Coulter EPICS Elite flow cytometer with argon laser and DOS elite software were used for data acquisition. Electronic compensation was used for all FITC/PE stains. Data were analysed using elite for Windows software. Events were gated using a lymphocyte gate based on forward and side scatter and confirmed by backgating of positive cells. Isotype‐matched controls and internal time 0 controls were used to define positive populations.
RESULTS
Intracellular cytokine staining allows single‐cell analysis during narrow time windows after stimulation and is more discriminating than ELISA, which provides a cumulative measure of total secretion. Also, coexpression of different cytokines can be studied. We thought of using intracellular cytokine staining to investigate possible differences in cytokine expression between cells stimulated for activation or tolerance during the initial phase of tolerance induction.
We used clone AC1.1, an HLA‐DR11+ restricted CD4+ T clone specific for the house dust mite‐derived allergen Der p II. Secretion of IFN‐γ, IL‐4 and IL‐5 and culture conditions inducing optimal stimulation or tolerance had been determined previously12 (unpublished results). The time required for detection of intracellular cytokines was determined by incubating resting cells (7 days after the last re‐stimulation) at 37° for varying time‐intervals in RPMI/5 with antigen or PMA (50 ng/ml) and ionomycin (500 ng/ml) and cytokine secretion inhibitor. Cells were fixed in 2% formaldehyde, permeabilized in 0·1% saponin and immunostained with directly conjugated antibodies specific for IFN‐γ, IL‐4 and IL‐5, and indirectly for TNF‐α. The percentage of cells expressing cytokines was assessed by flow cytometric analysis, by setting regions based on isotype‐matched controls.
As shown in Table 1, TNF‐α expression peaked at 3 hr after PI stimulation, followed by IFN‐γ in 61% of cells at 3–4 hr, IL‐4 and IL‐5 in 60–64% cells at 4 hr. Antigen stimulation under optimal conditions for proliferation induced these cytokines in fewer cells, with slower kinetics.
Table 1.
Kinetics of cytokine expression by a human T‐cell clone
| Stimulation time (hr) | ||||||||
|---|---|---|---|---|---|---|---|---|
| Stimulus | 0* | 1 | 2 | 3 | 4 | 5 | 6 | |
| IFN‐γ | PI | 0 | 2 | 33 | 61 | 59 | – | – |
| Ag | 2 | 2 | 3 | 6 | 6 | 27 | 13 | |
| TNF‐α | PI | 0 | 37 | 15 | 89 | 77 | – | – |
| Ag | 2 | 5 | 5 | 14 | 5 | 13 | 13 | |
| IL‐4 | PI | 0 | 0 | 35 | 50 | 60 | – | – |
| Ag | 0 | 1 | 15 | 11 | 12 | 9 | 15 | |
| IL‐5 | PI | 0 | 0 | 17 | 56 | 64 | – | – |
| Ag | – | 1 | 2 | 9 | 10 | 5 | 22 | |
AC1.1 cells were stimulated with irradiated APC and 5 µg/ml Der p II peptide (28–40) (Ag) or PI. At the indicated times the cells were fixed, permeabilized and stained for cytokines.
Percentages of cells expressing IFN‐γ, TNF‐α, IL‐4 and IL‐5 were defined based on isotype‐matched controls.
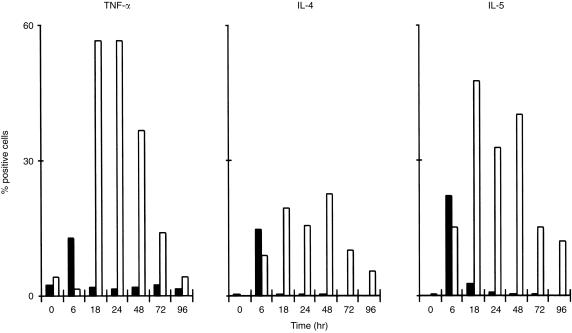
Using another human CD4+ T‐cell clone (HA1.7, specific for influenza virus HA epitope 306–318) antigen at concentrations optimal for proliferation induced peak IFN‐γ expression at 4–8 hr, while TNF‐α peaked at 2–4 hr. Again, PI induced expression of these cytokines in a higher proportion of cells (data not shown). In a separate experiment, cultures were monitored for up to 96 hr and aliquots of cells stimulated with antigen at time 0 were ‘superstimulated’ with PI during the last 4 hr before harvest. As shown in Fig. 1, expression of TNF‐α, IL‐4 and IL‐5 after antigen stimulation reverted to prestimulation levels by 18–24 hr. Responses induced by superstimulation did not decrease for 2–3 days, ruling out deterioration of cultures. Interestingly, the peak of antigen‐induced cytokine expression at 6 hr corresponded to decreased responses to PI superstimulation, suggesting a negative interference between different activation pathways.
Figure 1.
Antigen‐stimulated expression of cytokines is down‐regulated within 24 hr. Human AC1.1 T cells obtained 1 week after antigen stimulation were stimulated with specific antigen Der p II peptide (28–40) at 5 μg/ml. Control cultures were superstimulated with PI during the last 4 hr of incubation. Secretion‐blocked, fixed and permeabilized cells were stained for TNF‐α, IL‐4 and IL‐5. Bars represent percentage of positive cells defined based on isotype‐matched controls (solid bars, antigen only; hollow bars, superstimulation with PI).
Heterogeneity of cloned CD4+ T cells
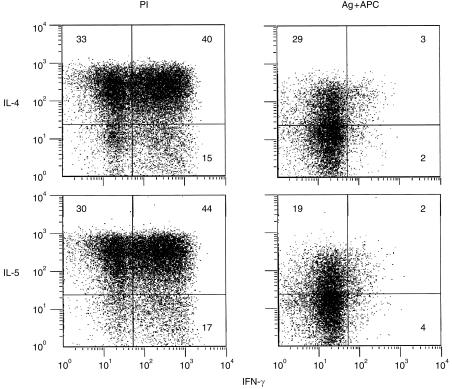
Activation of AC1.1 cells by antigen or PI induced different patterns of coexpression of IFN‐γ and IL‐4 or IFN‐γ and IL‐5 (Fig. 2). PI induced 40% and 44% of coexpressers for IFN‐γ/IL‐4 and IFN‐γ/IL‐5, respectively, while antigen induced only 3% and 2% double expressers, respectively, and similar results were obtained at earlier and later time‐points. The different pattern cannot be attributed simply to weaker stimulation by antigen, as 29% of cells expressed IL‐4 without IFN‐γ, and 19% IL‐5 without IFN‐γ. This result rather implies that within an asynchronously growing clonal population there are functional differences for cytokine expression, and that independent activation pathways for different cytokines can be triggered in different combinations according to stimulus. With either stimulus, a fraction of cells remained negative, although fewer were negative after PI.
Figure 2.
Co‐expression of IFN‐γ and IL‐4 or IFN‐γ and IL‐5 varies with activation stimulus and demonstrates functional heterogeneity of cloned cells. AC1.1 T cells were treated as described for Table 1. Dot plots show coexpression of IFN‐γ and IL‐4 or IFN‐γ and IL‐5 after stimulation for 4 hr with PI or with antigen (Ag; 5 µg/ml) and APC. Numbers in quadrants indicate percentage of total lymphocyte‐gated cells.
Cytokine expression during the initial phase of tolerance induction
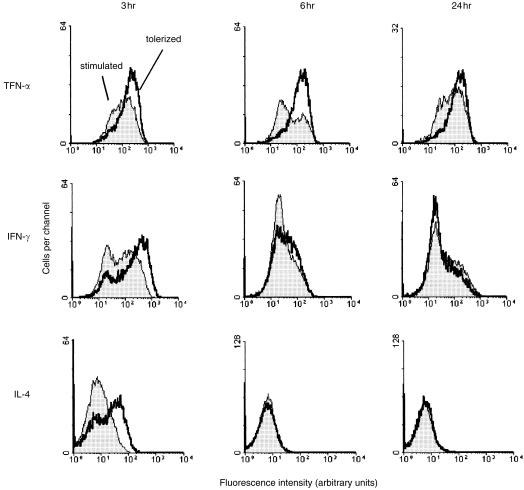
AC1.1 cells can be tolerized by incubation with antigen Der p II peptide (28–40) at high concentration (100 μg/ml). We investigated the expression of TNF‐α, IFN‐γ, IL‐4 and IL‐5 by tolerized cultures compared with controls stimulated with the optimal proliferation‐inducing dose of 5 µg/ml. After 3, 6 and 24 hr all cultures were treated for a further 4 hr with the secretion inhibitor monensin. Aliquots were, at the same time, stimulated with PI, to explore possible differences in the response of tolerized cells. Percentages of cells positive for IFN‐γ, TNF‐α, IL‐4 and IL‐5 were defined based on control untreated cells at time 0.
Similar cytokine expression profiles were seen in stimulated and tolerized groups, with peaks for TNF‐α at 3 hr and at 6 hr for IFN‐γ, IL‐4 and IL‐5. However tolerized cultures that were superstimulated with PI had higher percentages of TNF‐α and IFN‐γ expressing cells at 3 and 6 hr compared with stimulated cultures, while at 24 hr this response was weaker (Fig. 3). Differences in the kinetics of expression of IL‐4 and IL‐5 between tolerized and stimulated cells were less pronounced.
Figure 3.
Stimulation and tolerance induction by specific antigen induce similar cytokine expression in cloned CD4+ T cells. AC1.1 T cells harvested 1 week after antigen stimulation were incubated with specific antigen Der p II peptide (28–40) at 5 μg/ml (stimulating concentration) or at 100 μg/ml (tolerizing concentration). At 3, 6 and 24 hr PI and monensin were added for a further 4 hr incubation. Cells were then fixed, permeabilized and stained for IFN‐γ,TNF‐α and IL‐4. Less than 1% cells were positive for any of these cytokines at time 0 (data not shown). Stimulated or tolerized control cultures which received monensin alone had similar cytokine profiles at all times (data not shown).
Cytokine expression in response to repeated stimuli
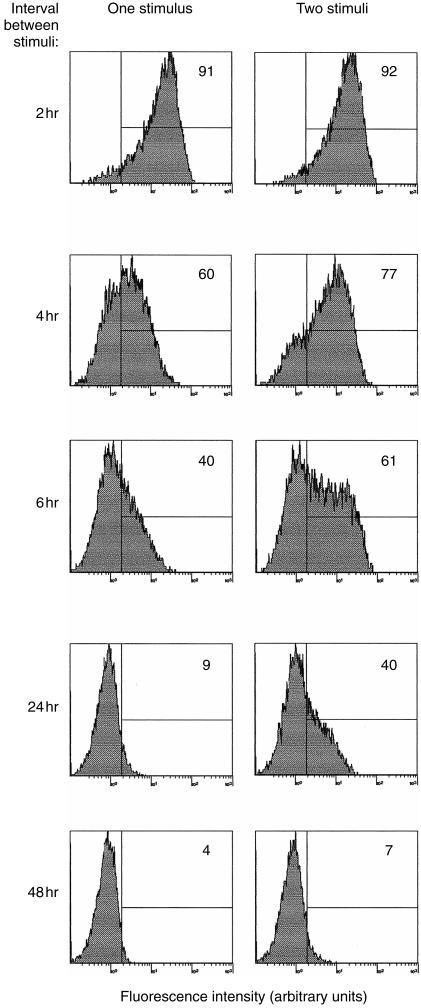
Since we had seen a reduced response to PI following antigen stimulation, we investigated whether two consecutive PI stimuli would result in a similar response. Cloned T cells HA1.7 were stimulated with PI for varying time‐intervals, and then incubated for 4 hr with PI and monensin, or monensin alone. Expression of IFN‐γ was then measured (Fig. 4). Repeat stimulation within 2 hr did not cause significant enhancement of the nearly maximal (91–92%) IFN‐γ response to PI. A definite response to a second PI stimulus could be measured between 4 and 48 hr (increases of IFN‐γ‐positive cells between 3% and 31%). However, by 48 hr only a small fraction of cells responded to the second stimulus, even when the IFN‐γ expression induced by the first stimulus had disappeared. This refractoriness was not due to deterioration of the cultures as CD4 expression, which is decreased upon activation, was starting to return in these non‐responsive cells (data not shown). These findings suggest that cytokine induction is coupled with a transient non‐responsive state.
Figure 4.
Down‐regulation of IFN‐γ expression and refractory state following PI stimulation. HA1.7 cells were stimulated with PI for 2, 4, 6, 24, or 48 hr, then re‐stimulated for 4 hr with PI, in the presence of monensin (‘two stimuli’) or incubated with monensin alone for 4 hr (‘one stimulus’). Fixed, permeabilized cells were stained for IFN‐γ. Numbers in histograms represent percentages of positive cells based on isotype‐matched controls.
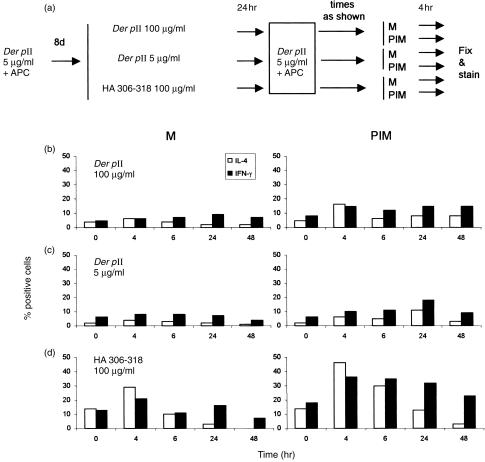
Since specific antigen is the most relevant physiological stimulus for T cells, we investigated how tolerized or stimulated T cells would respond to a second treatment with antigen and APC 24 hr after tolerance induction or stimulation. AC1.1 cloned T cells harvested 8 days after antigen stimulation were (a) tolerized with 100 μg/ml of Der p II peptide (28–40) or (b) stimulated with 5 μg/ml of the same peptide. Control AC1.1 cells (c) were ‘mock tolerized’ by incubation with 100 μg/ml of irrelevant HA peptide (306–318). After 24 hr, cells were extensively washed and re‐stimulated with specific antigen at 5 μg/ml for 0, 4, 6, 24 and 48 hr, followed by a 4‐hr secretion block with 2 μm monensin alone or PI stimulation combined with secretion block (to superstimulate residual cytokine expression capability). Expression of IFN‐γ and IL‐4 is shown in Fig. 5. A major proportion of recently stimulated or tolerized cells did not respond to antigen stimulation over a period of 0–48 hr. In contrast, mock tolerized cells responded to antigen stimulation, with peak responses at 4 hr. Both tolerized and recently stimulated cells had reduced expression of IL‐4 and IFN‐γ in response to specific antigen, and limited enhancement after PI stimulation.
Figure 5.
Cytokine expression in response to antigen re‐stimulation in cells recently tolerized or stimulated. Cloned AC1.1 cells were treated as outlined in (a). Resting cells were incubated for 24 hr with (b) specific antigen Der p II peptide (28–40) at 100 μg/ml; (c) Der p II peptide (28–40) at 5 μg/ml, or (d) irrelevant peptide HA (306–318) at 100 μg/ml. After extensive washing, all three groups were stimulated for various time‐intervals with Der p II at 5 μg/ml (second antigenic stimulus), then incubated for 4 hr with either PI and monensin (PIM) or monensin alone (M). Histograms show percentages of cells positive for IFN‐γ and IL‐4, based on matched isotype controls.
DISCUSSION
This study concerns previously characterized human CD4+ T‐cell clones which, after long‐term culture in vitro, might not be necessarily representative of the majority of T cells undergoing activation or tolerance in vivo. Their properties can be analysed in terms of clonal heterogeneity, responses during the initial phase of tolerance induction and refractory period following stimulation.
Heterogeneity
Analysis of intracellular coexpression of IFN‐γ compared to IL‐4 or IL‐5 revealed independent induction and functional heterogeneity of human cloned CD4+ cells. PI stimulation induced cell subsets expressing widely different proportions of these cytokines and although we show that kinetics of expression for each cytokine are different, the simultaneous coexistence of cells expressing IL‐4 or IFN‐γ or both demonstrates that the clonal population is not homogeneous. Similar patterns were seen at earlier and later time‐points (data not shown) thus suggesting that these differences are unlikely to derive from just a statistical distribution of stimulus intensity and response variability. Two interpretations are possible. First, cells in a clonal population may be in functionally different states that modify the response to activating stimuli (perhaps the phase of the cell cycle of individual cells, metabolic state, inducible changes in signalling pathways including different methylation of cytokine genes/promoters or exhaustion/inactivation of transcription factors). Alternatively the variation in cytokine expression could indeed reflect the statistical distribution of the intensity of stimulation at the level of TCR and other downstream signal transduction molecules, but then different proportions of TCR complexes on each cell would be preset to activate different cytokines. Either scenario requires some functional heterogeneity to pre‐exist in the responding cells before stimulation.
Heterogeneity of cytokine expression in cloned mouse T cells was reported previously in different systems.14–16 This study shows that it is also a feature of human T helper type 0 (Th0) clones.
Cytokine responses during the initial phase of tolerance induction
We have studied the intracellular expression of IL‐4, IL‐5, IFN‐γ and TNF‐α in human CD4+ T‐cell clones after stimulation with specific antigen or PMA plus ionophore, as well as after tolerogenic high‐dose antigen.1 Previous studies have shown that both induction of proliferation by stimulation with low antigen concentrations (optimal for proliferation) and induction of tolerance by exposure to a high concentration of antigen are accompanied by cytokine synthesis, 9 although, once tolerance is established, cloned human cells secrete IFN‐γ but not IL‐4 in response to further antigen stimulation. (This contrasts with murine model systems where IL‐4 responses have been shown to persist in tolerized T cells.17) These studies used ELISA and RT‐PCR for cytokine detection, and could not measure the percentage of responding cells within the stimulated population, nor determine coexpression of cytokines at the single cell level. They gave instead an integrated measure of overall cytokine induction, which appeared adequate to describe cloned T‐cell populations. However, flow cytometric analysis showed a more complex picture.
During the initial phase of tolerance induction, intracellular cytokine production profiles of cloned human CD4+ T cells resembled those of cells stimulated by an activating antigen concentration. We observed a quantitative difference in cytokine expression between tolerized and conventionally stimulated cells, which could simply be explained in terms of intensity of stimulus. An underlying difference was revealed by superstimulation with PI, which showed an early and transiently enhanced kinetics of response of cells being tolerized. These results are in line with findings that during tolerance induction by high‐dose peptide antigen or staphylococcal enterotoxin, CD4+ T‐cell clones secrete high levels of IFN‐γ and IL‐4 (higher than those seen with concanavalin A or anti‐CD3 and PMA).9 Perhaps signal integration by accumulation of (secreted–consumed) cytokines in ELISA or their mRNA in PCR assays affords higher sensitivity to small differences in individual cell responses to antigen stimulation, at the expense of time and cell subset resolution.
In our experiments, stimulation and tolerance induction with antigen did not induce cytokine expression in as many cells as PI. Antigen stimulation followed by PI within a few hours elicited more cytokine expression than antigen alone controls, showing that the potential for cytokine production was not fully engaged by antigen in all cells. This can be related to the observation that human allergen‐specific Th0 and Th2 clones made anergic by peptide treatment will not secrete IL‐2, IL‐4, IL‐5 and IL‐13 upon restimulation with peptide, but will express them after stimulation with phorbol ester and calcium ionophore, 8 implying that the latter treatment, which bypasses the TCR/CD3 complex, is able to activate a proportion of cells that are not sensitive to antigen.
Refractory period for cytokine responses following stimulation
A less than maximal response or a refractory state was seen when a stimulus for cytokine production was applied 24–48 hr after a previous stimulus for activation or tolerance induction, both with peptide antigen and with PI. Using two stimulations with PI we observed that down‐regulation of IFN‐γ production preceded the development of refractoriness to a second stimulus. Since this refractory state occurs after treatment with both low‐ and high‐dose antigen, which lead to stimulation and tolerance, respectively, it is uncoupled from induction of long‐term tolerance. In fact, long‐term tolerized cells have been shown to express IFN‐γ upon stimulation.9 Down‐regulation of the TCR/CD3 complex, a known consequence of antigen stimulation or tolerance induction, is unlikely to be involved, since PI activation bypasses the TCR/CD3 complex. Thus both stimulation for activation and tolerance induction are followed, in the short term, by a refractory period.
It is now established that Th0, Th1 and Th2 clones can all be tolerized, 1, 10 and IL‐2 expression is always suppressed. Since Th1/Th2 discrimination is based on IL‐2 and IFN‐γ versus IL‐4 and IL‐5 expression, tolerance and a putative Th1 to Th2 conversion may appear related, although tolerized human Th0 and Th1 clones generally retain IFN‐γ responses to antigen.9
Acknowledgments
We wish to thank Professor B. Askonas for comments on the manuscript. Peptides were kindly provided by Professor D. Wraith. The antibody 156.9.1 was provided by Dr M. Rossman; A. Rae helped acquire flow cytometric data. The Wellcome Trust, the Medical Research Council and the British Lung Foundation funded this work.
Glossary
Abbreviations
- M
monensin
- PI
phorbol 12‐myristate 13‐acetate and ionomycin
REFERENCES
- 1.Lamb JR, Skidmore BJ, Green N, Chiller JM, Feldmann M. Induction of tolerance in influenza virus‐immune T lymphocyte clones with synthetic peptides of influenza hemagglutinin. J Exp Med. 1983;157:1434. doi: 10.1084/jem.157.5.1434. [DOI] [PMC free article] [PubMed] [Google Scholar]
- 2.Ryan KR, Evavold BD. Persistence of peptide‐induced CD4+ T cell anergy in vitro. J Exp Med. 1998;187:89. doi: 10.1084/jem.187.1.89. [DOI] [PMC free article] [PubMed] [Google Scholar]
- 3.Sloan Lancaster J, Evavold BD, Allen PM. Induction of T‐cell anergy by altered T‐cell‐receptor ligand on live antigen‐presenting cells. Nature (London) 1993;363:156. doi: 10.1038/363156a0. [DOI] [PubMed] [Google Scholar]
- 4.Tsitoura DC, Holter W, Cerwenka A, Gelder CM, Lamb JR. Induction of anergy in human T helper 0 cells by stimulation with altered T cell antigen receptor ligands. J Immunol. 1996;156:2801. [PubMed] [Google Scholar]
- 5.O'Hehir RE, Lamb JR. Induction of specific clonal anergy in human T lymphocytes by Staphylococcus aureus enterotoxins. Proc Natl Acad Sci USA. 1990;87:8884. doi: 10.1073/pnas.87.22.8884. [DOI] [PMC free article] [PubMed] [Google Scholar]
- 6.Williams ME, Shea CM, Lichtman AH, Abbas AK. Antigen receptor‐mediated anergy in resting T lymphocytes and T cell clones. Correlation with lymphokine secretion patterns. J Immunol. 1992;149:1921. [PubMed] [Google Scholar]
- 7.Madrenas J, Chau LA, Smith J, Bluestone JA, Germain RN. The efficiency of CD4 recruitment to ligand‐engaged TCR controls the agonist/partial agonist properties of peptide‐MHC molecule ligands. J Exp Med. 1997;185:219. doi: 10.1084/jem.185.2.219. [DOI] [PMC free article] [PubMed] [Google Scholar]
- 8.Yssel H, Fasler S, Lamb J, De Vries JE. Induction of non‐responsiveness in human allergen‐specific type 2 T helper cells. Curr Opin Immunol. 1994;6:847. doi: 10.1016/0952-7915(94)90003-5. [DOI] [PubMed] [Google Scholar]
- 9.O'Hehir RE, Yssel H, Verma S, De Vries JE, Spits H, Lamb JR. Clonal analysis of differential lymphokine production in peptide and superantigen induced T cell anergy. Int Immunol. 1991;3:819. doi: 10.1093/intimm/3.8.819. [DOI] [PubMed] [Google Scholar]
- 10.Fasler S, Aversa G, Terr A, Thestrup Pedersen K, De Vries JE, Yssel H. Peptide‐induced anergy in allergen‐specific human Th2 cells results in lack of cytokine production and B cell help for IgE synthesis. Reversal by IL‐2, not by IL‐4 or IL‐13. J Immunol. 1995;155:4199. [PubMed] [Google Scholar]
- 11.Schall TJ, O'Hehir RE, Goeddel DV, Lamb JR. Uncoupling of cytokine mRNA expression and protein secretion during the induction phase of T cell anergy. J Immunol. 1992;148:381. [PubMed] [Google Scholar]
- 12.Verhoef A, Higgins JA, Thorpe CJ, et al. Clonal analysis of the atopic immune response to the group 2 allergen of Dermatophagoides spp. identification of HLA‐DR and – DQ restricted T cell epitopes. Int Immunol. 1993;5:1589. doi: 10.1093/intimm/5.12.1589. [DOI] [PubMed] [Google Scholar]
- 13.Lamb JR, Eckels DD, Lake P, Woody JN, Green N. Human T‐cell clones recognize chemically synthesized peptides of influenza haemagglutinin. Nature (London) 1982;300:66. doi: 10.1038/300066a0. [DOI] [PubMed] [Google Scholar]
- 14.Emilie D, Peuchmaur M, Barad M, et al. Visualizing interleukin 2 gene expression at the single cell level. Eur J Immunol. 1989;19:1619. doi: 10.1002/eji.1830190915. [DOI] [PubMed] [Google Scholar]
- 15.Openshaw P, Murphy EE, Hosken NA, et al. Heterogeneity of intracellular cytokine synthesis at the single‐cell level in polarized T helper 1 and T helper 2 populations. J Exp Med. 1995;182:1357. doi: 10.1084/jem.182.5.1357. [DOI] [PMC free article] [PubMed] [Google Scholar]
- 16.Itoh Y, Germain RN. Single cell analysis reveals regulated hierarchical T cell antigen receptor signaling thresholds and intraclonal heterogeneity for individual cytokine responses of CD4+ T cells. J Exp Med. 1997;186:757. doi: 10.1084/jem.186.5.757. [DOI] [PMC free article] [PubMed] [Google Scholar]
- 17.Gajewski TF, Lancki DW, Stack R, Fitch FW. ‘Anergy’ of TH0 helper T lymphocytes induces downregulation of TH1 characteristics and a transition to a TH2‐like phenotype. J Exp Med. 1994;179:481. doi: 10.1084/jem.179.2.481. [DOI] [PMC free article] [PubMed] [Google Scholar]


