Abstract
Immune responses can be classified, according to the predominant cytokines involved, into type 1 (featuring interferon-γ, IFN-γ) and type 2 (featuring interleukin-4, IL-4); imbalance between type 1 and type 2 cytokine compartments has been implicated in many human diseases. Levamisole is a drug with an unknown mode of action that has been used to boost immunity in infectious diseases including leprosy, and in some cancers. To test the hypothesis that levamisole acts by inducing a shift to a type 1 immune response, we used Brown Norway (BN) rats, which are markedly biased to type 2 responses. BN rats treated with levamisole showed a dose-dependent rise in serum IFN-γ and fall in serum immunoglobulin E (IgE) level. Detailed analysis of cytokine gene expression showed upregulation of IFN-γ and downregulation of IL-4 messenger RNA. This coincided with marked upregulation of IL-18, a recently characterized cytokine with potent activity in stimulating IFN-γ production. IL-12 was not induced. Further, the type 2 response induced in BN rats by mercuric chloride was markedly attenuated when rats were pretreated with levamisole: there was a 2-log reduction in maximum serum IgE level and marked attenuation of IL-4 gene upregulation. These data indicate that levamisole acts by resetting the immune balance towards a type 1 response via induction of IL-18. Our findings provide a direction for development of more specific immunomodulating therapy.
INTRODUCTION
Manipulation of the immune response in man by drug therapy is useful in autoimmune disease and organ transplantation, where immunosuppression is the aim, and in infectious diseases and cancer, where boosting of the immune response is desirable. Currently available agents are non-specific; more selective forms of therapy would depend upon the precise identification of the cellular subsets and/or mediators to be targeted. One possibility is to manipulate the balance between subsets of T lymphocytes: for example T helper cells have been divided into the Th1-type producing interferon-γ (IFN-γ) and responsible for cell-mediated immunity and the Th2-type producing predominantly interleukin-4 (IL-4) and engaging humoral immunity.1 There is evidence that extreme Th1- or Th2-type immune responses are undesirable: for example, in leprosy where the tuberculoid form of the disease features tissue damage caused by excessive cell-mediated immunity and is associated with a Th1-biased response, and the lepromatous variant is characterized by excessive humoral immunity and failure to eradicate the organisms, with a Th2-biased cytokine phenotype.2, 3 Autoimmune and inflammatory diseases may also be associated with Th1/Th2 bias: for example, insulin-dependent diabetes mellitus (type 1 diabetes)4, 5 and rheumatoid arthritis6–8 feature a predominant Th1 response whereas systemic lupus erythematosus9, 10 and asthma11, 12 are characterized by a Th2 bias. In the context of organ transplantation it has been suggested that acute allograft rejection is a Th1-type phenomenon and that Th2-type responses may favour graft survival.13 Thus, agents which selectively boost either Th1 or Th2 responses may provide powerful means of selective immunotherapy. More recently, the terminology Th1 and Th2 has been superseded by type 1 and type 2, respectively, as other cellular compartments apart from T helper cells can also be subdivided according to the predominant cytokines they produce.14
Levamisole has been used in the treatment of leprosy15, 16 and has also been studied in the treatment of cancer, especially colonic carcinoma.17 We hypothesised that the drug acts by boosting cell-mediated immunity via induction of type 1 cytokines, and we set out to test this using an animal model in which type 1 responses are relatively deficient and the immune response is markedly skewed towards the type 2 end of the spectrum.
Brown Norway (BN) rats have high levels of serum immunoglobulin E (IgE) and relatively deficient cell-mediated immunity, indicating a bias towards a type 2 immune response. Treatment of BN rats with subcytotoxic doses of mercuric chloride (HgCl2) leads to a vigorous autoimmune response dominated by type 2 cytokines.18, 19 We now show that treatment of naive BN rats with levamisole leads to suppression of serum IgE and elevation of serum IFN-γ, indicating a shift towards a type 1 immune response. Pretreatment with levamisole abrogated the type 2 immune response induced by HgCl2. We show that this boosting of the type 1 compartment was achieved via induction of IL-18 gene expression: IL-18 is a recently described cytokine produced by cells of the monocyte–macrophage lineage, whose main action is to upregulate expression of IFN-γ, the archetypal type 1 cytokine.20
MATERIALS AND METHODS
Animals
Brown Norway (BN) rats were obtained from OLAC (Bicester, UK). For all experiments, healthy 4–6-week-old sex-matched rats were used.
Chemicals
Levamisole (L[–]-2,3,5,6-tetrahydro-6-phenylimidazo[2,1-b]- thiazole hydrochloride, Sigma Ltd, Poole, UK) was dissolved in distilled water to 1 mg/ml or 10 mg/ml for intraperitoneal injection. Mercuric chloride (HgCl2, AnalaR, BDH Chemicals Ltd, Poole, UK) was dissolved in distilled water to 1 mg/ml for subcutaneous injection.
Experimental protocol
Three sets of experiments were performed:
To test the tolerability of levamisole in rats and test for dose–response effects.
To examine in detail the time course of the response to levamisole.
To test the effect of levamisole pretreatment on the immune response induced by HgCl2.
Experiment 1
Ten BN rats were treated with levamisole at a range of doses, two rats receiving each dose. Rats were injected intraperitoneally with levamisole 0·625, 1·25, 2·5, 12·5 or 25 mg/kg/day for 1 week. Blood samples were taken at 0, 3, 5 and 8 days from a tail vein for assay of serum IgE and IFN-γ. All rats were killed at day 8. Spleens were removed and RNA prepared by the method of Chomczynski21 for analysis of cytokine gene expression.
Experiment 2
Ten BN rats were injected intraperitoneally with levamisole 25 mg/kg/day for 7 days. Blood samples were taken at 0, 3, 5, 8 and 12 days. Groups of two rats were killed at 0, 3, 5, 8 and 12 days and spleens removed for RNA preparation.
Experiment 3
Twenty BN rats were injected subcutaneously with HgCl2 1 mg/kg every other day for five doses. Ten of these rats were pretreated with levamisole 25 mg/kg/day intraperitoneally from −2 to +5 days, the other 10 received HgCl2 alone. Blood samples were taken at 0, 5, 10, 15 and 20 days. Two rats from each group were killed at 0, 5, 10, 15 and 20 days and spleens removed for RNA preparation.
Measurement of serum IgE
Serum IgE levels were determined by enzyme-linked immunosorbent assay (ELISA) as previously described.22 Immunlon 4 microtitre plates (Dynatech, Billingshurst, UK) were coated (overnight at 4°) with anti-IgE monoclonal antibody (mAb) MARE-1 (Serotec Ltd, Oxford, UK) at 2·5–5·0 µg/ml in carbonate buffer (pH 9·6). Extensive plate-washing with phospahte-buffered saline (PBS)/0·05% Tween followed each incubation. Plates were blocked with 5% skimmed milk powder in PBS then incubated with appropriate dilutions (determined in preliminary experiments) of serum samples and standards added in duplicate for 1 hr at 37°. Bound IgE was detected with an alkaline phosphatase-conjugated anti-rat κ and λ light chain antibody (Sigma) diluted to 1/1000 in PBS/1% bovine serum albumin (BSA) (1 hr at 37°). It was followed by the substrate, p-nitrophenyl phosphate (Sigma 104 phosphatase substrate) at 1 mg/ml in 1 m glycine buffer (pH 10·4, 45 min at room temperature). Optical density was read at 405 nm (MR5000 plate reader, Dynatec Lab Systems Ltd, Middlesex, UK) and levels of IgE in samples were determined from a standard curve of purified rat IgE (Serotec).
Measurement of serum IFN-γ
Serum IFN-γ levels were determined by Hbt Rat Gamma Interferon ELISA kit (HyCult biotechnology bv, Uden, Netherlands). Samples and standards were incubated for 3 hr in microtitre wells provided, which were coated with a monoclonal antibody recognizing rat IFN-γ. The wells were then extensively washed. A preformed detector complex consisting of a biotinylated second monoclonal antibody to rat IFN-γ and a streptavidin–alkaline phosphatase conjugate was then added to the wells. After a further incubation of 2 hr, the excess detector complex was removed and a p-nitrophenyl phosphate substrate solution was added. Optical density was read at 405 nm (MR5000 plate reader, Dynatec) and levels of IFN-γ in samples were determined from a standard curve.
Cytokine gene expression
Quantitative polymerase chain reaction (PCR) for IL-4 and IFN-γ was performed with our synthetic RNA construct as described before.19, 23, 24 PCR primers were:
IL-4 sense 5′-TGATGGGTCTCAGCCCCCACCTTGC-3′;
IL-4 antisense 5′-CTTTCAGTGTTGTGAGCGTGGACTC-3′;
IFN-γ sense 5′-ACACTCATTGAAAGCCTAGAAAGTCTG-3′;
IFN-γ antisense 5′-ATTCTTCTTATTGGCACACTCTCTACC-3′.
The products of reverse transcription–PCR (RT–PCR) of synthetic RNA and native IL-4 mRNA were 512 bp and 378 bp, respectively.23, 24 The products of RT–PCR of synthetic RNA and native IFN-γ mRNA were 670 bp and 405 bp, respectively.19 Approximately 2·4 × 109 molecules of synthetic RNA was spiked into each test RNA. Reverse transcription was performed using a kit (Promega, Madison, WI). PCR reactions were performed on a Thermal Cycler (Hybaid Ltd, Middlesex, UK), total volume 25 µl, with 1 µl cDNA, 200 µm each dNTP, 2·5 µl 10 × PCR buffer, 0·4 µm of each PCR primer, and 1 unit of Taq polymerase. PCR conditions were: 94°, 5 min, one cycle; then 32 cycles of 94° for 30 s, 55° for 30 s, 72° for 60 s. PCR products were separated on 2% agarose gels, visualized by ethidium bromide staining, and saved as digital images (ImageStore, Ultra Violet Products Ltd, Cambridge, UK). Intensity of synthetic RNA and cellular RNA specific IL-4 and IFN-γ bands were assayed by Molecular Analyst version 2 computer software (Bio-Rad, Hercules, CA). Standard curves were prepared23 to ensure that amplification of both products was linear and parallel.
Semiquantitative PCR for other cytokines was performed by conducting parallel reactions on each RNA sample: one using primers specific for the cytokine of interest, the other using primers for a ‘housekeeping’ gene, β-actin, the level of expression of which would not be expected to vary between samples.24 Fivefold dilutions of the cDNA were amplified in 25 µl reaction volumes as previously described.19 Primer sequences were:
β-actin sense 5′-ATGCCATCCTGCGTCTGGACCTGGC-3′;
β-actin antisense 5′-AGCATTTGCGGTGCACGATGGAGGG-3′; (607 bp);24
IL-12 sense 5′-CCGATGCCCCTGGAGAAAC-3′;
IL-12 antisense 5′-CCTTCTTGTGGAGCAGCAG-3′ (207 bp);25
IL-18 sense 5′-ACTGTACAACCGCAGTAATACGG-3′;
IL-18 antisense 5′-AGTGAACATTACAGATTTATCCC-3′ (437 bp).26
Twenty-two cycles of PCR were used for β-actin amplification, to avoid saturation. PCR of other cytokines were performed with 35 cycles. The annealing temperature was 55° for β-actin and 57° for all cytokine primer sets. The amount of specific cytokine mRNA was assessed by comparing the intensity of bands on electrophoresis with those produced for β-actin, reactions were repeated on serial fivefold dilutions to allow more accurate subjective comparison of band intensities. In our experience, densitometry adds no additional information to that available when making these comparisons ‘by eye’.19, 23
Statistical analysis
Statistical analysis was performed by systat 7·0 for Windows software (SPSS Inc., Chicago, IL). All data were expressed as mean ± standard error. Serum IgE and IFN-γ levels after levamisole treatment were compared by repeated measures analysis of variance (manova). Post-hoc analyses were performed by separate one-way analysis of variance (anova) and Tukey's method. Statistical significance was taken as P < 0·05.
RESULTS
Levamisole causes dose-dependent rise in serum IFN-γ and suppression of IgE
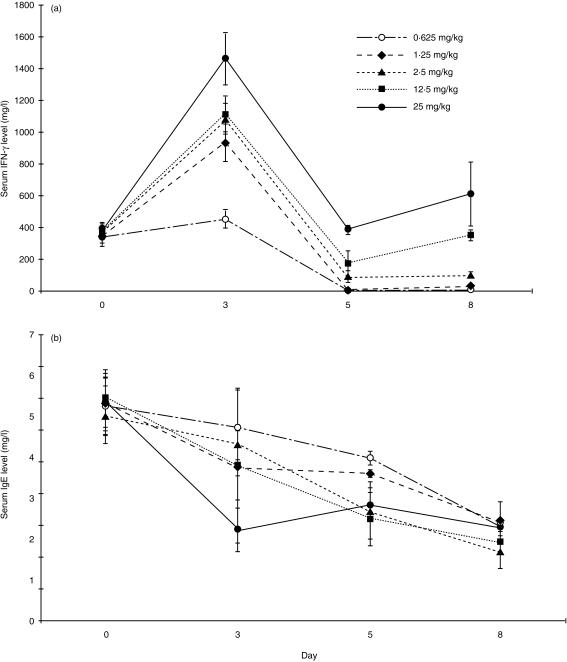
BN rats were treated with levamisole by daily intraperitoneal injection in doses ranging from 0·625 mg/kg/day to 25 mg/kg/day. There was dose-dependent induction of serum IFN-γ (Fig. 1a) and suppression of serum IgE (Fig. 1b), indicating a shift towards the type 1 phenotype. By manova, serum IFN-γ levels on day 3 were significantly higher than on day 0 (P < 0·01), and serum IFN-γ levels on day 3 were higher for rats treated with 25 mg/kg/day of levamisole than other dosages (P < 0·05). Serum IgE levels on day 3, 5, and 8 were all significantly lower than on day 0 (P < 0·05) by manova. Serum IgE levels on day 3 were lower for rats treated with 25 mg/kg/day of levamisole than other dosages (P < 0·02). Because the highest dose of levamisole was well tolerated, this dose was used in subsequent experiments.
Figure 1.
Levamisole causes dose-dependent elevation of serum IFN-γ and suppression of serum IgE. Serum IFN-γ level and (b) serum IgE level by ELISA following treatment of 10 BN rats with levamisole 0·625–25 mg/kg/day intraperitoneally. There was a dose-dependent rise in serum IFN-γ and fall in serum IgE.
Levamisole enhances IFN-γ gene expression and serum IFN-γ
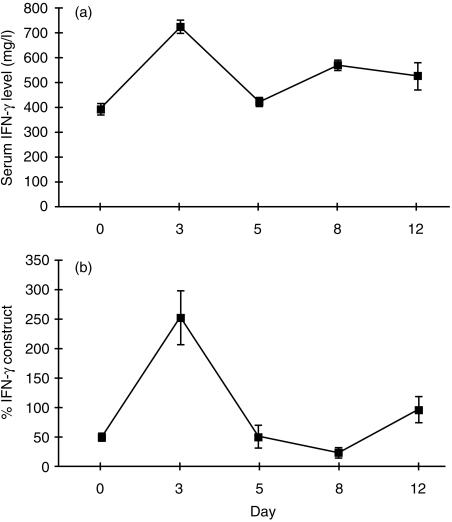
As in the first experiment, serum levels of IFN-γ rose by day 3 after levamisole (Fig. 2a). A detailed analysis of cytokine gene expression after levamisole was performed. Splenic IFN-γ gene expression, determined by strictly quantitative PCR with an internal RNA standard, showed upregulation by day 3 after levamisole, then fluctuated (Fig. 2b).
Figure 2.
Levamisole causes elevation of serum IFN-γ and enhanced splenic IFN-γ gene expression. (a) Serum IFN-γ level by ELISA and (b) splenic IFN-γ gene expression by quantitative PCR, in 10 BN rats given levamisole 25 mg/kg/day intraperitoneally. There is a rise in serum IFN-γ by day 3, with close concordance with induction of splenic IFN-γ gene expression.
Levamisole suppresses IL-4 gene expression and serum IgE
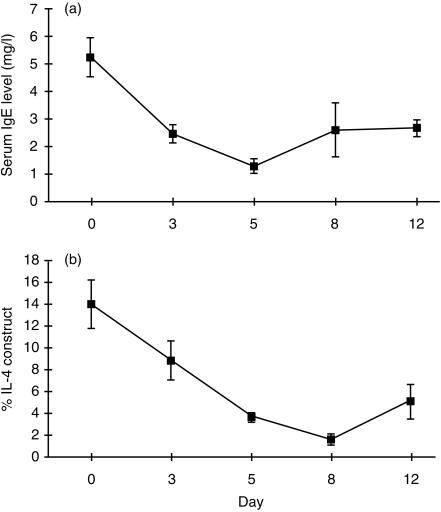
As in the first experiment, serum IgE was markedly suppressed by levamisole. The fall in serum IgE after levamisole (Fig. 3a) correlated closely with suppression of splenic IL-4 gene expression, determined by strictly quantitative PCR with an internal RNA standard (Fig. 3b).
Figure 3.
Levamisole causes suppression of serum IgE and of splenic IL-4 gene expression. (a) Serum IgE by ELISA and (b) IL-4 gene expression by quantitative PCR in 10 BN rats given levamisole 25 mg/kg/day intraperitoneally. Following levamisole there is a fall in serum IgE level by day 3 reaching a nadir at day 5, with close concordance with downregulation of splenic IL-4 gene expression.
Levamisole induces IL-18, but not IL-12, gene expression
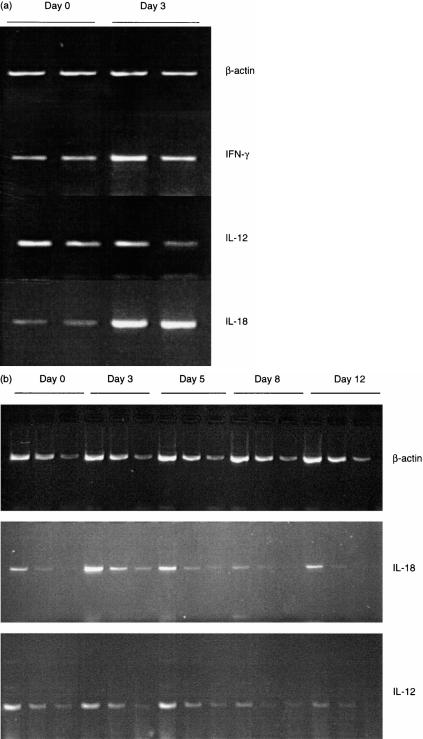
Serial analysis of splenic RNA for cytokine gene expression by semiquantitative PCR compared to a housekeeping gene, β-actin, showed that the upregulation of IFN-γ at day 3 after levamisole was accompanied by marked upregulation of IL-18 expression (Fig. 4a). IL-12 expression was not increased. The detailed time course from a separate experiment is shown in Fig. 4(b), where each sample consists of a set of three fivefold dilutions (to avoid saturation of the reaction and allow accurate assessment of the amount of product by comparison of the diluted samples). IL-18 is upregulated by day 3 and then returns to baseline. Expression of IL-12 did not alter significantly before day 8, when it was slightly downregulated (Fig. 4b).
Figure 4.
(a) Levamisole causes upregulation of IL-18, but not IL-12, gene expression. Semiquantitative RT–PCR analysis of splenic mRNA for expression of IFN-γ, IL-12 and IL-18. cDNA was reverse transcribed from splenic mRNA on day 0 (baseline) and day 3 after levamisole 25 mg/kg/day intraperitoneally. Two animals at each time point. As seen with the fully quantitative PCR, IFN-γ is upregulated by day 3. At this time there is marked upregulation of IL-18 but IL-12 is not increased. (b) Levamisole causes early but transient upregulation of IL-18. Semiquantitative RT–PCR analysis of splenic mRNA for expression of IL-18 and IL-12. cDNA was reverse transcribed from splenic mRNA on days 0, 3, 5, 8 and 12 after levamisole 25 mg/kg/day intraperitoneally and was diluted in fivefold steps. PCR was performed on three dilutions for each sample, so that each sample is shown as a set of three lanes. n = 10, two animals at each time point. Representative gel shown: three independent experiments gave identical results. IL-18 is upregulated by day 3 then returns to baseline. IL-12 is not changed until day 8, whereafter it is slightly downregulated.
Levamisole blunts the Th2 response induced in BN rats by HgCl2
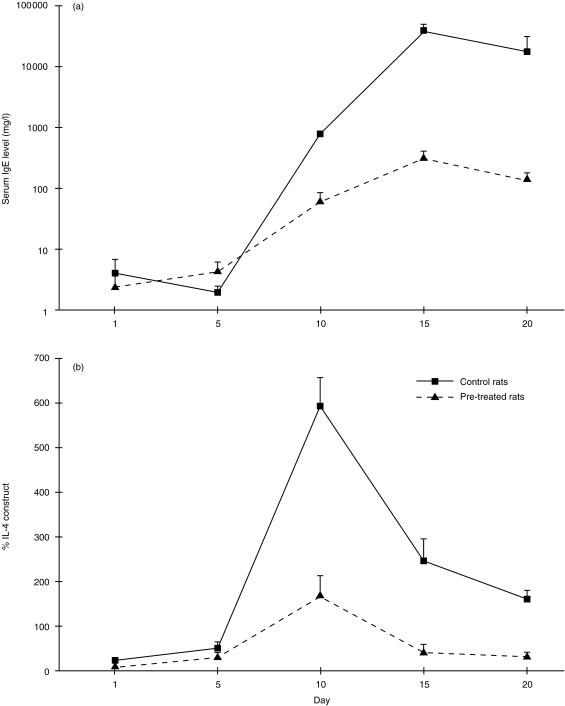
We then examined the effect of levamisole pretreatment on the response to HgCl2, a potent type 2 stimulus. BN rats treated with HgCl2 alone showed marked elevation of serum IgE (Fig. 5a) and enhanced IL-4 gene expression (Fig. 5b, P < 0·001 for each by manova). In comparison, animals pretreated with levamisole and then given HgCl2 showed a 2-log reduction in maximum serum IgE levels (Fig. 5a) and marked attenuation of the induction of splenic IL-4 gene expression (Fig. 5b) (P < 0·05 for each).
Figure 5.
Levamisole blunts the Th2 response induced by HgCl2. Serum IgE concentration by ELISA and IL-4 gene expression by quantitative PCR after HgCl2 in BN rats with (n = 10) or without (n = 10) pretreatment with levamisole. Levamisole-treated rats had 2-log lower peak IgE and markedly attenuated upregulation of IL-4 gene expression.
DISCUSSION
We have shown that levamisole shifts the immune response in BN rats away from the type 2 end of the spectrum, and is capable of blunting the type 2-biased immune response induced by HgCl2. This is achieved by boosting of the type 1 compartment, with enhanced production of the key type 1 cytokine IFN-γ. This key cytokine can be induced via two pathways, one directly via IL-12 and the other involving IL-18, which acts synergistically with IL-12, both these cytokines being produced by monocyte/macrophages.26–28 Our results clearly show induction of IL-18 gene expression; IL-12 expression was not induced. This indicates a highly selective action of levamisole on the immune response, enhanced IL-18 expression resulting in tipping of the type 1/type 2 balance towards the type 1 compartment. It is intriguing that levamisole has been shown to be effective in maintenance of remission in an important form of kidney disease, minimal change nephrotic syndrome (MCNS),29, 30 which predominantly affects children and is an important cause of morbidity and mortality. There is circumstantial evidence that MCNS is associated with a type 2-biased immune response: for example, many affected individuals have elevated serum IgE, and there is a strong association with atopy, which is itself mediated by type 2 cytokines.31, 32 Our data suggest that levamisole's effectiveness in this condition is due to resetting of the type 1/type 2 imbalance, implying that other means of induction of IL-18 may be useful in the therapy of this condition, which is currently managed with non-specific immunosuppression and associated with major treatment-induced morbidity.33, 34
Selective boosting of type 1 responses also has therapeutic potential in cancer, infectious disease, and some autoimmune and inflammatory conditions such as asthma and systemic lupus erythematosus. In situations where precisely the opposite effect is desired, i.e. suppression of type 1 responses and/or boosting of type 2 responses, such as organ transplantation and other autoimmune diseases including rheumatoid arthritis and type I diabetes, measures aimed at suppression of IL-18 expression would be expected to be effective.
Our results highlight an important principle in immunotherapy: if modes of action of currently available agents can be precisely identified, strategies for the development of more potent selective agents can be developed. Rather than the blunderbuss approach to suppression of the immune response which currently dominates clinical practice, future immunotherapy should be aimed at only suppressing those compartments of the immune response which are directly deleterious, whilst maintaining or even boosting the counter-regulatory compartments.
Acknowledgments
C.C. Szeto is a Croucher Foundation Fellow. We would also like to thank Mr Roger Francis and Mr Michael Hill of University of Bristol for taking care of the animals during the experiment.
REFERENCES
- 1.Mosmann TR, Coffman RL. TH1 and TH2 cells: different patterns of lymphokine secretion lead to different functional properties. Annu Rev Immunol. 1989;7:145. doi: 10.1146/annurev.iy.07.040189.001045. [DOI] [PubMed] [Google Scholar]
- 2.Haanen JB, De Waal malevijt R, Res PC, et al. Selection of a human T helper type 1-like T-cell subset by mycobacteria. J Exp Med. 1991;174:583. doi: 10.1084/jem.174.3.583. [DOI] [PMC free article] [PubMed] [Google Scholar]
- 3.Bloom BR, Modlin RL, Salgame P. Stigma variations: observations on supppressor T cells and leprosy. Annu Rev Immunol. 1992;10:453. doi: 10.1146/annurev.iy.10.040192.002321. [DOI] [PubMed] [Google Scholar]
- 4.Heurtier AH, Boitard C. T-cell regulation in murine and human autoimmune diabetes: the role of TH1 and TH2 cells. Diabetes Metab. 1997;23:377. [PubMed] [Google Scholar]
- 5.Cohen IR. The Th1/Th2 dichotomy, hsp60 autoimmunity, and type I diabetes. Clin Immunol Immunopathol. 1997;84:103. doi: 10.1006/clin.1997.4396. [DOI] [PubMed] [Google Scholar]
- 6.Miltenburg AM, Van laar JM, de Kuiper R, Daha MR, Breedveld FC. T cells cloned from human rheumatoid synovial membrane functionally represent the Th1 subset. Scand J Immunol. 1992;35:603. doi: 10.1111/j.1365-3083.1992.tb03260.x. [DOI] [PubMed] [Google Scholar]
- 7.Quayle AJ, Chomarat P, Miossec P, Kjeldsen-Kragh J, Forre O, Natvig JB. Rheumatoid inflammatory T-cell clones express mostly Th1 but also Th2 and mixed (Th0-like) cytokine patterns. Scand J Immunol. 1993;38:75. doi: 10.1111/j.1365-3083.1993.tb01696.x. [DOI] [PubMed] [Google Scholar]
- 8.Van der graaff WL, Prins AP, Dijkmans BA, Van lier RA. Prognostic value of Th1/Th2 ratio in rheumatoid arthritis. Lancet. 1998;351:1931. doi: 10.1016/s0140-6736(05)78615-3. [DOI] [PubMed] [Google Scholar]
- 9.Richaud-Patin Y, Alcocer-Varela J, Llorente L. High levels of TH2 cytokine gene expression in systemic lupus erythematosus. Rev Invest Clin. 1995;47:267. [PubMed] [Google Scholar]
- 10.Funauchi M, Ikoma S, Enomoto H, Horiuchi A. Decreased Th1-like and increased Th2-like cells in systemic lupus erythematosus. Scand J Rheumatol. 1998;27:219. doi: 10.1080/030097498440859. [DOI] [PubMed] [Google Scholar]
- 11.Robinson DS, Hamid Q, Ying S, et al. Predominant TH2-like bronchoalveolar T-lymphocyte population in atopic asthma. N Engl J Med. 1992;326:298. doi: 10.1056/NEJM199201303260504. [DOI] [PubMed] [Google Scholar]
- 12.Kay AB. TH2-type cytokines in asthma. Ann NY Acad Sci. 1996;796:1. doi: 10.1111/j.1749-6632.1996.tb32561.x. [DOI] [PubMed] [Google Scholar]
- 13.Nickerson P, Steurer W, Steiger J, Zheng X, Steele AW, Strom TB. Cytokines and the Th1/Th2 paradigm in transplantation. Curr Opin Immunol. 1994;6:757. doi: 10.1016/0952-7915(94)90081-7. [DOI] [PubMed] [Google Scholar]
- 14.Carter LL, Dutton RW. Type 1 and type 2: a fundamental dichotomy for all T-cell subsets. Curr Opin Immunol. 1996;8:336. doi: 10.1016/s0952-7915(96)80122-1. [DOI] [PubMed] [Google Scholar]
- 15.Kar HK, Bhatia VN, Kumar CH, Sirumban P, Roy RG. Evaluation of levamisole, an immunopotentiator, in the treatment of lepromatous leprosy. Indian J Lepr. 1986;58:592. [PubMed] [Google Scholar]
- 16.Katoch K. Immunotherapy of leprosy. Indian J Lepr. 1996;68:349. [PubMed] [Google Scholar]
- 17.Mutch RS, Hutson PR. Levamisole in the adjuvant treatment of colon cancer. Clin Pharmacol. 1991;10:95. [PubMed] [Google Scholar]
- 18.Mathieson PW. Mercuric chloride-induced autoimmunity. Autoimmunity. 1992;13:243. doi: 10.3109/08916939209004830. [DOI] [PubMed] [Google Scholar]
- 19.Gillespie KM, Saoudi A, Kuhn J, Whittle CJ, Druet P, Mathieson PW. Th1/Th2 cytokine gene expression after mercuric chloride in susceptible and resistant rat strains. Eur J Immunol. 1996;26:2388. doi: 10.1002/eji.1830261018. [DOI] [PubMed] [Google Scholar]
- 20.Ushio S, Namba M, Okura T, et al. Cloning of the cDNA for human IFN-gamma-inducing factor, expression in Escherichia coli, and studies on the biologic activities of the protein. J Immunol. 1996;156:4274. [PubMed] [Google Scholar]
- 21.Chomczynski P, Sacchi N. Single-step method of RNA isolation by acid guanidium thiocyanate–phenol–chloroform extraction. Anal Biochem. 1987;162:156. doi: 10.1006/abio.1987.9999. [DOI] [PubMed] [Google Scholar]
- 22.Tournade H, Pelletier L, Guery JC, et al. Experimental gold-induced autoimmunity. Nephrol Dial Transplant. 1991;6:621. doi: 10.1093/ndt/6.9.621. [DOI] [PubMed] [Google Scholar]
- 23.Gillespie KM, Qasim FJ, Tibbatts LM, Thiru S, Oliveira DBG, Mathieson PW. Interleukin-4 gene expression in mercury-induced autoimmunity. Scand J Immunol. 1995;41:268. doi: 10.1111/j.1365-3083.1995.tb03563.x. [DOI] [PubMed] [Google Scholar]
- 24.McKnight AJ, Barclay AN, Mason DW. Molecular cloning of rat interleukin 4 cDNA and analysis of the cytokine repertoire of subsets of CD4+ T cells. Eur J Immunol. 1991;21:1187. doi: 10.1002/eji.1830210514. [DOI] [PubMed] [Google Scholar]
- 25.Mathieson PW, Gillespie KM. Cloning of a partial cDNA for rat interleukin 12 (IL12) and analysis of IL12 expression in vivo. Scand J Immunol. 1996;44:11. doi: 10.1046/j.1365-3083.1996.d01-279.x. [DOI] [PubMed] [Google Scholar]
- 26.Conti B, Jahng JW, Tinti C, Son JH, Joh TH. Induction of interferon-γ inducing factor in the adrenal cortex. J Biol Chem. 1997;272:2035. doi: 10.1074/jbc.272.4.2035. [DOI] [PubMed] [Google Scholar]
- 27.Micallef MJ, Ohtsuki T, Kohno K, et al. Interferon-gamma-inducing factor enhances T helper 1 cytokine production by stimulated human T cells: synergism with interleukin-12 for interferon-gamma production. Eur J Immunol. 1996;26:1647. doi: 10.1002/eji.1830260736. [DOI] [PubMed] [Google Scholar]
- 28.Yoshimoto T, Okamura H, Tagawa YI, Iwakura Y, Nakanishi K. Interleukin 18 together with interleukin 12 inhibits IgE production by induction of interferon-gamma production from activated B cells. Proc Natl Acad Sci USA. 1997;94:3948. doi: 10.1073/pnas.94.8.3948. [DOI] [PMC free article] [PubMed] [Google Scholar]
- 29.British Association for Pediatric Nephrology. Levamisole for corticosteroid-dependent nephrotic syndrome in childhood. Lancet. 1991;337:1555. [PubMed] [Google Scholar]
- 30.Dayal U, Dayal AK, Shastry JCM, Raghupathy P. Use of levamisole in maintaining remission in steroid-sensitive nephrotic syndrome in children. Nephron. 1994;66:408. doi: 10.1159/000187855. [DOI] [PubMed] [Google Scholar]
- 31.Schulte-Wissermann H, Gortz W, Straub E. IgE in patients with glomerulonephritis and minimal-change nephrotic syndrome. Eur J Pediatr. 1979;131:105. doi: 10.1007/BF00447472. [DOI] [PubMed] [Google Scholar]
- 32.Meadow SR, Sarsfield JK. Steroid-responsive nephrotic syndrome and allergy: clinical studies. Arch Dis Child. 1981;56:509. doi: 10.1136/adc.56.7.509. [DOI] [PMC free article] [PubMed] [Google Scholar]
- 33.Lam CN, Arneil GC. Long term dwarfing effects of corticosteroid treatment for childhood nephrosis. Arch Dis Child. 1968;43:589. doi: 10.1136/adc.43.231.589. [DOI] [PMC free article] [PubMed] [Google Scholar]
- 34.Kimaye SR, Pillai S, Tina LU. Relationship of steroid dose to degree of posterior subcapsular cataracts in nephrotic syndrome. Ann Ophthalmol. 1988;20:225. [PubMed] [Google Scholar]


