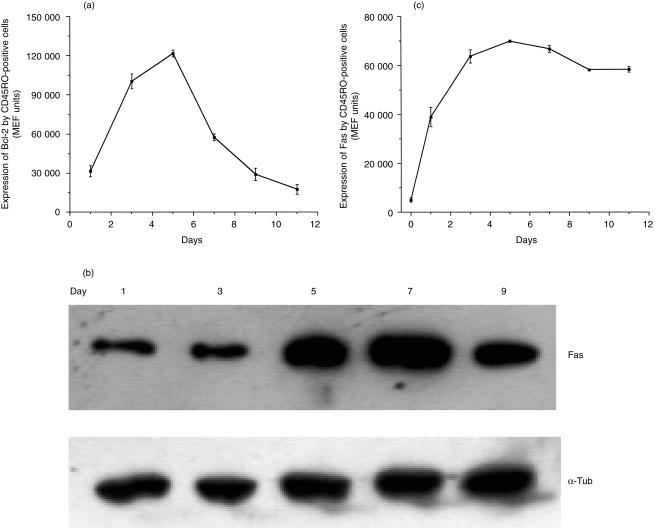
Figure 2.
(a) Representative flow cytometric data evaluating changes in Bcl-2 expression at various time points during an MLR. Cells were dual-labelled to detect Bcl-2 and CD45RO antibodies and gated to allow analysis of the expression of Bcl-2 by the activated CD45RO+ cells. (b) Representative Western blot demonstrating expression of the 45 000 MW Fas protein by peripheral blood lymphocytes harvested at various time intervals from a MLR assay; α-tubulin was also visualized to demonstrate constant protein loading. (c) Representative flow cytometric time course demonstrating Fas expression on the surface of activated lymphocytes during the course of a MLR. These results are expressed as MEF values and show the mean of duplicate determinations; error bars show the SEM.

