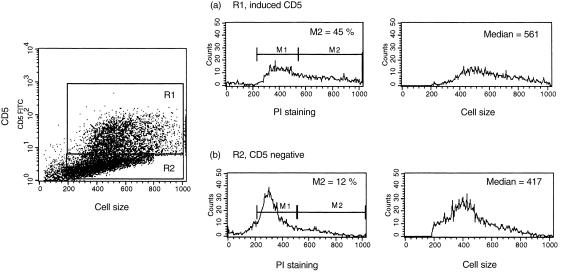
Figure 5.
Simultaneous detection of DNA content and CD5 expression in CD5-negative (CD5neg) B cells following B-cell receptor (BCR) and CD40 engagement. CD5neg B cells were cultured for 3 days with irradiated CD40 ligand (CD40L)/CD32-transfected L cells and anti-immunoglobulin M (anti-IgM) antibody. Cell-surface staining with fluorescein isothiocyanate (FITC)-conjugated anti-CD5 monoclonal antibody (mAb) was followed by fixation, permeabilization and addition of propidium iodide (PI). DNA content was measured in cells that up-regulated CD5 (region 1, R1) and those that remained CD5 negative (region 2; R2). Histogram sets (a) and (b) show PI staining and forward scatter (relative cell size) in cells that induced CD5 and those that remained CD5 negative, respectively. Histogram marker 1 (M1) shows the cells in the G0 and G1 stages, and M2 shows the percentage of cells in the G2 + M and S phases of the cell cycle. The median forward scatter for cells in each region is also indicated.

