

Abstract
This report describes a comparison of immune responses in the peripheral blood and at the site of active disease in cattle 20 weeks after experimental infection with Mycobacterium bovis. Lymphocyte proliferation, and the production of interferon-γ (IFN-γ) and interleukin (IL)-2 were measured in response to tuberculin and a number of mycobacterial antigens, including ESAT-6, MPB64, MPB70, MPB83, hsp 16.1, hsp 65, hsp 70 and the 38 000 MW lipoprotein antigen. The level of transforming growth factor-β (TGF-β) was measured following stimulation of cells with tuberculin. Our results suggest little difference in the responses of peripheral blood and lymph node cells to most of the antigens used. However, tuberculin purified protein derivative (PPD) and ESAT-6 elicited stronger responses in the peripheral blood compared with lymph node cells. Investigation of the responding T-cell subpopulations in the peripheral blood showed that both CD4+ and, to a lesser extent, γδ T-cell receptor-positive (TCR+) T cells contributed to these responses. This is the first report to compare peripheral and local immune responses in bovine tuberculosis. Unlike cases of human tuberculosis where immune activity at the site of disease and anergy in the peripheral blood have been reported, our results suggest that for bovine tuberculosis immune responses occurring in the peripheral blood reflect those at the site of disease.
Introduction
The incidence of bovine tuberculosis is increasing in the British national herd, and the urgency for new and improved cattle vaccines and diagnostic aids has been clearly stated in a recent independent scientific review.1 In order to develop these tools for disease control, a greater understanding is required of the nature and specificity of the immune responses that occur during Mycobacterium bovis infection. The vast majority of immunological studies of tuberculosis in humans and in cattle have, by necessity, examined the immune responses in the peripheral blood, which is the most accessible source of lymphocytes in the living host.
There have been few studies of human tuberculosis that have compared local responses, at the site of active disease, with systemic immune responses in the peripheral blood. In particular, studies of human tuberculous pleuritis illustrate the need to know if peripheral responses are representative of the responses at the site of active disease. Responses measured in the pleural fluid and in the peripheral blood suggest that local and peripheral responses in these patients may be at opposite ends of the immune spectrum.2 Most studies of tuberculous pleuritis describe strong proliferative and type 1 cytokine responses, such as interferon-γ (IFN-γ), interleukin (IL)-2 and IL-12 in pleural effusion cells, with concomitant depression of blastogenesis and predominantly type 2 cytokine expression, such as IL-4, in the peripheral blood of these patients.3–5 In addition to tuberculous pleuritis, investigations of bronchoalveolar lavage (BAL) cells from patients with active pulmonary tuberculosis have described mycobacterial antigen-specific DNA synthesis and IFN-γ production that is not present in peripheral blood mononuclear cells (PBMC).6
Other lines of evidence, in contrast, suggest that responses in the peripheral blood are highly relevant to those at the site of disease, and that immune responses in tuberculosis are not so tightly compartmentalized. For instance, transforming growth factor-β (TGF-β), a cytokine thought to suppress protective responses in tuberculosis by down-regulating IFN-γ and IL-127,8 and to enhance the intracellular growth of mycobacteria,9 has been detected in tuberculosis patients both locally, e.g. in BAL and pleural fluid, and systemically in peripheral blood monocytes.10,11
To our knowledge, no such comparative studies of local and systemic responses in bovine tuberculosis have been conducted. In this study, we compared the proliferative and cytokine responses of lymphocytes from the peripheral blood and infected lymph nodes of cattle experimentally infected with M. bovis to a panel of mycobacterial antigens, which included the tuberculin preparations routinely used in the diagnosis of bovine tuberculosis, a group of proteins that are either secreted by live mycobacteria or associated with the cell wall (MPB70, MPB83, ESAT-6, 38 000 MW lipoprotein and Ag85), as well as three somatic stress proteins (hsp 16.1, hsp 65 and hsp 70). These proteins were selected because they are known to induce cellular immune responses in bovine or human tuberculosis.12–16
The results presented in this report show that while some minor differences exist between peripheral blood and local lymphocytes in either their proliferative responses or in their production of IFN-γ or IL-2, the overall responses towards immunodominant antigens are equivalent, or even stronger, in the blood than in lymph node cells. Our results therefore suggest that in the study of the immunology of bovine tuberculosis, responses measured in the peripheral blood are relevant and largely reflect responses at the site of active disease.
Materials and methods
Mycobacterial antigens
Mammalian and avian tuberculin preparations (purified protein derivative [PPD]-M and PPD-A), and recombinant proteins ESAT-6, MPB70 and MPB83 were produced as described by Vordermeier et al.17 at the Veterinary Laboratories Agency (Weybridge, UK). Recombinant MPB64 was kindly provided by D. Bakker (Animal Health Science, Boxtel, the Netherlands). Native Antigen 85, isolated from bacillus Calmette–Guérin (BCG) culture filtrate and comprising Ag85A, B and C, was donated by K. Huygen (Institut Pasteur, Brussels, Belgium). Recombinant hsp 16.1, hsp 65 and hsp 70, and the 38-000 MW lipoprotein were a kind gift from M. Singh (GBF, Braunschweig, Germany).
Experimental animals
Female Limousin calves (CN1100 and CN1104), ≈ 6 months of age, were infected intratracheally with 6·6 × 104 colony-forming units (CFU) of M. bovis (AF2122/97), following the method of Buddle et al.18 During the study, animals were housed in a high-security isolation unit under negative pressure and expelled air was filtered through absolute filters. Two weeks prior to killing, both animals were checked for delayed-type hypersensitivity (DTH) conversion using the tuberculin (bovine PPD-M and avian PPD-A) comparative intradermal skin test. Euthanasia was carried out at 20 weeks postinfection by intravenous (i.v.) injection of sodium pentobarbitone, and animals were examined for macroscopic tuberculous lesions. Tuberculous lesions were confirmed by histopathology and bacterial isolation, as previously described.19
Lymphocyte proliferation assay
PBMC were separated from heparinized venous blood over Histopaque 1077 (Sigma, Poole, Dorset, UK) and resuspended in culture medium [RPMI-1640 with Glutamax (Gibco Life Technologies Ltd, Paisley, UK) supplemented with 5% CPSR serum replacement (Gibco), non-essential amino acids (Gibco), 100 U/ml of penicillin, 100 µg/ml of streptomycin (Gibco) and 5 × 10⁵m 2-mercaptoethanol (Gibco)]. Lymph node cells (LNC) were obtained from samples of retropharyngeal lymph nodes that had visible lesions, which were confirmed by culture to contain M. bovis. A single cell suspension was prepared by passing the tissue through a fine mesh, before washing and resuspending the lymphocytes in culture medium. The cell concentration was adjusted to 2 × 10⁶/ml and 0·1 ml was added per well to 96-well flat-bottomed tissue culture plates (Nunc, Life Technologies Ltd, Paisley UK). Antigens were then added, 0·1 ml/well in triplicate (all at 10 µg/ml final concentration). The cultures were incubated for 5 days at 37° in 5% CO2, pulsed with tritiated thymidine (1 µCi/well), and harvested 24 hr later. Incorporated radioactivity was determined as counts per minute (c.p.m.) by β-scintillation counting.
Magnetic sorting of T cells from PBMC
T cells were isolated from PBMC by positive selection using the magnetically activated cell sorting system (MACS; Miltenyi Biotech, Bisley, Surrey, UK) following the manufacturer’s guidelines. PBMC (1 × 10⁸) were resuspended in 1 ml of the primary monoclonal antibody (mAb) for 15 min at room temperature, washed in phosphate-buffered saline (PBS) and resuspended in a solution of goat anti-mouse immunoglobulin G (IgG)-labelled microbeads for 15 min at room temperature. Positive cells bound by magnetic beads were positively sorted on MS+ separation columns attached to Mini Magnets. Positive cells were eluted, washed and resuspended in culture medium at 2 × 10⁶/ml. mAbs for positive sorting were CC-30 (CD4)20 and CC-58 (CD8β),21 both courtesy of IAH (Compton, Berkshire, UK). CC-30 and CC-58 culture supernatants were diluted 1:10. The total γδ T cells were sorted using GB21A (γδΤ-cell receptor [γδTCR])22 diluted to 5 µg/ml (VMRD, Inc., Pullman, WA). Cell purity was assessed by incubating the eluted cells with fluorescein isothiocyanate (FITC)-conjugated sheep anti-mouse immunoglobulin or with a control antibody (Calbiochem-Novabiochem Ltd, Nottingham, UK). Cells were consistently > 98% pure. The medium used throughout this procedure was FacsFlow (Becton-Dickinson, Oxford, UK) supplemented with 0·5% bovine serum albumin (BSA; Sigma, Poole, Dorset, UK) and sterile filtered.
T-cell proliferation assays
T cells (2 × 10⁵ CD4+, CD8+ or γδTCR+) were plated out, in 96-well flat-bottomed culture trays, together with 2 × 10⁵ autologous mitomycin C-treated (Sigma) PBMC feeders. Antigens were added in triplicate as described above (200 µl total volume/well). Cultures were pulsed with tritiated thymidine after 4 days and harvested after 5 days. Proliferation controls (feeders and antigen only) were included for each antigen to ensure that no proliferation by the mitomycin-treated feeder cells had occurred. Results are expressed as the c.p.m. + standard error of triplicate cultures. A positive response was defined as a mean c.p.m. in the presence of antigen that was greater than three times the mean c.p.m. in the absence of antigen, and also > 1000 c.p.m..
Flow cytometry
PBMC and LNC were analysed using mAbs MMIA (CD3), GB21A (γδTCR) (VMRD, Inc.), CC-30 (CD4), CC-58 (CD8) (IAH), and FITC-conjugated sheep anti-mouse immunoglobulins (Calbiochem-Novabiochem). Cells (106) were washed in PBS containing 0·1% sodium azide before resuspending in primary antibody (culture supernatants diluted 1:10, GB21A and MMIA at 5 µg/ml in PBS/azide) for 10 min at room temperature. The cells were washed in PBS/azide and resuspended in the FITC conjugate (diluted 1:50 in PBS/azide) for 10 min at room temperature. After further washing, the cells were resuspended in PBS containing 4% paraformaldehyde and stored at 4° until analysed using a fluorescence-activated cell sorter (FACScan) and cellquest software (Becton-Dickinson).
IFN-γ enzyme-linked immunosorbent assay (ELISA)
LNC were incubated at 106/ml final concentration in culture medium, in the presence or absence of each of the panel of antigens, for 24 hr. Peripheral whole blood (PB) was diluted 1:1 in culture medium, in the presence or absence of antigen, for 24 hr.23 Neat supernatants were assessed for IFN-γ content using a commercially available antigen-capture ELISA kit, BOVIGAMTM (CSL Ltd, Parkville, Victoria, Australia), and following the manufacturer’s instructions. Results are expressed as the mean optical density (OD 450) of duplicate cultures + standard deviation. A positive response was defined as a mean OD 450 in the presence of antigen that was greater than twice the mean OD 450 in the absence of antigen, and also > 0·2.
IL-2 bioassay
IL-2 in neat PB and 24-hr culture supernatants of LNC (as described above for IFN-γ) was measured by the ability of each supernatant to cause proliferation of lymphoblasts generated by stimulation with concanavalin A (Con A), following the method of Emery et al.23 PB and LNC culture supernatants were added to the Con A blasts in duplicate. The plates were incubated for 24 hr at 37° in 5% CO2, pulsed with tritiated thymidine and harvested 24 hr later. The specificity of this bioassay for IL-2 has been determined previously by inhibition with a mAb specific for the α-subunit of the IL-2 receptor, CD25.24,25 A positive response was defined as the mean c.p.m. of IL-2-dependent Con A blasts in the presence of antigen-stimulated supernatants that was greater than twice the c.p.m. of blasts in the presence of unstimulated supernatants, and also > 1000 c.p.m.
TGF-β ELISA
PBMC and LNC cultures that had been stimulated with PPD-M or medium (as a control) for 6 days were tested for the presence of TGF-β using a Genzyme human TGF-β1 ELISA kit (R & D Systems Europe Ltd, Abingdon, UK), following the manufacturer’s instructions.
Results
Pathological findings
Positive skin test responses (PPD-M ≥ PPD-A by at least 4 mm) were observed in both animals challenged intratracheally with 6·6 × 104 CFU of M. bovis (AF2122/07). Both animals presented gross pathology typical of natural bovine tuberculosis (D. Gavier-Widen, VLA, personal communication), with granulomatous lesions in the upper respiratory lymph nodes (specifically, CN1104: left retropharyngeal, left submandibular, bronchial; CN1100: bronchial, caudal mediastinal), in the lungs and also in the cranial (mediastinal) lymph nodes in both animals. CN1104 also had lesions in the trachea. Acid-fast bacilli were identified in histological specimens from all lesions, and M. bovis was cultured from all lesions.
Proliferative responses of PBMC and LNC
Figure 1 shows the proliferative responses of PBMC and LNC from both animals to the panel of mycobacterial antigens. We observed differences in the recognition of individual antigens between the two animals, with CN1104 (Fig. 1c, 1d) recognizing a broader spectrum of antigens than CN1100 (Fig. 1a, 1b). Bovine tuberculin PPD (PPD-M) and ESAT-6 generated the strongest proliferative responses in both animals, in PBMC and in LNC. However, the response against these antigens was generally higher in PBMC than in LNC, e.g. for CN1100: 24 345 c.p.m. versus 11 571 c.p.m. in PPD-M-stimulated PBMC and LNC, respectively, and for CN1104: 39 196 c.p.m. versus 13 398 c.p.m. in PPD-M-stimulated PBMC and LNC, respectively. Other antigens generally elicited weaker proliferative responses in both PBMC and LNC (e.g. MPB70, MPB83, hsp 65). Interestingly, proliferative responses against Ag85 and hsp 16.1 in both animals were only detected in LNC cultures. However, responses in the blood from both calves were induced by both of these antigens at earlier time-points (data not shown).
Figure 1.
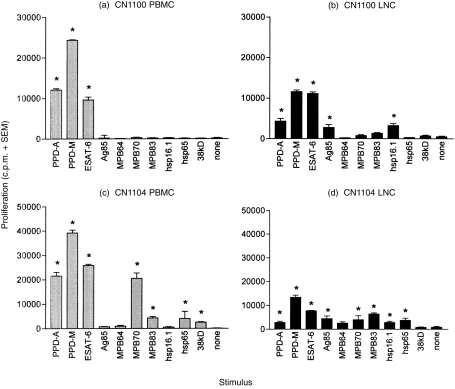
Antigen-specific proliferation of peripheral blood mononuclear cells (PBMC, grey bars) and lymph node cells (LNC, black bars) from two cattle, CN1100 [(a) and (b)] and CN1104 [(c) and (d)], 20 weeks after intratracheal infection with 6·6 × 104 colony-forming units (CFU) of Mycobacterium bovis. The results are expressed as the mean proliferation (in counts per minute [c.p.m.]) of triplicate cultures plus the standard error of the mean (SEM). A positive response was defined as a culture with a mean c.p.m. greater than three times the mean c.p.m. of the unstimulated culture, and also > 1000 c.p.m. (* indicates a positive response).
The stronger responses of PBMC to tuberculin and ESAT-6, and also to MPB70 (in the case of CN1104), did not appear to be the result of a higher proportion of CD4+ T cells in the PBMC compared with LNC, as measured by flow cytometry (Table 1). There were, however, differences in the proportions of γδTCR+ T cells present in PBMC compared with LNC. The percentage of γδTCR+ T cells in PBMC of both animals was more than double the percentage of these cells in the LNC, e.g. in CN1104: 22% and 8% in PBMC and LNC, respectively, and in CN1100: 30% and 12% in PBMC and LNC, respectively. This lower proportion of γδTCR+ T cells in LNC represented an increase compared with two uninfected lymph nodes investigated (from which a mean percentage of 4·5%γδTCR+ cells was obtained).
Table 1.
Cellular composition of peripheral blood mononuclear cells (PBMC) and lymph node cells (LNC) of two cattle, CN1100 and CN1104, 20 weeks after intratracheal infection with 6·6 × 104 colony-forming units (CFU) of Mycobacterium bovis
| CN1104 | CN1100 | |||
|---|---|---|---|---|
| PBMC | LNC | PBMC | LNC | |
| CD3+ | 55 | 61 | 60 | 69 |
| CD4+ | 30 | 35 | 23 | 38 |
| CD8+ | 9 | 14 | 14 | 21 |
| γδTCR+ | 22 | 8 | 30 | 12 |
The data are expressed as the percentage of T cells present in each responding population.
γδTCR, γδ T-cell receptor.
The presence of IL-2 in the supernatants of PB and LNC stimulated by the panel of antigens was also investigated, and generally reflected the extent of proliferation in the cultures (data not shown), particularly in the case of those antigens (PPD-M and ESAT-6) that gave the strongest proliferative response, but also to the weaker antigens MPB70 and MPB83. Ag85 induced IL-2 production in PBMC and LNC, even in the absence of Ag85-induced proliferation (no proliferation in PBMC of either animal). However, the strongest IL-2 response was seen in LNC where proliferation to Ag85 was also detected (see Fig. 1b, 1d).
Antigen-induced IFN-γ from PB and LNC
Figure 2 shows the comparative levels of IFN-γ in PB and LNC culture supernatants from both animals following stimulation with the panel of antigens. As with proliferation, animal CN1104 produced IFN-γ in response to a wider range of antigens than did CN1100. Bovine tuberculin (PPD-M) and ESAT-6 were the most potent inducers of IFN-γ, both in the PB and LNC from both animals. However, in the case of CN1100, the OD 450 reading for IFN-γ produced by PB (Fig. 2a) after stimulation with PPD-M or ESAT-6 was twice that seen in LNC (Fig. 2b), i.e. 1·386 compared with 0·403 in PPD-M-stimulated PB and LNC, respectively, and 0·98 compared with 0·52 in ESAT-6-stimulated PB and LNC, respectively, suggesting an increased IFN-γ production by PB compared with LNC.
Figure 2.
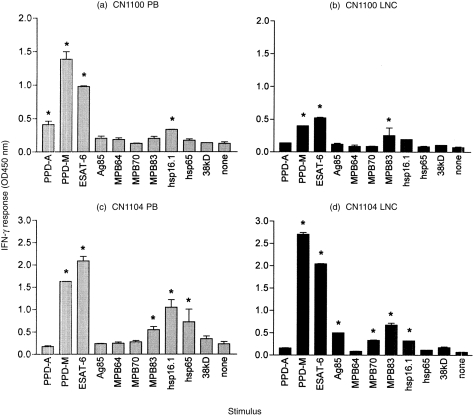
Antigen-specific interferon-γ (IFN-γ) response of whole peripheral blood (PB, grey bars) and lymph node cells (LNC, black bars) from two cattle, CN1100 [(a) and (b)] and CN1104 [(c) and (d)], 20 weeks after intratracheal infection with 6·6 × 104 colony-forming units (CFU) of Mycobacterium bovis. The results are expressed as the mean optical density (OD 450) of duplicate cultures plus the standard deviation (SD). A positive response was defined as a mean OD 450 greater than twice the mean OD 450 of unstimulated control cultures, and also > 0·2 (* indicates a positive response).
In contrast to CN1100, animal CN1104 produced essentially equivalent levels of IFN-γ in PB and LNC. This is interesting because it suggests that LNC of CN1104 maintain an equally high IFN-γ production but with lower proliferation compared with PBMC (see Fig. 1c, 1d). As shown for the proliferative response, there was a general overlap of the recognition pattern of the other antigens recognized more weakly (e.g. MPB83 and hsp 16.1). Minor differences in antigen recognition were also found in CN1104. This is seen by the positive IFN-γ response induced by Ag85 in LNC but not in PB, and hsp 65-induced IFN-γ in PB but not in LNC from this animal.
Proliferative responses of T-cell subsets in PBMC
Figure 3 shows the proliferative responses of CD4+, CD8+ and γδTCR+ T cells of both animals to PPD and ESAT-6. The strongest response was seen in the CD4+ T-cell population, with a weaker response from γδTCR+ T cells. No response was detected in the CD8+ T-cell population in these two animals. While the γδTCR+ proliferative responses were comparable between both animals, the CD4+ T-cell response of CN1104 (Fig. 3b) was considerably weaker than the CD4+ T-cell response of animal CN1100 against these antigens. Interestingly, the comparatively weaker CD4+ T-cell response of CN1104 coincided with the tuberculin-induced TGF-β production by PBMC in this animal only (0·64 ng/ml in PPD-M-stimulated compared with 0·218 ng/ml in control/unstimulated cultures). PPD-M did not induce TGF-β in PBMC from CN1100, and values were no different to unstimulated PBMC, at 0·2 ng/ml.
Figure 3.
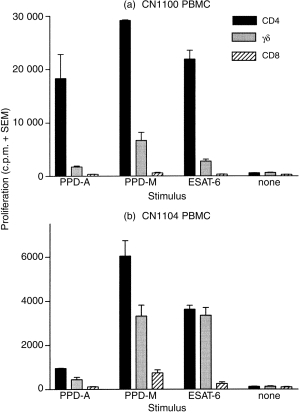
Antigen-specific T-cell subset proliferation from two cattle, CN1100 (a) and CN1104 (b), 20 weeks after intratracheal infection with 6·6 × 104 colony-forming units (CFU) of Mycobacterium bovis. The results are expressed as the mean proliferation (in counts per minute [c.p.m.]) of triplicate cultures plus the standard error of the mean (SEM) of CD4+ (black bars), γδΤ-cell receptor+ (γδTCR+) (grey bars) and CD8+ (hatched bars) T cells.
We have observed γδTCR+ T-cell responses to mycobacterial protein antigens in a number of other M. bovis-infected animals (both experimentally infected cattle and naturally infected field reactors). Figure 4 shows the proliferative response of γδTCR+ T cells to PPD-M and to ESAT-6 in one such field reactor, demonstrating the ability of these antigens to stimulate γδTCR+ T cells in cattle infected naturally. γδTCR+ T cells from this particular animal also responded to a range of other antigens including Ag85, MPB64, MPB70, MPB83 and hsp16.1, but did not display any reactivity to the non-proteinaceous antigens TUBag1, Epox-PP or IHPP26,27 (data not shown).
Figure 4.
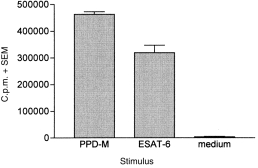
PPD-M-specific and ESAT-6-specific proliferation of γδΤ-cell receptor+ (γδTCR+) T cells from a representative field reactor (infected naturally with Mycobacterium bovis). Results are expressed as the mean proliferation (in counts per minute [c.p.m.]) of triplicate cultures plus the standard error of the mean (SEM) for each antigen.
Discussion
This report describes proliferative and cytokine responses in the peripheral blood and infected lymph nodes of cattle that were experimentally infected with M. bovis to generate pathology characteristic of natural M. bovis infection. As far as we are aware, this is the first report to compare peripheral blood and local responses in bovine tuberculosis, an issue that is particularly salient in current research programmes that utilize peripheral blood to gauge potentially protective or pathogenic immune responses.
Our results illustrate individual differences in the recognition of these antigens between two animals, with one animal (CN1104) recognizing a broader range of antigens than the other (CN1100). Both animals, however, responded appropriately to the tuberculin preparations in both peripheral blood and LNC, with a stronger response to PPD-M compared with PPD-A. ESAT-6 was the only other antigen to stimulate equivalent, proliferative IFN-γ and IL-2 responses in both animals. The responses to PPD-M, PPD-A and ESAT-6 indicated little difference between the peripheral blood and the local immune response. These results also further support the immunodominant recognition of ESAT-6 by cattle following infection with M. bovis, as has been observed recently.16,28
Other antigens gave more variable responses, reminiscent of data provided by Fifis et al.29 who showed that the cellular and antibody responses of M. bovis-infected cattle to individual antigens varied not only between animals but also changed over the time course of the infection. In our study, MPB70 stimulated a proliferative response in PBMC, but not LNC, in one animal only (CN1104), while Ag85 stimulated low, but detectable, proliferation of LNC (but not PBMC) from both animals. However, PBMC responses against Ag85 were detected periodically at earlier time-points in both animals, which might indicate that periodical recognition between the blood and sites of active disease (sequestration) occurs in cattle similar to that described in human tuberculosis.30,31 This could account for the absence of PBMC responses at the time of killing. This sequestration might not be observed for antigens such as ESAT-6 or PPD, which are presumably recognized with high-responder frequencies. We have observed similar periodical responses to a number of other antigens, such as MPB83 and MPB70 (data not shown).
Studies of a related pathogen of cattle, Mycobacterium avium paratuberculosis, the cause of intestinal paratuberculosis in ruminants, also indicate similarities in peripheral blood and local responses to mycobacteria. In particular, sheep with paucibacilliary lesions reportedly possess strong peripheral blood and intestinal antigen-specific lymphocyte responses and enhanced IFN-γ and IL-2 production, while multibacilliary subjects have weak peripheral blood and intestinal lymphocyte and type 1 cytokine responses that may permit the persistence of mycobacteria.32 Taken together, the evidence generated thus far does not support compartmentalization of the immune response of ruminants to mycobacteria.
Finally, we investigated the contribution of CD4+, CD8+ and γδTCR+ T-cell subpopulations to the PBMC antigen-specific proliferation. Our results with PBMC show a predominant CD4+ T-cell proliferation to tuberculin and ESAT-6, consistent with these cells being the major T-cell population involved in the acquired immune response to tuberculosis,33 and are in keeping with recent work by Liebana et al.34 This latter report further suggests that the predominance of the CD4+ T-cell response over CD8+ T-cells was not caused by preferential differences in antigen presentation, i.e. live organisms versus soluble antigen, by these two T-cell subsets. Interestingly, the comparatively weaker CD4+ T-cell response of CN1104 coincided with the production of TGF-β by PBMC in this animal, supporting previous reports that TGF-β can adversely affect the function of CD4+ T cells.35,36
The magnitude of the γδTCR+ T-cell responses was similar in both animals and indicated some specificity, as shown by the stronger response to PPD-M and ESAT-6 compared with PPD-A. γδTCR+ cells have been shown to produce IFN-γ in response to mycobacterial antigen37 and be rapidly activated in cattle following infection with M. bovis.38 Our data show that γδTCR+ T cells from cattle infected with M. bovis are able to proliferate in response to protein antigens. The mechanism of this activation, as well as the role of γδTCR+ T cells, is currently under further investigation, but preliminary data suggest an immunomodulatory role for these T cells in bovine tuberculosis. The higher proportion of γδTCR+ cells in the periphery compared with infected lymph nodes in our cattle may have contributed to the relatively stronger responses that were observed in peripheral blood cells.
In summary, our results suggest that there is little difference between local lymph node and peripheral blood immune responses during early M. bovis infection in cattle. It is important to stress that these results were obtained after a 20-week infection period, which represents a relatively short timespan for a chronic disease that, following natural infection, could last for many years. However, because the current skin test-and-slaughter policy for the control of bovine tuberculosis in Great Britain should ensure that chronic reactors are removed from the national herd, it is not anticipated that peripheral anergy or immunosuppression, as seen in chronically infected M. tuberculosis patients,39 will be a problem in the investigation of bovine tuberculosis. Therefore we predict that information gathered from peripheral immune responses of cattle naturally infected with M. bovis should reflect responses at the site of active infection and disease.
Acknowledgments
The authors would like to thank Adam Whelan (Veterinary Laboratories Agency) for providing the recombinant antigens MPB70, MPB83 and ESAT-6. Thanks also go to Dr M. Singh (GBF, Braunschweig, Germany), Dr K. Huygen (Institut Pastuer, Brussels, Belgium), Dr D. Bakker (Animal Health Science, Boxtel, the Netherlands) and Dr J.-J. Fourni (INSERM, France) for supplying the antigens hsp 16.1, hsp 65, hsp 70, 38 kDa (M. Singh), Antigen 85 (K. Huygen), MPB64 (D. Bakker) and the non-protein ligands TUBag1, Epox-PP and IHPP (J.-J. Fourni). Infection and post-mortem analysis of cattle were carried out by Dr D. Gavier-Widen, Derek Clifford and Neil Palmer (VLA).
References
- 1.Krebs JR, Anderson RM, Clutton-brock T, Morrison I, Young D, Donnely C. Report to the Rt. Hon. Dr. Jack Cunningham M.P. London: MAFF Publications; Bovine tuberculosis in cattle and badgers. [Google Scholar]
- 2.Ellner JJ. Pleural fluid and peripheral blood lymphocyte function in tuberculosis. Ann Intern Med. 1978;89:932. doi: 10.7326/0003-4819-89-6-932. [DOI] [PubMed] [Google Scholar]
- 3.Barnes PF, Mistry SD, Cooper CL, Pirmez C, Rea TH, Modlin RL. Compartmentalisation of a CD4+ T lymphocyte subpopulation in tuberculous pleuritis. J Immunol. 1989;142:1114. [PubMed] [Google Scholar]
- 4.Barnes PF, Shuzhuang L, Abrams JS, Wang E, Yamamura M, Modlin RL. Cytokine production at the site of disease in human tuberculosis. Infect Immun. 1993;61:3482. doi: 10.1128/iai.61.8.3482-3489.1993. [DOI] [PMC free article] [PubMed] [Google Scholar]
- 5.Zhang M, Gately MK, Modlin RL, Barnes PF. Interleukin 12 at the site of disease in tuberculosis. J Clin Invest. 1994;93:1733. doi: 10.1172/JCI117157. [DOI] [PMC free article] [PubMed] [Google Scholar]
- 6.Schwander SK, Torres M, Sada E, et al. Enhanced responses to Mycobacterium tuberculosis antigens by human alveolar lymphocytes during active pulmonary tuberculosis. J Infect Dis. 1998;178:1434. doi: 10.1086/314454. [DOI] [PubMed] [Google Scholar]
- 7.Hirsch CS, Hussain R, Toossi Z, Dawood G, Shahid F, Ellner JJ. Cross modulation by transforming growth factor beta in human tuberculosis; suppression of antigen-driven blastogenesis and interferon-γ production. Proc Natl Acad Sci USA. 1996;93:3193. doi: 10.1073/pnas.93.8.3193. [DOI] [PMC free article] [PubMed] [Google Scholar]
- 8.Toossi Z, Mincek M, Seeholtzer E, Fulton SA, Hamilton BD, Hirsch CS. Modulation of IL-12 by transforming growth factor-beta (TGF-β) in Mycobacterium tuberculosis-infected mononuclear phagocytes and in patients with active tuberculosis. J Clin Lab Immunol. 1997;49:59. [PubMed] [Google Scholar]
- 9.Hirsch CS, Yoneda T, Ellner JJ, Averill LE, Toossi Z. Enhancement of intracellular growth of M. tuberculosis in human monocytes by transforming growth factor beta. J Infect Dis. 1994;170:1229. doi: 10.1093/infdis/170.5.1229. [DOI] [PubMed] [Google Scholar]
- 10.Toossi Z, Gogate P, Shiratsuchi H, Young H, Ellner JJ. Enhanced expression of transforming growth factor-β (TGF-β) by blood monocytes from patients with active tuberculosis and presence of TGF-β in tuberculous granulomatour lung lesions. J Immunol. 1995;154:465. [PubMed] [Google Scholar]
- 11.Maeda J, Ueki N, Ohkawa T, et al. Local production and localisation of transforming growth factor beta in tuberculous pleurisy. Clin Exp Immunol. 1993;92:32. doi: 10.1111/j.1365-2249.1993.tb05944.x. [DOI] [PMC free article] [PubMed] [Google Scholar]
- 12.Vordermeier HM, Harris DP, Friscia G, et al. T cell repertoire in tuberculosis: selective anergy to an immunodominant epitope of the 38kDa antigen in patients with actice disease. Eur J Immunol. 1992;22:2631. doi: 10.1002/eji.1830221024. [DOI] [PubMed] [Google Scholar]
- 13.Huygen K, Vanvooren JP, Turneer M, Bosmans R, Dierckx P, Debruyn J. Specific lymphoproliferation, gamma-interferon production and serum immunoglobulin G directed against a purified 32-kDa mycobacterial antigen (P32) in patients with active tuberculosis. Scand J Immunol. 1988;27:187. doi: 10.1111/j.1365-3083.1988.tb02338.x. [DOI] [PubMed] [Google Scholar]
- 14.Boom WH, Wallis RS, Chervenak KA. Human Mycobacterium tuberculosis-reactive CD4+ T cell clones: heterogeneity in antigen recognition, cytokine production and cytotoxicity for mononuclear phagocytes. Infect Immun. 1991;59:2737. doi: 10.1128/iai.59.8.2737-2743.1991. [DOI] [PMC free article] [PubMed] [Google Scholar]
- 15.Wood PR, Corner LA, Rothel JS, et al. A field evaluation of serological and cellular diagnostic tests for bovine tuberculosis. Vet Microbiol. 1992;31:71. doi: 10.1016/0378-1135(92)90142-g. [DOI] [PubMed] [Google Scholar]
- 16.Pollock JM, Andersen P. Predominant recognition of the ESAT-6 protein in the first phase of infection with Mycobacterium bovis in cattle. Infect Immun. 1997;65:2587. doi: 10.1128/iai.65.7.2587-2592.1997. [DOI] [PMC free article] [PubMed] [Google Scholar]
- 17.Vordermeier HM, Cockle PC, Whelan A, et al. Development of diagnostic reagents to differentiate between Mycobacterium bovis BCG vaccination and M. bovis infection in cattle. Clin Diag Lab Immunol. 1999;6:675. doi: 10.1128/cdli.6.5.675-682.1999. [DOI] [PMC free article] [PubMed] [Google Scholar]
- 18.Buddle BM, Keen D, Thomson A, et al. Protection of cattle from bovine tuberculosis by vaccination with BCG by the respiratory or subcutaneous route, but not by vaccination with killed Mycobacterium vaccae. Res Vet Sci. 1995;59:10. doi: 10.1016/0034-5288(95)90023-3. [DOI] [PubMed] [Google Scholar]
- 19.Buddle BM, Aldwell FE, Pfeffer A, Delisle GW, Corner LA. Experimental Mycobacterium bovis infection of cattle: effect of dose of M. bovis and pregnancy on immune responses and distribution of lesions. N Z Vet J. 1994;42:167. doi: 10.1080/00480169.1994.35814. [DOI] [PubMed] [Google Scholar]
- 20.Bensaid A, Haddam M. Bovine CD4 (BoCD4) Vet Immunol Immunopathol. 1991;27:51. doi: 10.1016/0165-2427(91)90078-q. [DOI] [PubMed] [Google Scholar]
- 21.MacHugh ND, Bensaid A, Howard CJ, Davis WC, Morrison WI. Analysis of the reactivity of anti-bovine CD8 monoclonal antibodies with cloned T cell lines and mouse L cells transfected with CD8. Vet Immunol Immunopathol. 1991;27:169. doi: 10.1016/0165-2427(91)90096-u. [DOI] [PubMed] [Google Scholar]
- 22.Davis WC, Brown WC, Hamilton MJ, et al. Analysis of monoclonal antibodies specific for the γδ TCR. Vet Immunol Immunopathol. 1996;52:275. doi: 10.1016/0165-2427(96)05578-x. [DOI] [PubMed] [Google Scholar]
- 23.Emery DL, Duffy FH, Wood PR. An analysis of cellular proliferation and synthesis of lymphokines and specific antibody in vitro by leucocytes from immunized cattle. Vet Immunol Immunopathol. 1988;18:67. doi: 10.1016/0165-2427(88)90037-2. [DOI] [PubMed] [Google Scholar]
- 24.Naessens J, Selighem M, MacHugh N, Park YH, Davis WC, Toye P. Selection of BoCD25 monoclonal antibodies by screening mouse L cells transfected with the bovine P55-interleukin 2 (IL-2) receptor gene. Immunology. 1992;76:305. [PMC free article] [PubMed] [Google Scholar]
- 25.Kuhnle G, Collins RA, Scott JE, Keil GM. Bovine interleukin-2 and interleukin-4 expressed in recombinant bovine herpesvirus-1 are biologically active secreted glycoproteins. J Gen Virol. 1996;77:2231. doi: 10.1099/0022-1317-77-9-2231. [DOI] [PubMed] [Google Scholar]
- 26.Constant P, Davodeau F, Peyrat M-A, et al. Stimulation of human γδ T cells by nopeptidic mycobacterial ligands. Science. 1994;264:267. doi: 10.1126/science.8146660. [DOI] [PubMed] [Google Scholar]
- 27.Tanaka Y, Morita CT, Tanaka Y, Nieves E, Brenner MB, Bloom BR. Natural and synthetic non-peptide antigens recognised by human γδ T cells. Nature. 1995;375:155. doi: 10.1038/375155a0. [DOI] [PubMed] [Google Scholar]
- 28.Pollock JM, Andersen P. The potential of the ESAT-6 antigen secreted by virulent mycobacteria for specific diagnosis of tuberculosis. J Infect Dis. 1997;175:1251. doi: 10.1086/593686. [DOI] [PubMed] [Google Scholar]
- 29.Fifis T, Corner LA, Rothel JS, Wood PR. Cellular and humoral immune responses of cattle to purified Mycobacterium bovis antigens. Scand J Immunol. 1994;39:267. doi: 10.1111/j.1365-3083.1994.tb03370.x. [DOI] [PubMed] [Google Scholar]
- 30.Rook GA, Carswell JW, Stanford JL. Preliminary evidence for the trapping of antigen-specific lymphocytes in the lymphoid tissue of ‘anergic’ tuberculosis patients. Clin Exp Immunol. 1976;26(1):129. [PMC free article] [PubMed] [Google Scholar]
- 31.Schwander SK, Sada E, Torres M, et al. T lymphocyte and immature macrophage alveolitis in active pulmonary tuberculosis. J Infect Dis. 1996;173:1267. doi: 10.1093/infdis/173.5.1267. [DOI] [PubMed] [Google Scholar]
- 32.Burrells C, Clarke CJ, Colston A, et al. A study of immunological responses of sheep clinically affected with paratuberculosis (Johne’s disease). The relationship of blood, mesenteric lymph node and intestinal lymphocyte responses to gross and microscopic pathology. Vet Immunol Immunopathol. 1998;66:343. doi: 10.1016/s0165-2427(98)00201-3. [DOI] [PubMed] [Google Scholar]
- 33.Havlir DV, Wallis RS, Boom WH, Daniel TM, Chervenak K, Ellner JJ. Human immune responses to Mycobacterium tuberculosis antigens. Infect Immun. 1991;59:665. doi: 10.1128/iai.59.2.665-670.1991. [DOI] [PMC free article] [PubMed] [Google Scholar]
- 34.Liebana E, Girvin RM, Welsh M, Neill SD, Pollock JM. Generation of CD8+ T-cell responses to Mycobacterium bovis and mycobacterial antigen in experimental bovine tuberculosis. Infect Immun. 1999;67:1034. doi: 10.1128/iai.67.3.1034-1044.1999. [DOI] [PMC free article] [PubMed] [Google Scholar]
- 35.Fontana A, Frei K, Bodmer S, et al. Transforming growth factor-β inhibits the generation of cytotoxic T cells in virus-infected mice. J Immunol. 1989;143:3320. [PubMed] [Google Scholar]
- 36.Wahl SM. Transforming growth factor beta: a cause and a cure. J Clin Immunol. 1992;2:61. doi: 10.1007/BF00918135. [DOI] [PubMed] [Google Scholar]
- 37.Flesch IEA, Kaufman SHE. Role of cytokines in tuberculosis. Immunobiology. 1993;189:316. doi: 10.1016/S0171-2985(11)80364-5. [DOI] [PubMed] [Google Scholar]
- 38.Pollock JM, Pollock DA, Campbell DG, Girvin RM, Crockard AD. Dynamic changes in circulating and antigen-responsive T-cell subpopulations post-Mycobacterium bovis infection in cattle. Immunol. 1996;87:236. doi: 10.1046/j.1365-2567.1996.457538.x. [DOI] [PMC free article] [PubMed] [Google Scholar]
- 39.Ellner JJ. Immunosuppression in tuberculosis. Infect Agents Dis. 1996;5:62. [PubMed] [Google Scholar]