Abstract
Major histocompatibility complex (MHC) alleles acting as immune response genes are coexpressed in heterozygous individuals and therefore control of immune responses is usually codominant. As an exception to this rule, however, several examples of recessive immune responses have been ascribed to regulatory, e.g. suppressive, interactions. We report here that the recessive phenotype of both antibody and T-cell responses to the mycobacterial 16 000-MW antigen depends critically on a low antigen dose for immunization. On the basis of similar responses in hemi- and heterozygous mice, we suggest that the mechanism of recessive MHC control does not involve regulation by the low-responder allele. We also demonstrated mixed haplotype restriction of peptide recognition for a significant fraction of high-antigen-dose primed T cells. Their paucity under limiting antigen dose conditions may lead to the recessive expression of MHC control. In conclusion, our results suggest that recessive MHC control can be explained as a simple gene dosage effect under conditions where antigen is limiting, without a need for regulatory mechanisms.
Introduction
Several instances of human leucocyte antigen (HLA) association of susceptibility to infectious and autoimmune diseases in humans indicate that an understanding of the factors which govern the expression of major histocompatibility complex (MHC) control of immune responses in a heterozygous population is of particular importance. MHC class II allelic products, which present antigenic determinants to αβ T cells, are coexpressed on antigen-presenting cells (APCs) of F1 hybrids between high-responder (HR) and low-responder (LR) mouse strains and therefore MHC control is usually codominant.1 Nevertheless, there are examples with a wide range of antigens (Ags), where H2 control appears recessive, i.e. the F1 immune response corresponds to that of the LR parent.2,3 The pertinent genes were mapped to the H2A4–6 or H2E loci,7,8 but the role of H2 adjacent regions9–11 and non-H2 genes12 has also been reported.
As a mechanism for the recessive MHC control of immune responses, regulatory/suppressive function of the LR allele was originally suggested on the grounds of reversal of LR to HR in vitro13 or by adult thymectomy.14 Alternatively, immune suppressive effects of non-H2 genes,15 and differential expression or pairing of H2 gene products in APCs,16–18 was proposed. The latter mechanism may involve variation in regulatory gene segments of MHC class II promoters.19–22
In this study we investigated the quantitative and genetic features of the previously described recessive H2A control of the antibody response to the 16 000-MW α-crystallin from Mycobacterium tuberculosis.23 The initial observations were made only for humoral responses to one epitope (TB68), following immunization with a crude mycobacterial extract. The present analysis, expanded using recombinant antigen and immunogenic peptides, enabled a closely monitored dose–response study of both antibody and T-cell responses. In view of previous knowledge regarding the antigen-dose dependence of MHC control,24,25 we aimed to determine whether it was possible to override the recessive phenotype with higher antigen dosage. Furthermore, critical information was derived from comparing responses in heterozygous (LR × HR) and hemizygous (O × HR) mice. Our salient finding was that the recessive H2A control of both T- and B-cell responses occurs only following immunization with a limiting antigen dose and can be explained as a gene dosage effect, without invoking immune regulatory mechanisms.
Materials and methods
Mice
Inbred strains B10.BR and C57BL/10 (B10) were obtained from Olac Harlem (Bicester, UK) and used also to breed (B10.BR × B10)F1 hybrid mice in the Biological Services Unit on-site. Female mice (B10/129[ Aβ0/0]26 × B10[Ab/b])F1 mice, hemizygous for Ab (Aβ0/b), were mated with B10.BR (H2Ak/k) males and the progeny was typed as heterozygous (Ab/k) or hemizygous (A0/k) by staining of peripheral blood mononuclear cells (PBMC) for Ab (see the method described below under Flow cytometry). Female mice aged 8–20 weeks were used for the experiments.
Antigens and peptides
The recombinant 16 000-MW protein of M. tuberculosis (rPT16) was produced from a recombinant Escherichia coli strain that contains the gene encoding the 16 000-MW protein in the pQE-8 expression vector.27 The fusion protein containing six consecutive histidine residues at the N-terminus was purified by metal-chelate affinity chromatography. The bound protein was released from the nitrilo-tri-acetic acid resin column (QIAGEN, Crawley, UK) using a gradient of 50–500 m m imidazole. The soluble extract from the M. tuberculosis strain H37Rv (MTSE) was prepared as described previously.23
Peptide 20-mers were synthesized on a Milligen 9050 peptide synthesizer (Perceptive Biosystems, Watford, UK), using the 9-fluorenylmethyloxicarbonyl (Fmoc) α-amino protecting group NovaSyn PR-500 resin.28 Sequence integrity was verified by mass spectrometry and homogeneity by reverse-phase high performance liquid chromatography.
Immunization
For antibody responses, rPT16 (1–10 µg) or MTSE (50 µg), emulsified 1:1 in Freund’s incomplete adjuvant (FIA; Difco Laboratories Ltd, West Molesey, UK), were injected intraperitoneally (i.p.) followed 3 weeks later by one i.p. booster using the same dose of Ag in phosphate-buffered saline (PBS). Mice were bled from the tail vein 7–10 days after the last injection. For T-cell responses, 1–30 µg of rPT16, or peptide 111–130, or PBS (control), emulsified 1:1 in FIA, were injected subcutaneously (s.c.) into both hind footpads. The draining popliteal lymph nodes (LN) were harvested 8–10 days later.
Enzyme-linked immunosorbent assay (ELISA)
Polystyrene microtitre plates (Nunc-Immuno Plate MaxiSorp; Fisher Scientific, Loughborough, UK) were coated with rPT16 (1 µg/ml) dissolved in 0·05 m carbonate-bicarbonate buffer, pH 9·6. The microplates were incubated for 2 hr at 37° followed by 20 hr at 4° and then blocked with 5% skimmed milk in PBS–Tween-20 for 2 hr at 37°. Plates with serial fivefold dilutions of sera (from 1:100) were incubated for 2 hr at 37°, washed and developed with goat anti-mouse immunoglobulin G (IgG)-horseradish peroxidase (HRP) conjugate (Bio-Rad, Hemel Hempstead, UK). Washed plates were reacted with K-blue substrate (Bionostics Ltd, Wyboston, UK) for 5 min. The reaction was stopped with the Red stop solution and quantified at 620 nm. Antibody titres were expressed as the dilution of serum giving 30% of plateau binding of the positive control (ABT30).
Lymphocyte proliferation and T-cell lines
Lymph node (LN) cell suspensions from rPT16-primed mice were cultured in RPMI-1640 medium (Life Technologies, Paisley, Strathclyde, UK) supplemented with 10% fetal calf serum (FCS) (GibcoBRL, Paisley, Strathclyde, UK), 5 × 10⁻⁵ mβ-mercaptoethanol, 2 m m l-glutamine, 100 U/ml of penicillin and 100 µg/ml of streptomycin sulphate. Triplicate cultures of 4 × 10⁵ LN cells, 2 × 10⁵ spleen cells irradiated with 3000 rads (for APC) and 0·5 or 5·0 µg/ml of rPT16 or 3–30 µg/ml of p111–130 per well were incubated in flat-bottomed 96-well plates (Nunc, Fisher Scientific). Concanavalin A (Con A; Sigma, Poole, Dorset, UK) was used as a positive control. Cells were incubated for 3 days at 37° in a 5% CO2 humidified atmosphere and radiolabelled with 37 kBq of [3H]thymidine per well (Amersham International, Amersham, Bucks, UK) on the third day of culture. After a further 12 hr of incubation, cells were harvested on to glass-fibre filters and radioactivity was counted by liquid scintillation (1202 Beta Plate; LKB Wallac, EG & G Ltd, Milton Keynes, UK). Results were expressed either as the mean counts per minute (c.p.m.) of triplicate cultures or stimulation indices (SI; SI = c.p.m. with antigen/c.p.m. with medium). Standard deviations did not exceed 15% of the mean c.p.m. of the triplicate cultures.
T-cell lines were generated from immune LN cells cultured in 24-well plates (Costar, Cambridge, UK) at a concentration of 5 × 10⁶/well in the presence of 5 µg/ml Ag and 10 U/ml of recombinant mouse interleukin-2 (IL-2) (Pharmingen, Cowley, Oxford, UK). After 7 days, T-cell blasts were separated by density gradient centrifugation over Ficoll–Hypaque and then stimulated by coculturing 4 × 10⁵ T cells and 3 × 10⁶ 100 µg rPT16-pulsed APCs per well. T cells were stimulated with pulsed APC every 7 days and specificity was tested after 3 weeks. Thus, 2 × 10⁴ T cells and 5 × 10⁵ APCs per well were cultured with rPT16 or synthetic peptides (30 µg/ml), and thymidine incorporation from triplicate cultures was determined by liquid scintillation.
Interferon-γ (IFN-γ) ELISA
Samples or standards were added in duplicate to capture monoclonal antibody (mAb)-coated microplate wells (Corning, Bibby Sterilin, Stone, UK) and incubated for 2 hr at 37° and then for 20 hr at 4°. After washing, the wells were reacted with biotinylated rat anti-mouse IFN-γ mAb (Pharmingen) and then by streptavidin–peroxidase (Sigma), and the colour reaction with K-blue substrate was read at 620 nm. Cytokine concentrations were calculated by interpolation from standard curves.
Flow cytometry
Fc receptors on lymphoid cells were blocked with rat anti-mouse CD32/CD16 (FcγII/III Receptor) mAb (Pharmingen). Antibody dilutions and cells were washed with 5% of FCS and 0·1% w/v NaN3 in PBS and analysed in a flow cytometer (Becton-Dickinson FACScan, Cowley, UK) using the cellquest software system. The intensity of H2Ab expression on B cells was used for the typing of the (Aβ0/b × B10.BR) progeny: PBMCs were double stained with fluorescein isothiocyanate (FITC)-labelled anti-CD45R/B220 (RA3-6B2) and biotinylated anti-H2Ab (AF6-120·1) mAbs (Pharmingen), using streptavidin–R–phycoerythrin (SavPE) as secondary reagent. B cells were identified by forward scatter (FSC)/side scatter (SSC) and Fl1-gates (green fluorescence, B220+). Ab/k B cells showed ≈ 40–50% MHC class II specific fluorescence intensity in comparison to the Ab/b B10 mice. The expression of B7-2 on B cells was analysed by double staining of LN cell suspensions with FITC-labelled CD45R/B220 (RA3-6B2) and PE-conjugated CD86/B7-2 (GL1) mAbs (Pharmingen). Baseline B7-2 expression was low and increased substantially after activation with lipopolysaccharide (LPS) (results not shown).
Results
Antigen dose compensates for gene dosage
Serological testing of the Ag dose–response analysis showed low antibody levels in both B10 (Abb) and (B10 × B10.BR)F1 (Abk) mice following immunization with 1–2 µg of purified recombinant PT16 (Fig. 1). This finding confirms the previously reported recessive control of the antibody response to the TB68 epitope of the 16 000-MW antigen following immunization with 100 µg of MTSE (corresponding to 1 µg of rPT16).23 However, when the antigen dose was doubled to 4 µg of rPT16, the antibody response became codominant, thus Abk reached Akk titres while Abb remained low (P = 0·002). Moreover, upon further increase of the immunizing dose to 10 µg of rPT16, the antibody titres, even in homozygous Abb (LR) mice, increased sharply and the genetic difference compared with Ak mice was almost eliminated. These results illustrate how even relatively small differences in antigen dosage critically regulate between recessive and codominant expression of MHC control.
Figure 1.
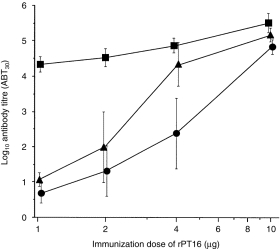
Antigen dose-dependent H2 control of antibody levels to the recombinant 16 000-MW protein of Mycobacterium tuberculosis (rPT16). Mice were injected intraperitoneally (i.p.) with rPT16, first in Freund’s incomplete adjuvant (FIA) and 3 weeks later in saline. Symbols represent 7-day antibody titres (mean, n = 5, IgG ABT30 ± SD, vertical bars) in B10.BR (squares), (B10.BR × B10)F1 (triangles) and B10 (circles) mice.
Similarly to serological data, the in vivo priming dose of rPT16 also influenced the genetic control of proliferative and IFN-γ responses of LN cells to stimulation with rPT16 in vitro (Fig. 2a, 2b). The LR and HR strains segregated and the genetic control was found to be recessive following priming with 3 µg of rPT16. Moreover, the genetic influence was completely abrogated by priming with 30 µg of rPT16. The latter result is apparently the result of some low-affinity Ab-binding epitopes. In contrast with the critical influence of the Ag priming dose, even 10-fold changes in Ag concentration in vitro had little effect on the pattern of genetic control.
Figure 2.
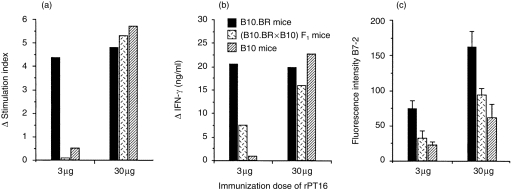
Antigen dose-dependent H2 control of cellular responses to the recombinant 16 000-MW protein of Mycobacterium tuberculosis (rPT16) of immune lymph node (LN) cells in vitro. Mice (n = 5) of the B10.BR, (B10.BR × B10)F1 and B10 strains were immunized in foot pads with rPT16 prepared in Freund’s incomplete adjuvant (FIA), and 7-day primed LN cells were cultured for 3 days in the presence of 0·5 µg/ml of rPT16. Mean (n = 3) values of (a) cell proliferation and (b) culture supernatant interferon-γ (IFN-γ) levels. Δ = Stimulation index (SI) or IFN-γ values of experimental group after subtraction of values obtained from phosphate-buffered saline (PBS)/FIA-injected mice. (c) Mean fluorescence intensity for B7-2 staining of B cells after subtracting the values obtained from PBS/FIA-injected mice: double staining with fluorescein isothiocyanate (FITC)-labelled CD45R/B220 (RA3-6B2) and phycoerythrin (PE)-conjugated CD86/B7-2 (GL1) monoclonal antibodies (mAbs).
Expression of the B7-2 costimulatory molecule on B cells is important for T–B-cell collaboration. Considering that expression of this receptor could reflect the difference between recessive and codominant MHC control, we examined B7-2 expression on B cells in rPT16-primed LN cells (Fig. 2c). The results observed following priming with 3 µg of rPT16 reflected the recessive phenotype (Abk = Abb < Akk) of T-cell proliferation and IFN-γ production. B7-2 expression on B cells was generally higher on B cells from mice primed with 30 µg of rPT16, but (in contrast to T-cell responses) still retained recessive control of expression between the strains. Hence, the control of B7-2 expression remained recessive, even under conditions when T-cell responses were codominantly expressed.
No evidence for a regulatory role of the H2Ab (LR) allele
One explanation for recessive MHC control that has gained considerable support has been that LR alleles negatively regulate immune responses in F1 mice. To address this possible explanation in our system, we compared the antibody responses to low Ag doses in hybrid mice with the same single HR (Ak) allele dosage, but either in the presence (Ak/b) or absence (Ak/o) of the LR (Ab) allele. The heterozygous (Ab/k) and hemizygous (A0/k) mice were segregants from the (Aβ0/b × B10.BR) cross. The results showed (Fig. 3) that both hetero- and hemizygous mice responded with similarly low antibody titres (P = 0·001 or P = 0·004 compared with B10.BR) when immunized with 0·5 µg of the 16 000-MW antigen (dose calculated as 1% 16 000-MW Ag content in the injected MTSE). Following immunization with 1 µg of rPT16, antibody levels again did not differ significantly between the heterozygous and hemizygous mice (P > 0·05), but were significantly lower than in B10.BR mice (P = 0·019; P = 0·012). The similarity of responses in the presence or absence of the Ab allele does not support its regulatory role in the AαbAβb heterodimer-carrying LR mice.
Figure 3.
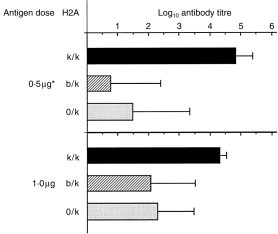
Comparison of antibody responses in the presence and absence of the Ab allele. Mice from the heterozygous (H2Ak/b) and hemizygous (H2A0/k) segregant progeny of the (Aβ0/b × B10.BR) cross were immunized with the 16-000 MW antigen (see the legend to Figure 1). Mean (n = four to 11) IgG ABT30 ± SD (horizontal bars) values. *50 µg of soluble extract from the Mycobacterium tuberculosis strain H37Rv (MTSE) with a content of 0·5 µg of the 16 000 MW protein.
The role of mixed haplotype recognition by high-Ag-dose primed T cells
We further compared directly the antigen-presenting capacities of the non-immune HR, LR hetero- and hemizygous APCs from non-immune mice. This function was tested in respect of responder heterozygous (Ak/b) T cells purified from LN cells of mice primed with the ‘high’ 30-µg dose of rPT16, in order to exclude the limiting Ag dose effect of priming. As predicted, rPT16-stimulated proliferation in vitro was supported by Ak/k (HR), but not by Ab/b (LR) irradiated spleen cells (Fig. 4). Unexpectedly, however, heterozygous Ak/b spleen cells either from (B10.BR × B10)F1 (‘k/b’) or from the (Aβ0/b × B10.BR) (‘b/k’) segregants resulted in significantly (P < 0·001) higher proliferation when compared with homozygous Ak/k or hemizygous A0/k APCs. Perhaps T cells primed in an F1 environment had come to prefer peptide presentation in the context of mixed H2A heterodimers (e.g. AαkAβb). This explanation is supported particularly by the poor function of Aβ0xk APC, which have the same HR gene dosage as Abxk APC, but owing to the lack of Aβb, are limited in their ability to display mixed heterodimers.
Figure 4.
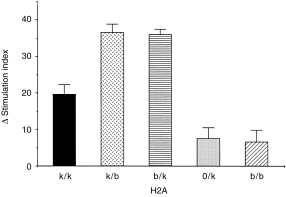
Enhanced antigen-presenting cell (APC) capacity of Ak/b spleen cells: evidence for mixed heterodimer restricted T-cell responses to the recombinant 16 000-MW protein of Mycobacterium tuberculosis (rPT16). Lymph node (LN) cells from 20 µg of rPT16/Freund’s incomplete antigen (FIA)-primed (B10.BR × B10)F1 mice were nylon wool purified and cultured in the presence of 5 µg/ml of rPT16 and irradiated spleen cells from: non-immune B10.BR(Ak/k), (B10.BR × B10)F1(Ak/b) or B10(Ab/b) strains; heterozygous (Ab/k) and hemizygous (A0/k) segregant progeny of the (Aβ0/b × B10.BR) cross. Δ Stimulation index (SI) values were corrected for values obtained from phosphate-buffered saline (PBS)/FIA-injected mice.
We next investigated whether there was a genetic difference in APC capacities for the recognition of different peptides, derived from the 16 000-MW antigen.28 For this analysis, again the ‘high’ 30 µg rPT16-primed LN cells were used to prepare the responder T-cell lines. As expected, the proliferation of B10.BR or (B10.BR × B10)F1 T-cell lines to rPT16 were best supported by the homologous, i.e. Ak/k and Ak/b APCs, respectively (Fig. 5). When comparing antipeptide specificities, the Ak/k APC preference of the B10.BR T-cell line was pronounced in response to peptides 1–20 and 61–80 (Fig. 5a). In contrast, the prominent APC preference of the F1 line was directed to p131–144 (Fig. 5b). Notably, this peptide was not recognized by a different T-cell line generated from 1 µg of rPT16-primed Ab/k mice, thus indicating the high, 30-µg rPT16 priming requirement for p131–144 recognition (results not shown). These results demonstrate the distinct (p131–144) epitope specificity of T-cell recognition in the context of mixed AαkAβb heterodimers.
Figure 5.
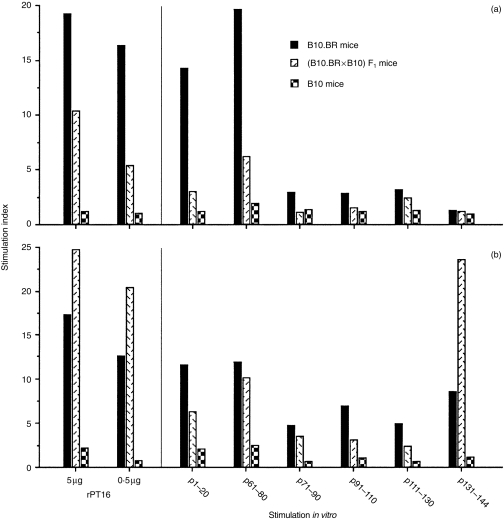
Differences in peptide specificity and between Ak/b- and Ak/k-derived T cells. T-cell lines were generated using lymph node (LN) cells from 30 µg of the recombinant 16 000-MW protein of Mycobacterium tuberculosis (rPT16)-primed B10.BR (a) and (B10.BR × B10)F1 (b) mice. Cultured T cells were stimulated with rPT16 and with six different synthetic 20-mer peptides (30 µg/ml) derived from the PT16 sequence. Cultures were supplemented with irradiated spleen cells from non-immune B10.BR, (B10.BR × B10)F1 hybrid, or B10 mice.
Genetic control of T-cell responses to peptide 111–130
We then examined whether the low Ag dose-dependent recessive control of T-cell responses to the whole protein was also valid for its immunodominant peptide determinant. For this analysis we used peptide 111–130 because it has been consistently immunodominant for LN cell proliferation in the context of Ak (results not shown), although it was not recognized by the T-cell lines examined (see above). Interestingly, the results showed different genetic profiles of the proliferative responses following priming of mice with rPT16 and p111–130, respectively (Fig. 6). Priming with the low (3 µg) dose of rPT16 induced a recessive phenotype (P < 0·01 between B10.BR and F1), while the high (10 µg) dose resulted in the codominant proliferative response (Fig. 6a). Similar results were obtained following stimulation in the range of 3–20 µg/ml of p111–130. These results confirm the recessive pattern of in vitro stimulation observed with the whole rPT16 protein (see Fig. 2a). However, the failure of even high (10 µg) rPT16-primed B10 (Ab/b) LN cells to respond to p111–130, suggested that this epitope is immunodominant in the context of Ak, but cryptic in the context of Ab.
Figure 6.
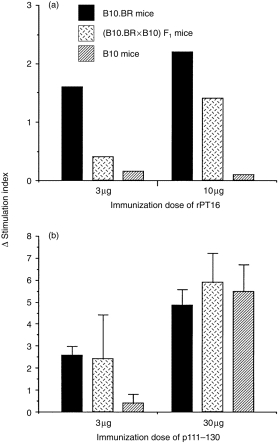
Recessive genetic control of T-cell responses occurs following immunization with whole protein, but not with synthetic peptide. Following in vivo priming of mice (five per group) with either the recombinant 16 000-MW protein of Mycobacterium tuberculosis (rPT16) (a) or p111–130 (b), lymph node (LN) cells were stimulated in vitro with 3 µg/ml of 111–130 peptide. The columns represent mean proliferation values (see the legend to Figure 2) for the B10.BR, (B10.BR × B10)F1 and B10 strains.
In contrast with rPT16 priming, immunization of mice with a low dose (3 µg) of p111–130 resulted in a codominant response (Akk = Abk < Abb) (Fig. 6b). Although the molar dose of peptide was ≈ eight times higher than of the protein, the relatively low SI values make it unlikely that a recessive response pattern would have ensued following priming with an even lower peptide dose. However, priming with 30 µg of p111–130 completely overrode H2 restriction, resulting in equally high T-cell proliferation of B10 LN cells. This result suggests that p111–130, although immunodominant and of high affinity in the context of Ak, is of low affinity as a cryptic epitope in the context of Ab. The finding of recessive genetic control following low-dose protein, but not after peptide priming, suggests that the limiting antigen concentration is required at some stage of processing of the native antigen, which does not take place in the course of immunization with the synthetic peptide.
Discussion
The closely observed antigen dose–response analysis in respect of the rPT16 antigen provides a plausible quantitative explanation for the recessive expression of MHC gene control of immune responses. The results suggested that discrete differences in the immunizing Ag dose have a critical influence, essentially changing a recessive phenotype at low dosage to a genetically dominant phenotype at higher dosage. Previously, the role of Ag dose in defining the recessive phenotype was reported for immune responses to sheep erythrocytes29 and to α-amylase.30 Our observations, together with these earlier publications, suggest that simple stoichiometric factors could explain the recessive Ir gene phenotype. However, our results fail to support the previously proposed concept of LR allele-mediated immunoregulatory mechanisms for the recessive MHC control. This conclusion is derived particularly from the lack of significant differences between the responses in heterozygous H2Ab/k and hemizygous H2A0/k mice. However, our results do not preclude the possibility that regulatory mechanisms play a role in other systems. One should also bear in mind that the C57BL/10 LR strain has been found to be immune deficient in a number of immune features.11,31
In an attempt to gain insight into the mechanisms involved in the antigen dose-dependent change in the genetic restriction phenotype, we investigated the cellular expression of the costimulatory B7-2 receptor. Notably, its densities on B cells were found to retain the recessive genetic pattern, even after high-dose Ag priming under conditions that had fully overridden the genetic restriction on T-cell proliferation and IFN-γ production. This finding suggests that MHC density has an overriding influence on the regulation of B7-2 expression, by cognate interaction between the T-cell receptor and the MHC/peptide complex on B cells.32 The lack of antigen compensation in this case may be a result of the insufficient activation of the 7-day primed LN B cells and cannot be generalized for B7-2 expression on other cell types. Thus, LN-derived dendritic cells could have provided the costimulatory signals for the high-Ag-dose primed T cells for enhancing their proliferation and IFN-γ responses, but not for producing sufficient interleukin-4 (IL-4), which is essential for inducing B7-2 expression on B cells.33 However, the Ag dose-mediated reversal of genetic restriction of antibody responses could have involved B7-2 costimulation of T helper 2 (Th2) cell maturation34 from the more mature, 3-week primed memory B cells. These interpretations need further study of genetic influences of B7-2 expression on B and accessory cells at different stages of maturation.
Our analysis suggests that a significant proportion of high-Ag-dose primed F1 T cells became either restricted by mixed heterodimers or prefer lower levels of Ak expression on APCs. To distinguish between these possibilities, we used Aβ0 × Ak APC, which have the same Ak HR gene dosage as Ab × Ak F1 APC, but owing to lack of Aβb are limited in their ability to display mixed heterodimers. In contrast to Ab × Ak F1 APC, those of the Aβ0 × Ak genotype were clearly inferior in eliciting rPT16-specific T-cell responses. These results suggest that a significant proportion of T cells respond in the context of mixed heterodimers and that the relevant restriction element is probably AαkAβb. Our conclusion is supported also by the finding of different peptide-recognition specificities of T-cell lines, which had been selected in the context of Ak/k and Ak/b, respectively. These data corroborate previous findings of T-cell restriction by mixed heterodimers in response to insulin35 and to lysozyme36 and also with the report that F1 T cells recognized two lysozyme determinants which were not revealed by any of the parental T cells.37
The response to peptide 111–130 was found to be immunodominant only when presented by the Ak, but ‘absolutely’ (i.e. even at high Ag dose) cryptic in the context of Ab. Thus, the definition of T-cell epitopes as immunodominant or cryptic is intimately associated with the host MHC haplotype. Furthermore, it is interesting that recessive genetic control was demonstrable only for the immunodominant (rPT16 primed) response, but not for the cryptic (peptide primed) response. The requirement for priming with the whole protein to reveal the recessive expression of MHC control indicates the involvement of a critically Ag dose-dependent mechanism at an early stage of Ag processing.
Taking together the genetic, serological and T-cell analysis, our data suggest that recessive expression of MHC control in our experimental system can be explained on the grounds of stoichiometric factors combining both gene and antigen dosage, without invoking a regulatory role of the LR allele. Tentatively, our results indicate that the higher Ag dose requirements for T-cell recognition in the context of MHC heterodimers, compared with the homozygous HR allele, and the lower expression of costimulatory molecules in the hemizygous genotype could represent some of the pertinent mechanisms.
Acknowledgments
We thank Carlos Moreno and Peter Byfield for the supply of synthetic peptides, and thank Avrion Mitchison for valuable comments on the manuscript.
References
- 1.Benacerraf B, Germain RN. The immune response genes of the major histocompatibility complex. Immunol Rev. 1978;38:70. doi: 10.1111/j.1600-065x.1978.tb00385.x. [DOI] [PubMed] [Google Scholar]
- 2.Silver DM, Lane DP. Dominant nonresponsiveness in the induction of autoimmunity to liver-specific F antigen. J Exp Med. 1975;142:1455. doi: 10.1084/jem.142.6.1455. [DOI] [PMC free article] [PubMed] [Google Scholar]
- 3.Oliveira DB, Mitchison NA. Immune suppression genes. Clin Exp Immunol. 1989;75:167. [PMC free article] [PubMed] [Google Scholar]
- 4.Debre P, Kapp JA, Dorf ME, Benacerraf B. Genetic control of specific immune suppression. II. H-2-linked dominant genetic control of immune suppression by the random copolymer l-glutamic acid50-l-tyrosine50 (GT) J Exp Med. 1975;142:1447. doi: 10.1084/jem.142.6.1447. [DOI] [PMC free article] [PubMed] [Google Scholar]
- 5.Wicker LS, Hildemann WH. Two distinct high immune response phenotypes are both controlled by H-2 genes mapping K or I-A. Immunogenetics. 1981;12:253. doi: 10.1007/BF01561668. [DOI] [PubMed] [Google Scholar]
- 6.Mitchison NA, Simon K. Dominant reduced responsiveness controlled by H-2 (Kb) Ab. A new pattern evoked by Thy-1 antigen and F liver antigen. Immunogenetics. 1990;32:104. doi: 10.1007/BF00210447. [DOI] [PubMed] [Google Scholar]
- 7.Oliveira DB, Blackwell N, Virchis AE, Axelrod RA. T helper and T suppressor cells are restricted by the A and E molecules, respectively, in the F antigen system. Immunogenetics. 1985;22:169. doi: 10.1007/BF00563514. [DOI] [PubMed] [Google Scholar]
- 8.Wassom DL, Krco CJ, David CS. I-E expression and susceptibility to parasite infection. Immunol Today. 1987;8:39. doi: 10.1016/0167-5699(87)90236-2. [DOI] [PubMed] [Google Scholar]
- 9.Simpson E, Lieberman R, Ando I, Sachs DH, Paul WE, Berzovsky JA. How many class II immune response genes? A reappraisal of the evidence. Immunogenetics. 1986;23:302. doi: 10.1007/BF00398792. [DOI] [PubMed] [Google Scholar]
- 10.Mitchison NA, Brunner MC. Association of H2Ab with resistance to collagen-induced arthritis in H2-recombinant mouse strains: an allele associated with reduction of several apparently unrelated responses. Immunogenetics. 1995;41:239. doi: 10.1007/BF00172065. [DOI] [PubMed] [Google Scholar]
- 11.Gustavsson S, Hjulstrom Chomez S, Lidstrom BM, Ahlborg N, Andersson R, Heyman B. Impaired antibody responses in H-2Ab mice. J Immunol. 1998;161:1765. [PubMed] [Google Scholar]
- 12.Haber J, Paradis G, Grinnell CM. Dominant low responsiveness in the IgG response of mice to the complex protein antigen type 1 fimbriae from Actinomyces viscosus T14V. J Immunol. 1991;146:1949. [PubMed] [Google Scholar]
- 13.Jensen PE, Kapp JA, Pierce CW. The role of suppressor T cells in the expression of immune response gene function. J Mol Cell Immunol. 1987;3:267. [PubMed] [Google Scholar]
- 14.Silver DM, Lane DP. Polygenic control of the immune response to F antigen. Immunogenetics. 1981;12:237. doi: 10.1007/BF01561667. [DOI] [PubMed] [Google Scholar]
- 15.Oliveira DB, Nardi NB. Immune suppression genes control the anti-F antigen response in F1 hybrids and recombinant inbred sets of mice. Immunogenetics. 1987;26:359. doi: 10.1007/BF00343705. [DOI] [PubMed] [Google Scholar]
- 16.Bogen B. Dominant suppressive effect of the silent Eb alpha allele on an in vivo T helper cell response under Ed beta Ed alpha region-linked immune response gene control. Eur J Immunol. 1985;15:1033. doi: 10.1002/eji.1830151014. [DOI] [PubMed] [Google Scholar]
- 17.Brunner M, Larsen S, Sette A, Mitchison A. Altered Th1/Th2 balance associated with the immunosuppressive/protective effect of the H-2Ab allele on the response to allo-4-hydroxyphenylpyruvate dioxygenase. Eur J Immunol. 1995;25:3285. doi: 10.1002/eji.1830251213. [DOI] [PubMed] [Google Scholar]
- 18.Conrad PJ, Janeway CJ. The expression of I-Ed molecules in F1 hybrid mice detected with antigen-specific, I-Ed-restricted cloned T-cell lines. Immunogenetics. 1984;20:311. doi: 10.1007/BF00364212. [DOI] [PubMed] [Google Scholar]
- 19.Guardiola J, Maffeia Lauster R, Mitchison A, Accolla R, Sartoris S. Functional significance of polymorphism among MHC class II gene promoters. Tissue Antigens. 1996;48:615. doi: 10.1111/j.1399-0039.1996.tb02684.x. [DOI] [PubMed] [Google Scholar]
- 20.Janitz M, Mitchison A, Reiners-schramm L, Lauster R. Polymorphic MHC class II promoters exhibit distinct expression pattern in various antigen-presenting cell lines. Tissue Antigens. 1997;49:99. doi: 10.1111/j.1399-0039.1997.tb02721.x. [DOI] [PubMed] [Google Scholar]
- 21.Baumgart M, Moos V, Schuhbauer D, Muller B. Differential expression of major histocompatibility complex class II genes on murine macrophages associated with T cell cytokine profile and protective/suppressive effects. Proc Natl Acad Sci USA. 1998;95:6936. doi: 10.1073/pnas.95.12.6936. [DOI] [PMC free article] [PubMed] [Google Scholar]
- 22.Cowell L, Kepler T, Janitz M, Lauster R, Mitchison A. The distribution of variation in regulatory gene segments, as present in MHC class II promoters. Genome Res. 1998;8:124. doi: 10.1101/gr.8.2.124. [DOI] [PubMed] [Google Scholar]
- 23.Ivanyi J, Sharp K. Control by H-2 genes of murine antibody responses to protein antigens of Mycobacterium tuberculosis. Immunology. 1986;59:329. [PMC free article] [PubMed] [Google Scholar]
- 24.Vaz NM, Levine BB. Immune responses of inbred mice to repeated low doses of antigen: relationship to histocompatibility (H-2) type. Science. 1970;168:852. doi: 10.1126/science.168.3933.852. [DOI] [PubMed] [Google Scholar]
- 25.Young CR, Atassi MZ. Genetic control of the immune response to myoglobin. IX. Overcoming genetic control of antibody response to antigenic sites by increasing the dose of antigen used in immunization. J Immunogenet. 1982;9:343. doi: 10.1111/j.1744-313x.1982.tb00992.x. [DOI] [PubMed] [Google Scholar]
- 26.Gosgrove D, Gray D, Dietrich A, et al. Mice lacking MHC class II molecules. Cell. 1991;66:1051. doi: 10.1016/0092-8674(91)90448-8. [DOI] [PubMed] [Google Scholar]
- 27.Wilkinson RJ, Wilkinson KA, De Smet KAL, et al. Human T and B cell reactivity to the 16 kDa major latency protein of Mycobacterium tuberculosis. Scand J Immunol. 1998;48:403. doi: 10.1046/j.1365-3083.1998.00420.x. [DOI] [PubMed] [Google Scholar]
- 28.Vordermeier HM, Harris DP, Lathigra R, Roman E, Moreno C, Ivanyi J. Recognition of peptide epitopes of the 16,000 MW antigen of Mycobacterium tuberculosis by murine T cells. Immunology. 1993;80:6. [PMC free article] [PubMed] [Google Scholar]
- 29.Mouton D, Heumann AM, Bouthillier Y, Mevel JC, Biozzi G. Interaction of H-2 and non H-2 linked genes in the regulation of antibody response to a threshold dose of sheep erythrocytes. Immunogenetics. 1979;8:475. [Google Scholar]
- 30.Nakashima S. Isoelectric focusing spectra of anti-bacterial alpha-amylase antibody unique for antigen-induced suppression. Immunology. 1986;57:319. [PMC free article] [PubMed] [Google Scholar]
- 31.Sirova M, Riha I, Rihova B. Limited T helper cell activity in C57BL/10 (B10) mice with inherited low IgG responsiveness. Scand J Immunol. 1996;44:453. doi: 10.1046/j.1365-3083.1996.d01-337.x. [DOI] [PubMed] [Google Scholar]
- 32.Nabavi N, Freeman GJ, Gault A, Godfrey D, Nadler LM, Glimcher LH. Signalling through the MHC class II cytoplasmic domain is required for antigen presentation and induces B7 expression. Nature. 1992;360:266. doi: 10.1038/360266a0. [DOI] [PubMed] [Google Scholar]
- 33.Stack RM, Lenschow DJ, Gray GS, Bluestone JA, Fitch FW. IL-4 treatment of small splenic B cells induces costimulatory molecules B7 and B7. J Immunol. 1994;152:5723. [PubMed] [Google Scholar]
- 34.Ranger AM, Das MP, Kuchroo VK, Glimcher LH. B7 (CD86) is essential for the development of IL-4-producing T cells. Int Immunol. 1996;8:1549. doi: 10.1093/intimm/8.10.1549. [DOI] [PubMed] [Google Scholar]
- 35.Reske-kunz A, Rude E. Insulin-specific T cell hybridomas derived from (H-2b × H-2k), F1 mice preferably employ F1-unique restriction elements for antigen recognition. Eur J Immunol. 1985;15:1048. doi: 10.1002/eji.1830151017. [DOI] [PubMed] [Google Scholar]
- 36.Moreno J, Adorini L, Hammerling GJ. Co-dominant restriction by a mixed-haplotype I-A molecule (alpha k beta b) for the lysozyme peptide 52 in H-2k × H-2b, F1 mice. J Immunol. 1990;144:3296. [PubMed] [Google Scholar]
- 37.Bhardway V, Kumar V, Grewal IS, et al. T cell determinant structure of myelin basic protein in B10.PL, SJL/J, and their F1S. J Immunol. 1994;152:3711. [PubMed] [Google Scholar]


