

Abstract
Background
The increasing prevalence of overweight and obesity underscore the need for evidence-based, easily disseminable interventions for weight management that can be delivered on a population basis. The Transtheoretical Model (TTM) offers a promising theoretical framework for multiple behavior weight management interventions.
Methods
Overweight or obese adults (BMI 25–39.9; n = 1277) were randomized to no-treatment control or home-based, stage-matched multiple behavior interventions for up to three behaviors related to weight management at 0, 3, 6, and 9 months. All participants were re-assessed at 6, 12, and 24 months.
Results
Significant treatment effects were found for healthy eating (47.5% versus 34.3%), exercise (44.90% versus 38.10%), managing emotional distress (49.7% versus 30.30%), and untreated fruit and vegetable intake (48.5% versus 39.0%) progressing to Action/Maintenance at 24 months. The groups differed on weight lost at 24 months. Co-variation of behavior change occurred and was much more pronounced in the treatment group, where individuals progressing to Action/Maintenance for a single behavior were 2.5–5 times more likely to make progress on another behavior. The impact of the multiple behavior intervention was more than three times that of single behavior interventions.
Conclusions
This study demonstrates the ability of TTM-based tailored feedback to improve healthy eating, exercise, managing emotional distress, and weight on a population basis. The treatment produced a high level of population impact that future multiple behavior interventions can seek to surpass.
Keywords: multiple behavior interventions, weight management, Transtheoretical Model, co-variation of behavior change, obesity, physical activity, nutrition
Introduction
The increasing prevalence of overweight and obesity is associated with significant public health consequences (Adams et al., 2006; CDC, 2006; Flegal et al. 2002). A number of intensive, clinic-based treatment options for the treatment of obesity are available. Riebe et al. (2003), for example, examined the efficacy of a multiple behavior group-based, 6-month program based on the Transtheoretical Model of Behavior Change (TTM) that intervened on physical activity, nutrition, and behavior change. The participants (n = 144) demonstrated significant reductions in weight, percent of calories from fat, and caloric intake, as well as increases in VO2max, at the end of treatment (Riebe et al., 2003). While participants maintained reductions in weight and caloric intake and increases in weekly exercise minutes at 24 months, there was evidence of gradual loss of those improvements during the follow-up period. Furthermore, there were no differences on percent of calories from fat, and fruit and vegetable intake had declined from baseline (Riebe et al., 2005).
Consumers have expressed a desire for alternatives to clinic-based weight management interventions (Sherwood et al., 1998). Experts in the field (e.g., Perri, 1998) are calling for effectiveness studies of innovative and cost-effective strategies to improve long-term outcomes of clinic-based weight management programs. Easily disseminable interventions with sustained effectiveness delivered outside of clinic or group settings are needed. Home-based interventions offer a promising alternative. Individualized interventions are important for those not prepared to change multiple behaviors that are essential to managing weight (USDHHS, 2005).
Randomized trials of Internet-based weight management interventions (Tate et al, 2001; 2003) indicate that personalized guidance from counselors for those prepared to change can affect weight immediately post-treatment. Follow-up data, however, were unavailable to determine if the treatment effects were sustained. Glasgow et al. (2004) and Prochaska and Prochaska (in press) report that sustainable multiple behavior interventions are patient-centered, tailored, proactive, population-based, and ongoing.
Success of multiple behavior interventions based on the Transtheoretical Model (TTM) that fulfill the guidelines set forth by Glasgow et al. (2004) and Blue and Black (2005), (e.g., Prochaska et al., 2004; Prochaska et al., 2005) suggests that TTM offers a promising framework for multiple risk weight management interventions. The TTM is an integrative model of behavior change that incorporates process oriented variables to explain and predict how and when individuals change behaviors. In addition to the central organizing construct, stage of change, the TTM integrates several other behavior change constructs including decisional balance, processes of change, and self-efficacy (Prochaska, Redding, & Evers, 2002). A randomized trial of TTM-based interventions for diabetes self-management indicated the intervention group was significantly more likely to move to Action and Maintenance (A/M) stages for self-monitoring of blood glucose and healthy eating (Jones et al., 2003). Prochaska et al. (2004) reported that home-based, TTM interventions outperformed usual care for smoking cessation, sun exposure, and dietary fat reduction. A second study demonstrated that TTM interventions had significant effects at 24 months on four behaviors: smoking, dietary fat, sun exposure, and mammography (Prochaska et al., 2005). Johnson et al. (2006) reported that, when paired with fully tailored interventions for lipid-lowering medication adherence, stage-matched interventions had significant effects on physical activity and dietary fat reduction.
The purpose of this study was to conduct the first randomized effectiveness trial with a one-year extended follow-up to examine the impact of fully tailored, home-based, TTM-based multiple behavior interventions targeting behaviors essential to healthy weight management in a population of overweight and obese adults. This study is among the first to examine the co-variation of multiple behavior changes involved in healthy weight management and the potential population impact of multiple behavior interventions for weight management.
Methods
Subjects
A sample of 1277 were recruited nationwide and randomized to treatment or control, with n = 1101 from large employers; n = 126 from Centerwatch.com, a website with clinical trial listings; and n = 46 who were ineligible for another study. Of the sample, 58.5% were recruited using proactive calls, and 41.5% were recruited reactively by emails or ads. Recruitment among eligibles was 79.6% (see Figure 1 and Table 1).
Figure 1.

Recruitment Information
Table 1.
Screen Out Criteria
| Screen Out Criteria | N |
|---|---|
| Age (under 18 or over 75) | 2 |
| Body Mass Index (below 25 or above 39.9) | 375 |
| Heart Attack in previous three months | 2 |
| Angioplasty in previous three months | 1 |
| Heart Failure | 4 |
| Surgery in previous three months | 28 |
| Eating Disorder | 21 |
| Cancer | 4 |
| Pregnant or Nursing | 12 |
| Participation in formal or commercial weight management program | 46 |
| Not in a pre-action stage for Healthy Eating and/or Exercise | 213 |
|
| |
| Total | 708 |
Procedure
Participants completed baseline assessments by phone. At 3, 6, 9, 12, and 24 months, mail assessments were sent, followed by telephone for non-responders. This standard mixed-mode assessment has been used in a number of previous effectiveness studies of population-based interventions (e.g., Prochaska et al., 2005; Prochaska et al., 2004; Velicer et al., 1999). The 3 and 9 month assessments were for intervention purposes. A subsample (N = 202) completed objective measures of weight, physical activity, and food intake at baseline, 12 and 24 months. Figure 2 presents the retention rates. All procedures were approved by the Institutional Review Board at Pro-Change Behavior Systems, Inc.
Figure 2.
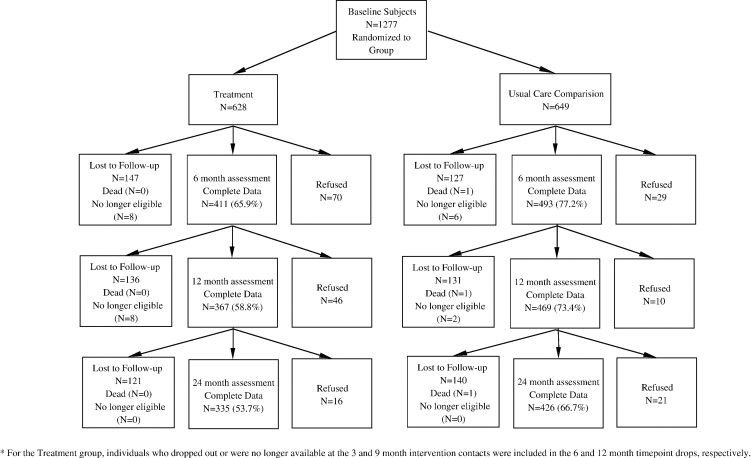
Retention Rates for Each Time Point
Treatment Group
The treatment group (n = 628) received four series of individualized reports (3–6 pages) tailored on TTM constructs (stage of change, decisional balance, self-efficacy, and processes of change) based on assessments at baseline, 3, 6, and 9 months. Participants received computer-generated tailored reports for up to three behaviors at each timepoint: healthy eating (reducing dietary fat to 30% of calories and calorie reduction of 500 calories per day); moderate exercise (working toward at least 30 minutes of moderate exercise on at least 5 days per week); and managing emotional distress without eating (using healthy strategies rather than eating to cope). Individuals did not receive reports for behaviors for which they were in Maintenance. Baseline reports provided normative feedback (compared to peers in same stage who were successful). Follow-up reports provided normative and ipsative (compared to self) feedback. Intervention mailings were staggered based on readiness such that the reports for which individuals were more prepared to change were mailed first. In the event that a participant was in the same stage of change for two or more behaviors, the reports were mailed in the following order: healthy eating, exercise, managing emotional distress. The first report was mailed within a week of the assessment and was accompanied by a multiple-behavior, stage-based manual.
Control Group
The no-treatment control group completed measures at baseline, 6, 12, and 24 months.
Measures
Height and Weight (shoeless, in light street clothing) were self-reported. Self-reported weight correlated .99 with calibrated balance beam scale weight in the 202 participants with objective measures (collected separately by different research assistants). The mean difference between self-reported and measured weight at baseline was −1.64 (2.32) kg. This suggests highly accurate self-report, as the difference represents only 1.8% of baseline weight. A two-way repeated measures ANOVA using treatment group as the independent variable demonstrated that there is no treatment group difference on under-reporting of weight, F(1,177) = .02, p > .05.
Stage of Change for Exercise
This reliable and valid measure (Sarkin et al., 2001) assessed readiness to engage in moderate exercise at least 30 minutes per day 5–7 days per week. The Godin Leisure-Time Exercise Questionnaire (GLTEQ: (Godin & Shepard, 1985) varied significantly by stage F(3,846) = 79.43, p < .001. All three items (strenuous, r(101) = .223, p < .05; moderate, r(101) = .222, p < .05; and mild, r(101) = .211, p < .05) correlated significantly to moderate/vigorous activity measured on the subsample using uni-axial Actigraph accelerometers.
Stage of Change for Healthy Eating assessed readiness to reduce calories by 500 a day and dietary fat to less than 30%. Subscale scores on a behavioral measure of eating (Johnson, et al. 1999) varied significantly by stage (F(4,1254) = 43.29, p < .001), as did estimates of dietary fat consumption as measured by the Fred Hutchinson Food Frequency Questionnaire (FFQ) in the subsample completing objective measures. Those in Action and Maintenance had significantly lower fat intake (mean = 29%) than those in pre-action stages (i.e., Precontemplation, Contemplation, and Preparation) (mean = 35%), F(1, 152) = 5.59, p < .05, η2 = .04.
Stage of Change for Managing Emotional Distress assessed readiness to not rely on eating to cope with emotional distress. The 9-item Distress Eating Scale (α = .90; Johnson et al., 1999), varied significantly across the stages, F(4,693) = 97.73, p < .001.
Stage of Change for Fruit and Vegetable Intake
Although an indirect intervention target, readiness to eat at least five servings per day of fruits and vegetables was assessed (LaForge et al., 1994; Cummins et al., 2006). Number of servings measured by the summation method in the FFQ varied significantly across stages at Baseline F(4,148) = 9.20, p < .001, η2 = .20.
Statistical Analyses
A 2 × 4 factorial repeated measures design compared treatment and control groups at 0, 6, 12, and 24 months. Efficacy was assessed for primary (healthy eating and exercise) and secondary outcomes (managing emotional distress and weight). Multiple imputation (MI) (Rubin, 1987; Harel & Zhou, 2007) was used to estimate missing data for the 6, 12 and 24 month assessments. MI, which Schafer and Graham (2002) describe as the state of the art for missing value replacement, uses a simulation technique to replace each missing value with a set of plausible values, resulting in multiple complete datasets that differ only in the imputed values. For the current study, 10 datasets were imputed using Multivariate Imputation by Chained Equations (Van Buuren & Oudshoorn, 2004), which is implemented by R package ‘mice’ version 1.16. The imputation model included baseline variables related to outcomes being imputed and to missingness. The complete datasets were analyzed using complete data methodology—in this case, Generalized Estimating Equations (GEE) examining repeated measures effects—and the results pooled by using SAS v9.1 PROC GENMOD and PROC MI respectively. Statistical significance of the pooled results was evaluated using a t-test and degrees of freedom that take into account the uncertainty in the data and the uncertainty due to missing values. GEE allows analysis of longitudinal data for both continuous and categorical outcomes (Zeger & Liang, 1986). All GEEs, which were run with an unstructured variance matrix, used the control group as reference.
Analyses included individuals in pre-action stages at baseline for each behavior with progressing to A/M defining treatment success. Individuals in Action or Maintenance at baseline were necessarily excluded as they were already at criteria for the behavioral outcomes. Since participants in the analyses were in pre-action at baseline, that time point was excluded from the GEE as the group effect is of most interest.
Results
Table 2 presents the demographics and baseline stage distributions for the two groups.
Table 2.
Baseline Demographic Information
| Comparison | Treatment | Total | |
|---|---|---|---|
| Gender | |||
| Male | 50.8% (330) | 54.4% (341) | 52.6% (671) |
| Female | 49.2% (319) | 45.6% (286) | 47.4% (605) |
| Ethnicity | |||
| American Indian or Alaskan Native | 0.8% (5) | 1.0% (6) | 0.9% (11) |
| Asian/Other Pacific Islander | 0.8% (5) | 1.1% (7) | 0.9% (12) |
| Black, not Hispanic | 7.1% (46) | 5.8% (36) | 6.5% (82) |
| Hispanic | 8.4% (54) | 5.6% (35) | 7.0% (89) |
| White, not Hispanic | 78.0% (503) | 80.2% (502) | 79.1% (1005) |
| Other | 4.8% (31) | 5.9% (37) | 5.4% (68) |
| Missing | 0.2% (1) | 0.5% (3) | 0.3% (4) |
| Income | |||
| Under $25,000 | 4.1% (25) | 4.4% (26) | 4.2% (51) |
| $25–50,000 | 28.5% (176) | 23.6% (140) | 26.1% (316) |
| $50–75,000 | 35.5% (219) | 31.4% (186) | 33.5% (405) |
| $75,000+ | 31.9% (197) | 40.6% (241) | 36.2% (438) |
| Children | |||
| No | 13.8% (89) | 13.1% (82) | 13.5% (171) |
| Yes | 86.2% (556) | 86.9% (543) | 86.5% (1099) |
| Employment | |||
| Full-Time | 85.8% (554) | 86.1% (538) | 85.9% (1092) |
| Part-Time | 4.6% (30) | 5.3% (33) | 5.0% (63) |
| Homemaker | 3.6% (23) | 2.7% (17) | 3.1% (40) |
| Retired | 3.9% (25) | 3.5% (22) | 3.7% (47) |
| Unemployed | 0.6% (4) | 0.6% (4) | 0.6% (8) |
| Unable to work | 1.5% (10) | 1.8% (11) | 1.7% (21) |
| Ever enrolled in formal weight management program | |||
| No | 74.4% (483) | 71.8% (450) | 73.1% (933) |
| Yes | 25.6% (450) | 28.2% (177) | 26.9% (343) |
| Healthy Eating | |||
| Precontemplation | 17.1% (110) | 17.22% (107) | 17.1% (217) |
| Contemplation | 8.2% (53) | 10.1% (63) | 9.1% (116) |
| Preparation | 62.8% (405) | 61.5% (383) | 62.1% (788) |
| Action | 6.0% (39) | 5.1% (32) | 5.6% (71) |
| Maintenance | 5.9% (38) | 6.1% (38) | 6.0% (76) |
| Exercise | |||
| Precontemplation | 9.3% (58) | 10.7% (65) | 10.0% (123) |
| Contemplation | 12.1% (75) | 12.7% (77) | 12.4% (152) |
| Preparation | 35.6% (221) | 35.9% (217) | 35.7% (438) |
| Action | 10.8% (67) | 11.1% (67) | 10.9% (134) |
| Maintenance | 32.2% (200) | 29.6% (179) | 30.9% (379) |
| Emotional Distress | |||
| Precontemplation | 3.9% (14) | 6.8% (23) | 5.3% (37) |
| Contemplation | 11.0% (40) | 11.5% (39) | 11.3% (79) |
| Preparation | 48.9% (177) | 48.7% (165) | 48.8% (342) |
| Action | 9.9% (36) | 12.7% (43) | 11.3% (79) |
| Maintenance | 26.2% (95) | 20.4% (69) | 23.4% (164) |
| Used Internet to manage weight | |||
| No | 81.8% (530) | 82.9% (518) | 82.3% (1048) |
| Yes | 18.2% (118) | 17.1% (107) | 17.7% (225) |
| BMI (mean) | 30.86 | 30.64 | 30.75 |
| Age (mean) | 45.43 | 45.31 | 45.37 |
Note: Due to missing demographic information, totals may not sum to the total sample.
Healthy Eating Outcomes (n = 1121)
The treatment group had greater percentages than the control group progressing to A/M at 6 (43.9% versus 31.3%); 12 (43.10% versus 35.2%); and 24 months (47.5% versus 34.3%) (Figure 3). GEE revealed an overall group effect for all timepoints t(1, 1119) = 5.02, p < .001, OR = 1.61 (95% CI: 1.33, 1.94).
Figure 3.

Healthy Eating Treatment Success by Group (Multiple Imputation) Pre-action at Baseline Sample
red = Treatment Group
blue = Control Group
Exercise Outcomes (n = 713)
Among those in pre-action stages for exercise at baseline, there was a significant group effect t(1,711) = 2.25, p < .05, OR = 1.27 (95% CI 1.03, 1.57) beginning at 6 months that was maintained over time. Among the treatment group, 43%, 37.7% and 44.9% progressed to A/M at 6, 12, and 24 months respectively compared to 34.6%, 35.9%, and 38.1% of the control group (Figure 5).
Figure 5.

Exercise Treatment Success by Group (Multiple Imputation) Pre-action at Baseline Sample
red = Treatment Group
blue = Control Group
Managing Emotional Distress Outcomes (n = 458)
The overall GEE showed a significant group effect that was maintained at all timepoints among those in pre-action stages at baseline, t(1, 456) = 5.1, p < .001, OR = 1.89 (95% CI 1.48, 2.42). Significantly greater percentages of the treatment group achieved treatment success at 6 (44% versus 25.3%); 12 (45% versus 38.3%); and 24 months (49.7% versus 30.3%) (Figure 6).
Figure 6.

Emotional Distress Treatment Success by Group (Multiple Imputation) Pre-action at Baseline Sample
red = Treatment Group
blue = Control Group
Fruit and Vegetable Outcomes (n = 858)
Figure 4 shows significantly greater percentages of the treatment group progressed to A/M for fruit and vegetable consumption at 6 (44.0% versus 31.4%); 12 (45.3% versus 39.6%) and 24 months (48.5% versus 39.0%). The overall group effect was significant at all timepoints, t(1,856) = 5.01, p < .0001, OR = 1.63 (95% CI 1.34, 1.97).
Figure 4.

Fruit & Vegetable Treatment Success by Group (Multiple Imputation) Pre-action at Baseline Sample
red = Treatment Group
blue = Control Group
Weight Outcomes
Self-reported weight loss was evaluated separately for samples in pre-action for each primary outcome behavior (healthy eating or exercise) and for those in pre-action for both behaviors. Although not presented, the results for percent of weight loss are very similar (Johnson et al., 2007). The GEE analyses indicated that the differences between treatment groups among those in pre-action for healthy eating (n = 1121) or exercise (n = 713) were not significant when evaluated separately. Among individuals who were in a pre-action stage for both healthy eating and exercise (n = 617), however, the treatment group lost significantly more weight at final follow-up than the control group t(1, 615) = −2.12, p < .05, d = .17 (Figure 7).
Figure 7.

Weight Loss (kg) by Group – Healthy Eating & Exercise Pre-Action at Baseline Sample (Multiple Imputation)
red = Treatment Group
blue = Control Group
Among those in pre-action for healthy eating at baseline, 27.4% of the treatment group versus 20.3% lost at least 5% of their weight at 24 months, a significant overall effect in the GEE analyses that increases over time t(1, 1119) = 2.07, p < .05, OR = 1.22 (95% CI 1.01, 1.48) Among those in pre-action at baseline for exercise, more participants from the treatment group (28.8%) lost 5% or more of initial weight than among those in the control group (19.4%), with increasing differences over time, t(1,711) = 1.96, p = .05, OR = 1.32 (95% CI 0.99, 1.75). There was also an overall group effect for those in pre-action for both behaviors at baseline who received treatment t(1, 615) = 2.05, p < .05, OR = 1.35, (95% CI 1.01, 1.81) that increased over time (30% versus 18.6% losing 5% or more at 24 months, Figure 8).
Figure 8.

Percent Losing 5% or More of Baseline Body Weight by Group – Healthy Eating & Exercise Pre-Action at Baseline Sample (Multiple Imputation)
red = Treatment Group
blue = Control Group
Co-Variation of Behavior Change
To determine if co-variation of behavior change occurred differentially in treatment and control groups, the likelihood of progressing to A/M for the target behaviors was evaluated by logistic regression analyses that provided odds ratios with 95% confidence intervals for each group. In all analyses, failing to progress was the referent category. While results are reported in one direction, the converse of each odds ratio is also true. The results in Table 3 indicate that among the treatment group, those progressing to A/M were 2.52–5.18 times more likely to progress on another behavior, as compared to 1.24–2.63 times more likely among those in the control group.
Table 3.
Predictors of Progression to Action/Maintenance (A/M) for Healthy Eating, Exercise, and Managing Emotional Distress.
| Behaviors | TX OR | CI (95%) | COMP OR | CI (95%) |
|---|---|---|---|---|
| Healthy Eating (HE) | ||||
| Exercise (EX) | ||||
| 6 months | 2.52* | 1.40 – 4.54 | 1.68 | 0.91 – 3.11 |
| 12 months | 2.63* | 1.39 – 4.97 | 2.28* | 1.25 – 4.17 |
| 24 months | 3.91* | 2.04 – 7.50 | 2.63* | 1.37 – 5.05 |
|
| ||||
| Emotional Distress (ED) | ||||
| 6 months | 3.57* | 1.71 – 7.43 | 1.40 | 0.60 – 3.23 |
| 12 months | 5.18* | 2.3 – 11.67 | 2.38* | 1.12– 5.04 |
| 24 months | 3.04* | 1.27 – 7.32 | 1.44 | 0.58 – 3.56 |
|
| ||||
| Exercise (EX) | ||||
| Emotional Distress (ED) | ||||
| 6 months | 3.56* | 1.34 – 9.43 | 1.62 | 0.60 – 4.31 |
| 12 months | 2.80* | 1.01 – 7.75 | 1.24 | 0.50 – 3.05 |
| 24 months | 2.56 | .869 – 7.57 | 2.61 | 0.85 – 7.98 |
significant at p < 0.05
Impact on Multiple Behaviors
In multiple behavior interventions, measures for assessing impact must take into account the number of behaviors treated effectively and the participation rates in each of those behavioral interventions (Prochaska & Prochaska, in press). The following impact equation (Prochaska & Prochaska, in press) was employed: I = Σ# of behaviors(n) (En × Pn), where E is the efficacy for each behavior and P is the proportion of at risk individuals participating in the intervention for each behavior. With participation rates on a population basis approaching 80%, the P is 70.72% for healthy eating, 46.56% for exercise, and 28.72% for managing emotional distress. The efficacy rates are 47.5%, 44.9%, and 49.7%, respectively. Therefore, the population impact is 68.8%, which equals approximately .7 behaviors changed per person. Thus, this multiple behavior intervention had three times the behavior change impact of treating just smoking, where previous population-based single behavior interventions had impacts of approximately 20% (Prochaska et al., 2004). The population impact of 70%, may however, underestimate the true impact. This estimate fails to take into account “untreated” behaviors on which the intervention had an effect, such as fruit and vegetable consumption. Including that behavior increases the total impact to 95.1%.
Discussion
Individualized stage-matched, multiple behavior interventions had significant effects on progression to Action/Maintenance for healthy eating, exercise, managing emotional distress, and weight among those most at risk (i.e., those in pre-action) one year post-intervention. This is the first study to demonstrate the effectiveness of multiple behavior change home-based interventions targeting all of the behaviors involved in weight management in an overweight and obese sample. An unexpected and previously undocumented finding was that the intervention also impacted untreated fruit and vegetable consumption, a key health behavior. Significant and increasingly large differences occurred in the percent losing at least 5% of body weight, a change associated with clinical improvement in health indicators (Van Gaal et al., 2005; Wing et al., 1987). These findings are unique in that this was not primarily a reactively recruited clinic based sample who had to be ready to change in order to participate, as is often seen in other trials (DPP Group, 1999; Look AHEAD Research Group, 2007a, b), and participants received a relatively minimal intervention in their homes. While weight loss achieved here is slightly lower than in some previous studies (e.g., Tate, et al., 2001; 2003; Heshka et al., 2003), the present project recruited individuals in all pre-action stages and not only those prepared to change. More importantly, the weight loss curves, like the behavior change curves, were diverging a year post-intervention, which is atypical in the weight literature (Ware, 2003). This type of sustained behavior change or weight loss is rarely measured (e.g., Tate et al., 2003).
The target behaviors demonstrated significant treatment effects in the first six months and beyond. Unlike many clinic-based, intensive programs that have immediate treatment effects that taper over time when the intervention is removed, the significant treatment effects of this intervention for weight did not occur until 24 months. These results reflect that weight loss is not a behavior but rather an outcome of multiple behavior changes and that those in earlier stages may take longer to progress to Action on those behaviors. From a health perspective, the goal should be to first produce significant changes in multiple behaviors, with weight loss following over time. This treatment strategy maximizes health benefits, since healthy eating and exercise produce many health benefits in addition to those related to weight loss (Van Gaal et al., 2005).
The intervention evaluated in the present study produced high level impacts of 68.8% on multiple behavior changes. To interpret impact estimates, it is useful to think of percent impact as an estimate of the total number of behaviors changed per person. In population-based smoking interventions, for example, the average number of changes per person is 1/5 of a behavior (Velicer et al., 1999). In this study, the average number of behaviors changed per person is nearly 3/4. Thus, multiple behavior interventions have the potential to have more than three times the impact of similar single behavior interventions.
Finally, this research has important implications for understanding co-variation of behavior change in multiple-behavior interventions. Few, if any, previous studies have documented the effect changing one behavior can have on the potential to change another. Receiving treatment produced odds ratios from 2.52–5.18 that taking action on one behavior would lead to taking action on a second behavior. Notably, simply changing a behavior does not have the same effect as evidenced by smaller odds ratios (1.24 to 2.63) among those in the control group. Multiple behavior interventions tailored to TTM constructs may have a unique potential to create synergistic effects on behavior change.
Limitations of the study
Questions may be raised about why the control group did as well as they did, a finding that has emerged in other population-based intervention studies (e.g., Johnson et al., 2006; Evers et al., 2006). A leading hypothesis is that individuals assigned to the control group received much more than “usual care.” They receive three of the 5A’s (ask, assess, and arrange follow-up) (Fiore et al., 2000) that are viewed as constituting essential components of effective counseling. This combination of A’s is likely to include active change ingredients, which is supported by the fact that proactive comparison groups consistently show more change than would be expected by secular trends. Prochaska et al. (2005) found that comparison groups that received minimal (only stage or outcome assessments) and masked surveys (stage assessment on behaviors to mask the focus of the study) showed significantly less change than a proactive assessment group that received the full battery of TTM assessments.
Lack of objective measures on the entire population may be considered a limitation, but the collection of objective measures on a subsample demonstrates that self-reported data were highly correlated with objectively measured values. The correlation of self-reported and objectively measured weight in this case was .99. The accelerometer data was significantly related to the Godin, the behavioral indicator of physical activity used for the entire sample and fat intake as measured by the FFQ decreased significantly in those in Action and Maintenance for healthy eating (Johnson et al., 2007).
There is differential drop-out by treatment group at follow-up. This is likely due to the additional intervention contacts for the treatment group at 3 and 9 months. Additional contacts typically result in 5% fewer retained participants per time points. If drop-out rates at the 6 and 12 month time points are compared, excluding the 3 and 9 month drop-outs, there are no significant differences between the treatment and control groups. Additionally, there is no significant difference on drop-out at 24 months. MI allows missing data to be modeled in a sophisticated manner referred to by Schafer and Graham (2002) as state of the art. More traditional analyses (e.g., Random Effects Modeling employing ITT where missing weight values were set equal to baseline weight) as recommended by Ware (2003) resulted in remarkably similar outcomes with regard to weight (a significant effect on weight loss at 24 months F(2,615) = 4.06, p < .05 with a significant difference at 24 months t(615) = 2.03, p < .05, d = .16 and differences on percent losing 5% or more that approached significance (e.g., among those in a pre-action stage for both healthy eating and exercise, F(2,615) = 2.78, p = .06, d = .14).
In summary, this study demonstrates the ability of theoretically driven, TTM-based tailored expert system feedback for multiple behaviors to improve healthy eating, exercise, managing emotional distress, and weight on a population basis and underscores the potential synergistic effects of multiple behavior interventions. In the interest of cost-effectiveness and ease of dissemination, future research on home-based, multiple behavior interventions should include an examination of whether similar effects can be obtained using alternative delivery options (e.g., the Internet, hand-held devices) and whether optimally tailoring interventions to leverage possible co-variation of behavior change (i.e., providing complete expert system feedback for a single behavior and more minimal feedback for additional behaviors) can have similar effects. Finally, the limits on multiple behavior interventions need to be pushed: How many behaviors can we effectively intervene upon simultaneously?
Acknowledgments
This research was supported by Grant Number R44 HL070549 from the National Heart, Lung, and Blood Institute.
Footnotes
Financial Disclosures
The authors affiliated with Pro-Change Behavior Systems, Inc. are employees of said company, which is currently licensing the programs described herein. Janice Prochaska, Ph.D. is the company’s President and CEO.
Precis
Tailored, Transtheoretical Model-based interventions significantly impacted healthy eating, exercise, managing emotional distress, and weight at one year post-intervention and enhanced co-variation of behavior change in 1277 overweight and obese participants.
Publisher's Disclaimer: This is a PDF file of an unedited manuscript that has been accepted for publication. As a service to our customers we are providing this early version of the manuscript. The manuscript will undergo copyediting, typesetting, and review of the resulting proof before it is published in its final citable form. Please note that during the production process errors may be discovered which could affect the content, and all legal disclaimers that apply to the journal pertain.
References
- Adams KA, Schatzkin A, Harris T, Kipnis V, Mouw T, Ballard-Barbush R, Hollenbeck A, Leitzmann M. Overweight, obesity, and mortality in a large prospective cohort of persons 51–70 years old. N Engl J Med. 2006;355(8):763–778. doi: 10.1056/NEJMoa055643. [DOI] [PubMed] [Google Scholar]
- Blue CL, Black DR. Synthesis of intervention research to modify physical activity and dietary behaviors. Res Theory Nurs Pract. 2005;19(1):25–61. doi: 10.1891/rtnp.19.1.25.66333. [DOI] [PubMed] [Google Scholar]
- CDC. State-specific prevalence of obesity among adults-United States. MMWR. 2006;55(36):985–988. [PubMed] [Google Scholar]
- Cummins CO, Johnson JL, Mauriello LM, Paiva A, Dyment S. Empirical support for the application of the Transtheoretical Model to fruit and vegetable consumption among college students. Paper presented at the 134th Annual Meeting of the American Public Health Association; Boston, MA. 2006. [Google Scholar]
- DPP Group Diabetes Prevention Program Research Group. Design and methods for a clinical trial in the prevention of type 2 diabetes. Diabetes Care. 1999;22(4):623–634. doi: 10.2337/diacare.22.4.623. [DOI] [PMC free article] [PubMed] [Google Scholar]
- Evers KE, Prochaska JO, Johnson JL, Mauriello LM, Padula JA, Prochaska JM. A randomized clinical trial of a population-and Transtheoretical Model based stress management intervention. Health Psychol. 2006;25(4):521–529. doi: 10.1037/0278-6133.25.4.521. [DOI] [PubMed] [Google Scholar]
- Fiore M, Bailey WC, Cohen SJ, Dorfman SF, Goldstein MG, Gritz ER, Heyman RB, Jaen CR, Kottke TE, Lando HA, Mecklenburg RE, Mullen PD, Nett LM, Robinson L, Stitzer ML, Tommasello AC, Villejo L, Wewers ME. Treating Tobacco Use and Dependence. USDHHS; Public Health Service: 2000. [Google Scholar]
- Flegal KM, Carroll MD, Ogden CL, Johnson CL. Prevalence and trends in obesity among US adults, 1999–2000. JAMA. 2002;288(14):1723–1727. doi: 10.1001/jama.288.14.1723. [DOI] [PubMed] [Google Scholar]
- Harel O, Zhou XU. Multiple imputation: review of theory, implementation and software. Statist Med. 2007;26:3057–3077. doi: 10.1002/sim.2787. [DOI] [PubMed] [Google Scholar]
- Heshka S, Anderson J, Atkinson R, Greenway F, Hill JO, Phinney S, Kolotkin R, Miller-Kovach K, Pi-Sunyer FX. Weight loss with self-help compared with a structured commercial program. JAMA. 2003;289(14):1792–1798. doi: 10.1001/jama.289.14.1792. [DOI] [PubMed] [Google Scholar]
- Glasgow RE, Goldstein MG, Ockene JK, Pronk NP. Translating what we have learned into practice: Principles and hypotheses for interventions addressing multiple behaviors in primary care. Am J Prev Med. 2004;27(2S):88–101. doi: 10.1016/j.amepre.2004.04.019. [DOI] [PubMed] [Google Scholar]
- Godin G, Shepard RJ. A simple method to assess exercise behavior in the community. Can J Appl Sport Sci. 1985;10:141–146. [PubMed] [Google Scholar]
- Johnson SS, Driskell MM, Johnson J, Dyment S, Prochaska JO, Prochaska JM, Bourne L. Transtheoretical Model intervention for adherence to lipid-lowering drugs. Dis Manag. 2006;9(2):102–114. doi: 10.1089/dis.2006.9.102. [DOI] [PubMed] [Google Scholar]
- Johnson SS, Paiva A, Johnson J, Cummins C, Dyment S, Prochaska JO, Prochaska JM. Final Progress Report: Individualized Expert Systems for Weight Management, Grant Number R44 HL070549. West Kingston, RI: Pro-Change Behavior Systems, Inc; 2007. [Google Scholar]
- Jones H, Edwards L, Vallis TM, Ruggiero L, Rossi SR, Rossi JS, Greene G, Prochaska JO, Zinman B. Changes in diabetes self-care behaviors make a difference in glycemic control: The diabetes stages of change (DISC) study. Diabetes Care. 2003;26(3):732–737. doi: 10.2337/diacare.26.3.732. [DOI] [PubMed] [Google Scholar]
- LaForge RG, Greene GW, Prochaska JO. Psychosocial factors influencing low fruit and vegetable consumption. J Behav Med. 1994;17(4):361–374. doi: 10.1007/BF01858008. [DOI] [PubMed] [Google Scholar]
- Look AHEAD Research Group. The look AHEAD study: A description of the lifestyle intervention and the evidence supporting it. Obesity. 2007a;14(5):737–752. doi: 10.1038/oby.2006.84. [DOI] [PMC free article] [PubMed] [Google Scholar]
- Look AHEAD Research Group. Reduction in weight and cardiovascular disease risk factors in individuals with type 2 diabetes. Diabetes Care. 2007b;30(6):1374–1383. doi: 10.2337/dc07-0048. [DOI] [PMC free article] [PubMed] [Google Scholar]
- Perri MG. The maintenance of treatment effects in the long term management of obesity. Clin Psychol Sci Prac. 1998;5:526–543. [Google Scholar]
- Prochaska JJ, Prochaska JM. Multiple risk behavior change: What most individuals need. Handbook of Health Behavior Change. 3. Springer Publishing; in press. [Google Scholar]
- Prochaska JO, Redding CA, Evers K. The Transtheoretical Model and Stages of Change. In: Glanz K, Rimer BK, Lewis FM, editors. Health Behavior and Health Education: Theory, Research, and Practice. 3. San Francisco, CA: Jossey-Bass, Inc; 2002. [Google Scholar]
- Prochaska JJ, Velicer WF, Prochaska JO, Delucchi K, Hall SM. Comparing intervention outcomes in smokers treated for single versus multiple behavioral risks. Health Psychol. 2006;25:380–388. doi: 10.1037/0278-6133.25.3.380. [DOI] [PubMed] [Google Scholar]
- Prochaska JO, Velicer WF, Redding CA, Rossi JS, Goldstein M, DePue J, Greene GW, Rossi SR, Sun X, Fava JL, Laforge R, Rakowski W, Plummer BA. Stage-based expert systems to guide a population of primary care patients to quit smoking, eat healthier, prevent skin cancer and receive regular mammograms. Prev Med. 2005;41:406–416. doi: 10.1016/j.ypmed.2004.09.050. [DOI] [PubMed] [Google Scholar]
- Prochaska JO, Velicer WF, Rossi JS, Redding CA, Greene G, Rossi SR, Sun X, Fava JL, LaForge R, Plummer B. Multiple risk expert system interventions: Impact of simultaneous stage-matched expert system interventions for smoking, high-fat diet, and sun exposure in a population of parents. Health Psychol. 2004;23(5):503–516. doi: 10.1037/0278-6133.23.5.503. [DOI] [PubMed] [Google Scholar]
- Riebe D, Blissmer B, Greene G, Caldwell M, Ruggiero L, Stillwell KM, Nigg CR. Long-term maintenance of exercise and healthy eating behaviors in overweight adults. Prev Med. 2005;40:769–778. doi: 10.1016/j.ypmed.2004.09.023. [DOI] [PubMed] [Google Scholar]
- Riebe D, Greene G, Ruggiero L, Stillwell KM, Blissmer B, Nigg CR, Caldwell M. Evaluation of a healthy-lifestyle approach to weight management. Prev Med. 2003;36:45–54. doi: 10.1006/pmed.2002.1126. [DOI] [PubMed] [Google Scholar]
- Rubin DB. Multiple imputation for nonresponse in surveys. New York: John Wiley & Sons, Inc; 1987. [Google Scholar]
- Sarkin JA, Johnson SS, Prochaska JO, Prochaska JM. Applying the Transtheoretical Model to regular moderate exercise in an overweight population: Validation of a stages of change measure. Prev Med. 2001;33:462–469. doi: 10.1006/pmed.2001.0916. [DOI] [PubMed] [Google Scholar]
- Schafer JL, Graham JW. Missing data: Our view of the state of the art. Psychological Methods. 2002;7(2):147–177. [PubMed] [Google Scholar]
- Sherwood NE, Morton N, Jeffrey RW, French SA, Neumark-Sztainer D, Falkner NH. Consumer preferences in format and type of community-based weight control programs. Am J Health Promot. 1998;13:12–18. doi: 10.4278/0890-1171-13.1.12. [DOI] [PubMed] [Google Scholar]
- Tate DF, Wing RR, Winett RA. Using Internet technology to deliver a behavioral weight loss program. JAMA. 2001;285(9):1172–1177. doi: 10.1001/jama.285.9.1172. [DOI] [PubMed] [Google Scholar]
- Tate DF, Jackvony EH, Wing RR. Effects of an Internet behavioral counseling on weight loss in adults at risk for type 2 diabetes. JAMA. 2003;289(14):1833–1836. doi: 10.1001/jama.289.14.1833. [DOI] [PubMed] [Google Scholar]
- United States Department of Health and Human Services. Dietary Guidelines for Americans. 2005 Retrieved March 22, 2007 from www.healthierus.gov/dietaryguidelines.
- Van Buuren S, Oudshoorn CGM. Multivariate imputation by chained equations, V1.1.0 for R. http://web.inter.nl.net/users/S.van.Buuren/mi/hmtl/mice.htm. Retrieved February 25, 2004. Ref Type: Electronic Citation.
- Van Gaal LF, Mertens IL, Ballaux D. What is the relationship between risk factor reduction and degree of weight loss? Eur Heart J Suppl. 2005;7:L21–L26. [Google Scholar]
- Velicer WF, Prochaska JO. An expert system intervention for smoking cessation. Patient Educ Couns. 1999;36:119–129. doi: 10.1016/s0738-3991(98)00129-3. [DOI] [PubMed] [Google Scholar]
- Ware JH. Interpreting incomplete data in studies of diet and weight loss. N Engl J Med. 2003;348(21):2136–2137. doi: 10.1056/NEJMe030054. [DOI] [PubMed] [Google Scholar]
- Wing RR, Koeske R, Epstein LH, Norwalk MP, Gooding W, Becker D. Long-term effects of modest weight loss in type 2 diabetic patients. Arch Intern Med. 1987;147(10):1749–53. [PubMed] [Google Scholar]
- Zeger SL, Liang KL. Longitudinal data analysis for discrete and continuous outcomes. Biometrics. 1986;42:121–130. [PubMed] [Google Scholar]