Abstract
The effect of doxorubicin on oxidation of 2,2′-azino-bis(3-ethylbenzothiazoline-6-sulfonate) (ABTS) by lactoperoxidase and hydrogen peroxide has been investigated. It was found that: (1) oxidation of ABTS to its radical cation (ABTS•+) is inhibited by doxorubicin as evidenced by its induction of a lag period, duration of which depends on doxorubicin concentration; (2) the inhibition is due to doxorubicin hydroquinone reducing the ABTS•+ radical (stoichiometry 1: 1.8); (3) concomitant with the ABTS•+ reduction is oxidation of doxorubicin; only when the doxorubicin concentration decreases to a near zero level, net oxidation of ABTS could be detected; (4) oxidation of doxorubicin leads to its degradation to 3-methoxysalicylic acid and 3-methoxyphthalic acid; (5) the efficacy of doxorubicin to quench ABTS•+ is similar to the efficacy of p-hydroquinone, glutathione and Trolox C. These observations support the assertion that under certain conditions doxorubicin can function as an antioxidant. They also suggest that interaction of doxorubicin with oxidants may lead to its oxidative degradation.
Keywords: ABTS, anthracyclines, doxorubicin, EPR, glutathione, hydroquinone, inactivation, lactoperoxidase, oxidation, Trolox C
The biological action of the anticancer anthracyclines doxorubicin (DOX, Adriamycin) and daunorubicin (DNR) is frequently linked to their ability to induce oxidative stress through generation of free radicals and ROS. This property results from the presence in the drugs’ structures of a quinone moiety (Fig. 1, ring C), which may undergo metabolic reduction and, via aerobic redox cycling, generate superoxide and, subsequently, other more reactive forms of oxygen [1–3]. It is believed that ROS may play a role in the anthracycline-induced cardiotoxicity [4].
Figure 1.
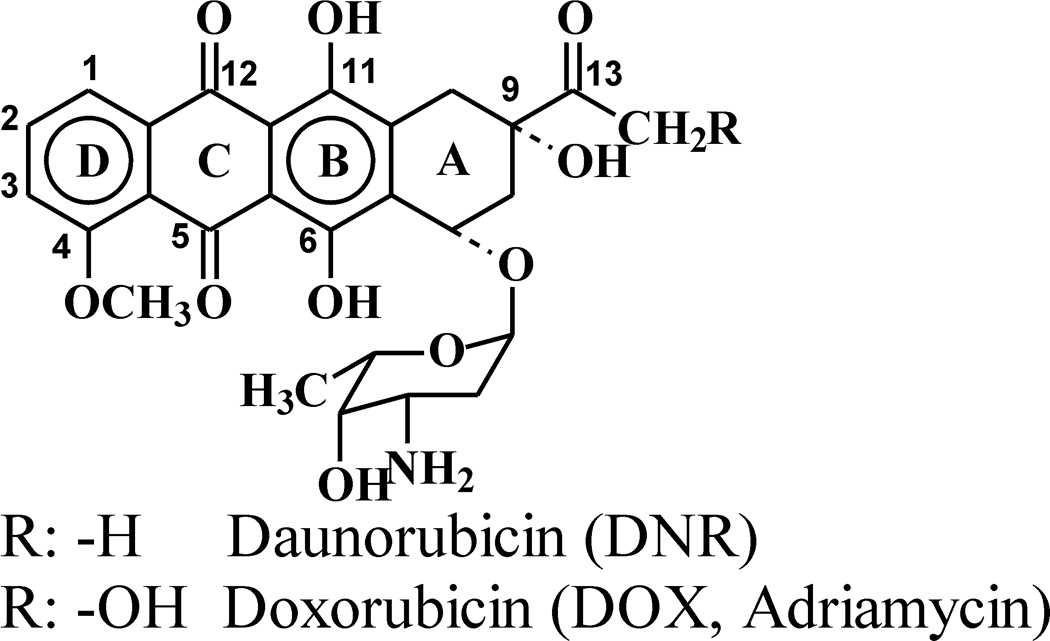
Structures of DOX and DNR.
Several recent studies demonstrated that anthracyclines also possess reducing capabilities since they react with oxidants. This is not surprising, as the drugs contain in their chromophores an electron-donating hydroquinone moiety (Fig. 1, ring B). For example, DOX and DNR have been shown to undergo oxidation by microperoxidase/H2O2 [5], the oxo-ferryl form of myoglobin [6,7] and hemoglobin [8]. In the presence of nitrite, acetaminophen or salicylic acid lactoperoxidase (LPO) and myeloperoxidase (MPO) also oxidize the drugs [9–11]. It has also been demonstrated that DOX inhibits cardiac lipid conjugated dienes and lipid hydroperoxide formation in blood plasma from the coronary sinus and femoral artery of cancer patients [12]. DOX also inhibits lipid peroxidation in model systems containing myoglobin and H2O2 [6] and protects cardiomyocytes against iron-mediated toxicity [13]. These observations suggest that anthracyclines can function as antioxidants.
The above reports prompted us to explore further the putative antioxidant properties of anthracyclines. In the present study we investigated the effect of DOX on oxidation of 2,2′-azino-bis(3-ethylbenzothiazoline-6-sulfonate) (ABTS) by LPO and hydrogen peroxide (H2O2). ABTS is an excellent substrate for peroxidases [14–16] and is frequently used to study antioxidant properties of natural compounds [17–19] and electron transfer reactions involving free radicals [20]. Oxidation of ABTS affords a persistent radical cation, ABTS•+, which intensely absorbs light in the visible region of the spectrum (λmax 415, 730 nm). Antioxidant properties of a tested compound are usually assayed by measuring its inhibitory action on the rate of the appearance of ABTS•+, and/or induction and duration of lag period preceding the appearance of the radical. Alternatively, the testing compound can be added to the preformed ABTS•+ radical. This causes reduction of the radical, which is manifested as a decrease of the absorbance at specific wavelength. The magnitude of this decrease is correlated with the amount of the antioxidant used. Here we used both these approaches to investigate the antioxidant properties of DOX and compared them with those of p-hydroquinone, glutathione and Trolox C.
Materials and Methods
Chemicals
ABTS (diammonium salt) was from Aldrich (Milwaukee, WI). LPO, H2O2 (30%), p-hydroquinone (p-QH2), Trolox C, glutathione (GSH, reduced form) and 3-methoxysalicylic acid (3MeSA) were purchased from Sigma (St. Louis, MO). Alpha-D(+)-Glucose (Gl) was from ACROS Organics (New Jersey, USA) and glucose oxidase (GO) (Type X, 100 units/mg) from MP Biochemicals, Inc. (Solon, OH). 3-Methoxyphthalic acid (3MePA) was a gift from Mr. Wagner BA (University of Iowa). DOX (hydrochloride form), solution for injection (2 mg/mL) was from Ben Venue Laboratories, Inc. (Bedford, OH). The concentrations of stock solutions of the reactants were determined spectrophotometrically using ε240 = 39.4 M−1 cm−1 for H2O2 [21], ε412 = 1.12 × 10⁵ M−1 cm−1 for LPO [22], and ε480 = 1.15 × 10⁴ M−1 cm−1 for DOX [23]. The concentration of ABTS was determined using ε340 = 3.6 × 10⁴ M−1 cm−1 and that of ABTS•+ using ε415 = 3.6 × 10⁴ M−1 cm−1 [24], or ε730 = 1.5 × 10⁴ M−1 cm−1 [17].
Spectrophotometric measurements
Absorption spectra were measured using an Agilent diode array spectrophotometer model 8453 (Agilent Technologies, Inc., Chesterfield, MO). Measurements were performed in phosphate buffer pH 7.0 (50 mM) at room temperature. Typically the reaction was initiated by addition of a small aliquot of H2O2 stock solution (2.5 µL) as the last component to a sample consisting of ABTS, DOX and LPO in buffer. When glucose/glucose oxidase (Gl/GO) was used to generate H2O2, GO (1 µL) was added last to a final concentration of 0.05 units/mL. Using ABTS and LPO, the rate of H2O2 generation by Gl/GO was determined to by 9 µM H2O2/min. The formation or the decay of the ABTS•+ radical was measured at 415 and 730 nm during 10 or 20 min reaction. Concomitant changes in the concentration of DOX were determined measuring absorbance at 480 nm during the same time period. Data were collected in 5 s intervals during continuous stirring of the sample in a spectrophotometric cuvette (1 cm light path). All experiments were repeated at least twice.
Preparation of ABTS•+ radical
The ABTS•+ radical was prepared by reacting ABTS (100 µM) with H2O2 (14 µM) in the presence of LPO (26 nM). This generated ~25 µM ABTS•+. The progress of the ABTS•+ formation was monitored at 415 and 730 nm collecting data every 5 s. When the A415 stabilized, an aliquot of DOX (Trolox C, p-QH2 or GSH) stock solution was added and changes in A415 were continuously recorded. The amount of ABTS•+ lost was determined from ΔA415 and converted to µM using ε415 = 3.6 × 10⁴ M−1 cm−1. Calculations based on ΔA730 and using ε730 (ABTS•+) = 1.5 × 10⁴ M−1 cm−1 gave similar results. When DOX was used, concomitant changes in absorbance at 480 nm were also measured for the same period of time to assess effects of the reaction on the drug. The rate of ABTS•+ reduction was calculated based on ΔA415 during the initial fast phase of the reaction (first 5 s after the addition of a reducing agent DOX, p-QH2, Trolox C or GSH).
EPR measurements
EPR spectra were recorded using a Bruker EMX EPR spectrometer (Bruker BioSpin Co., Billerica, MA), operating in X band and equipped with a high sensitivity resonator ER 4119HS. Samples (total volume 250 µL) were prepared in pH 7.0 buffer and the reaction was initiated by addition of H2O2 as the last component. In cases, in which H2O2 was generated by Gl/GO, GO was added last. The sample was transferred to a flat aqueous EPR cell and recording was started 1 min after initiation of the reaction. Spectra of ABTS•+ were recorded using microwave power 5.17 mW, modulation amplitude 0.2 gauss, receiver gain 2 × 10⁵, conversion time 40.96 ms, time constant 81.92 ms, and scan rate 80 gauss/41.94 s. The effect of DOX was assessed by recording EPR spectra of ABTS•+ in 1 min intervals from samples containing various amounts of the drug. The EPR spectrum of a DOX-derived radical was recorded using microwave power 40 mW, modulation amplitude 2G. Other parameters remained unchanged.
Mass spectrometry
Samples for MS analysis were prepared by oxidation of DOX by LPO/H2O2 in the presence of ABTS in phosphate buffer, pH 7.0. When oxidation of DOX was nearly completed (A480 reached minimum), samples were acidified to pH ~1 with 12 M HCl and extracted with ethyl acetate. The organic phase was evaporated under a stream of nitrogen and the remaining dry materials were dissolved in methanol or in water. The samples were then diluted at a ratio of 1 to 5 in 50/50 (vol/vol) MeOH/H2O, or 50/50 (vol/vol) MeOH/CHCl3 for those that were not soluble in MeOH. The sample solutions were then directly infused into the mass spectrometer using a syringe pump at a flow rate of 5 microliter/minute. The instrument used was Micromass (Waters) Q-TOF 2 mass spectrometer, which was tuned and calibrated to acquire spectra in negative ion mode. The acquired data were processed using MassLynx 4.0 software. Identification of DOX degradation products was accomplished by comparing with fragmentation pattern of authentic 3MeSA and 3MePA samples.
Results
Oxidation of ABTS by LPO/H2O2: Effect of DOX
The incubation of ABTS with LPO in the presence of H2O2 (or Gl and GO) generates the ABTS•+ radical. Fig. 2A shows the time course of the formation of this radical, monitored at 730 nm (trace a). The species appeared immediately after the start of the reaction and its concentration increased until it reached a plateau. When the same reaction was carried out in the presence of DOX, the ABTS•+ radical appeared with a lag time, duration of which depended on [DOX]. Corresponding kinetic runs recorded at 730 nm are shown in Fig. 2A. The kinetic run “a” was recorded in the absence of DOX and traces b – e were obtained in the presence of 2.3, 4.4, 8.7 and 16.3 µM DOX. This induction by DOX of the lag time is suggestive of the drug’s antioxidant action. Similar inhibitory effects on the ABTS•+ formation have been reported for other good antioxidants [18,25].
Figure 2.
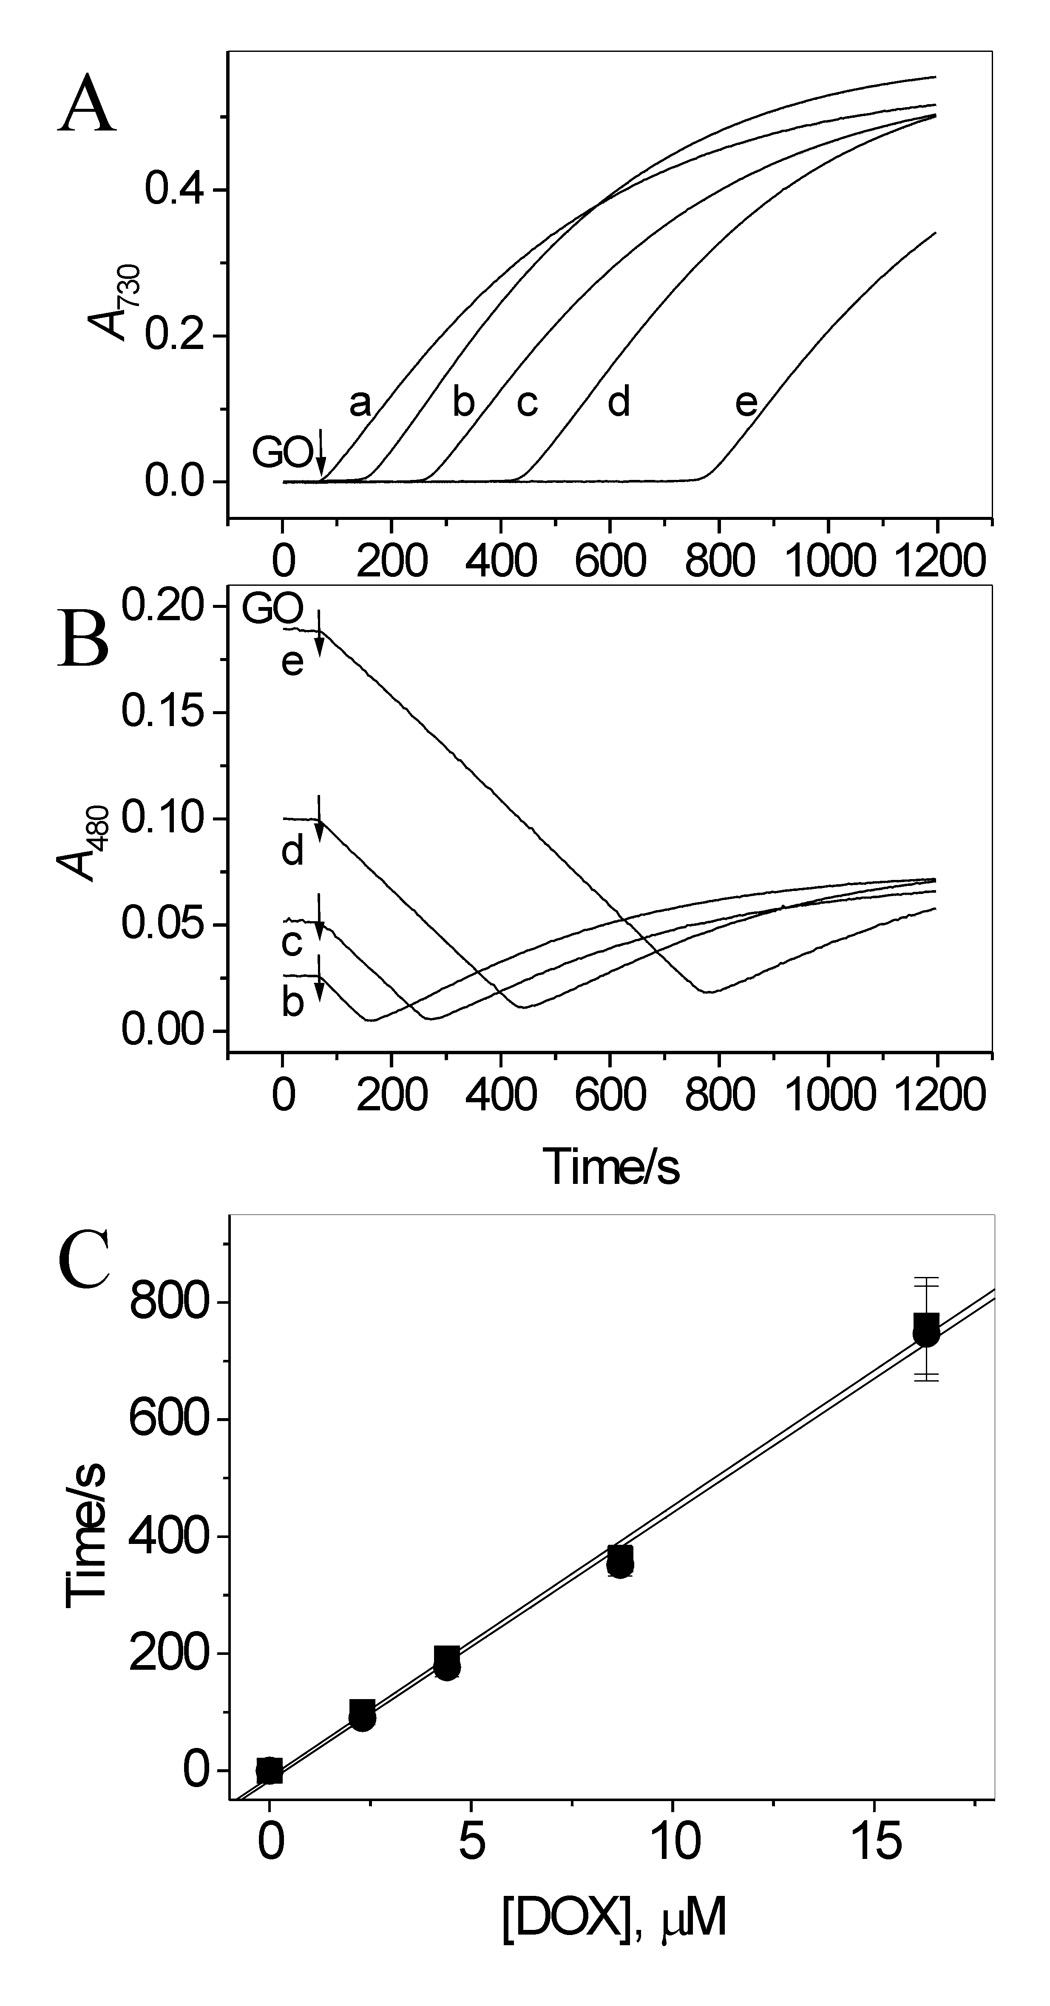
Effect of DOX on oxidation of ABTS by LPO and H2O2 (generated by Gl/GO) in aerated pH 7.0 buffer. (A) Time course of accumulation of ABTS•+ measured at 730 nm in the absence (trace a) and presence of 2.3, 4.4, 8.7 and 16.3 µM DOX, traces b – e, respectively. (B) Simultaneously measured changes in absorbance at 480 nm indicate oxidation of DOX. Note that oxidation of DOX starts immediately upon addition of GO at all [DOX] used. The differences in initial absorbance at 480 nm (lines b – e) are due to different contents of DOX in those samples. The increase in absorbance at 480 nm after reaching a minimum, is due to accumulation of the ABTS•+ radical, which has a residual absorption at this wavelength. (C) Plots of lag time (●) preceding the appearance of ABTS•+ and Δt, the time at which A480 reached minimum (■), versus [DOX], based on data in panels A and B. [ABTS] = 50 µM, [Gl] = 1 mM, [GO] = 0.05 unit/mL, [LPO] = 17 nM. N = 3.
Measurements of absorbance at 480 nm showed that, in contrast to ABTS, oxidation of DOX started immediately after start of the reaction (addition of GO) at all [DOX] employed (Fig. 2B). Comparison of the time courses of A480 and A730 indicates that the net formation of ABTS•+ can be detected only when the concentration of DOX decreases to a near zero level. Fig. 2C shows that duration of the lag time preceding the appearance of ABTS•+ is proportional to [DOX]. Similar, Δt, which is the time needed for complete oxidation of DOX, measured as the time at which A480 reached minimum, is proportional to [DOX] (Fig. 2C). This is understandable given that oxidation of DOX proceeds at a constant speed, since then a n-fold increase in the DOX concentration should result in a similar n-fold increase in the time needed to oxidize the drug to completion. In this respect we note, that although oxidation initiated by bolus additions of H2O2 produced responses similar to those shown in Fig. 2A and 2B, the relationship between the lag time (or Δt) and [DOX] determined under these conditions was non-linear (not shown).
Interaction of ABTS•+ with DOX
Because DOX does not react with the active forms of LPO, one possible mechanism of the inhibition by DOX of the ABTS•+ formation is reduction of the radical by the drug. This possibility was tested by adding DOX to a sample containing preformed ABTS•+, and by measuring changes in the ABTS•+ radical level. The ABTS•+ radical was generated by adding H2O2 (14 µM) to ABTS (100 µM) and LPO (26 nM) in pH 7.0 buffer, and the reaction was monitored at 415 nm. When the A415 stabilized, indicating that most of H2O2 was consumed, an aliquot of DOX stock solution was added. This caused an immediate and rapid decrease in A415, lasting approximately 5 s, and was followed by a markedly slower process (Fig. 3A). The magnitude of the decrease in A415 during the fast phase was linearly dependent on the dose of DOX used (Fig. 3A, inset). When DOX was omitted, only a negligible loss of ABTS•+ was observed during the same observation period (Fig. 3A, trace a). The biphasic decrease in A415 suggests that the radicals were decaying in two processes. The initial rapid (first 5 s) loss of the radical is probably due to ABTS•+ reacting with readily accessible reducing sites in DOX. This can be the hydroquinone moiety in DOX molecules. This interpretation is consistent with stoichiometry of the reaction. The ratio of ABTS•+ lost to DOX consumed, Δ[ABTS•+]/Δ[DOX], was found to be 1.8 ± 0.1 for the fast process (Fig. 3B, column A). This is close to the anticipated value of 2 for that ratio, based on the number of reducing sites in DOX molecules (two phenolic – OH groups in ring B, Fig. 1). This suggests that both the hydroquinone DOX(QH2) and semiquinone DOX(QH•) forms of the drug react with ABTS•+ as described by equation 1 and equation 2. The participation of DOX(QH•) in the process results from the fact that
| (1) |
| (2) |
ABTS•+, a one-electron oxidant, reacting with a two-electron donor, DOX(QH2), must afford a radical from the donor molecule (Eq 1). (It is assumed that at pH 7.0 the species is present predominantly in its neutral form, DOX (QH•)). The subsequent slow process may be due to reaction of ABTS•+ with DOX-derived products, as it is known that oxidation triggers degradation of anthracyclines to low molecular weight compounds, including 3-methoxysalicylic acid (3MeSA) and 3-methoxyphthalic acid (3MePA) [7,26,27]. The total loss of ABTS•+ during the entire observation period of 6 min (that is when A415 stabilized) corresponds to 3.7 ± 0.4 per 1 molecule of DOX consumed, and this relationship holds for all [DOX] used (Fig. 3B, columns B). We found that 3MeSA, a phenolic compound, easily reduces ABTS•+ (data not shown), supporting the suggestion that in addition to the DOX hydroquinone moiety, a DOX-derived product(s) may also reduce the ABTS•+ radical. Similar observations have been reported for other antioxidants of a polyphenolic character [19,28].
Figure 3.
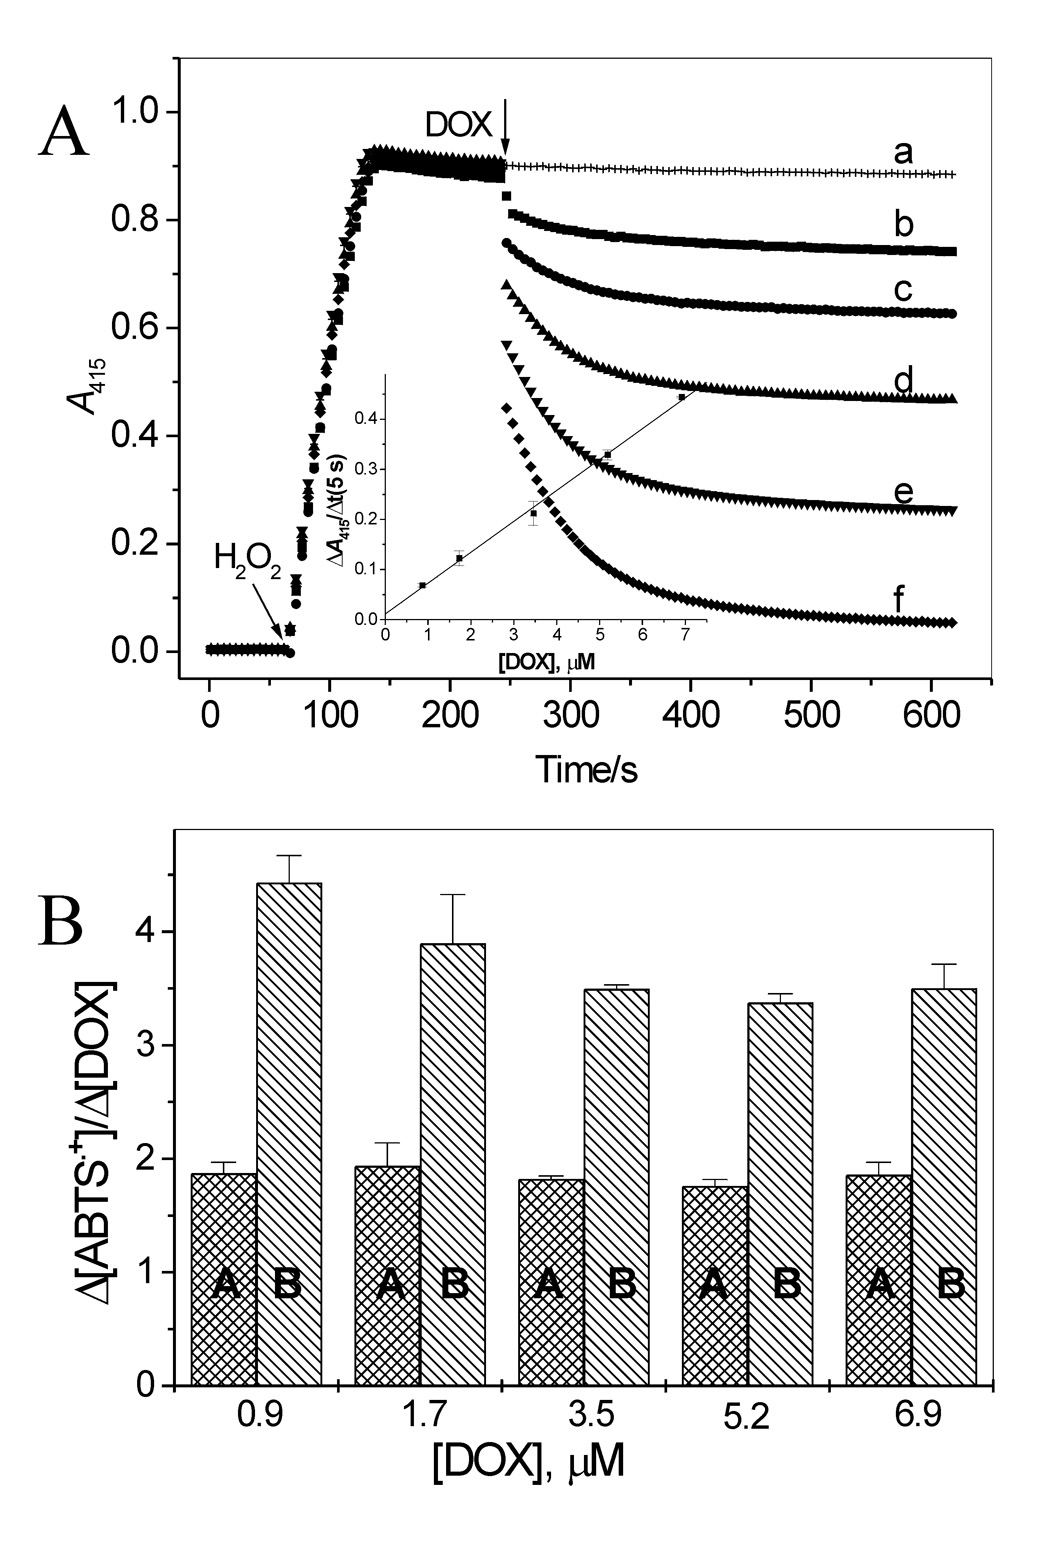
Interaction of ABTS•+ with DOX. (A) Time course of ABTS reduction by 0.9, 1.7, 3.5, 5.2, and 6.9 µM DOX. ABTS•+ was generated by incubation of ABTS (100 µM) with LPO (26 nM) and H2O2 (14 µM) and when the absorbance at 415 nm stabilized, an aliquot of DOX stock solution was added. Inset: Loss of ABTS•+ measured as ΔA415 during first 5 s of the reaction versus [DOX]. (B) Stoichiometry of the reaction of ABTS•+ with DOX during the fast (first 5 s) and slow phases of the reaction (columns A and B, respectively) versus [DOX].
It was of interest to compare the reducing efficacy of DOX with that of typical antioxidants. For that purpose experiments, similar to those described above for DOX were carried out using p-QH2, Trolox C and GSH. All these compounds reduced ABTS•+ in one fast process (Fig. 4A). p-QH2 and Trolox C reacted with the radical with similar rates, which were close to the rate of the reaction of DOX with ABTS•+, whereas the reaction with GSH was slower (Table 1). Stoichiometric factors for the reaction between ABTS•+ and the reductors (p-QH2, Trolox C and GSH) are between 1.81 and 2.1 so they are close to that determined for DOX during the fast process (Table 1).
Figure 4.
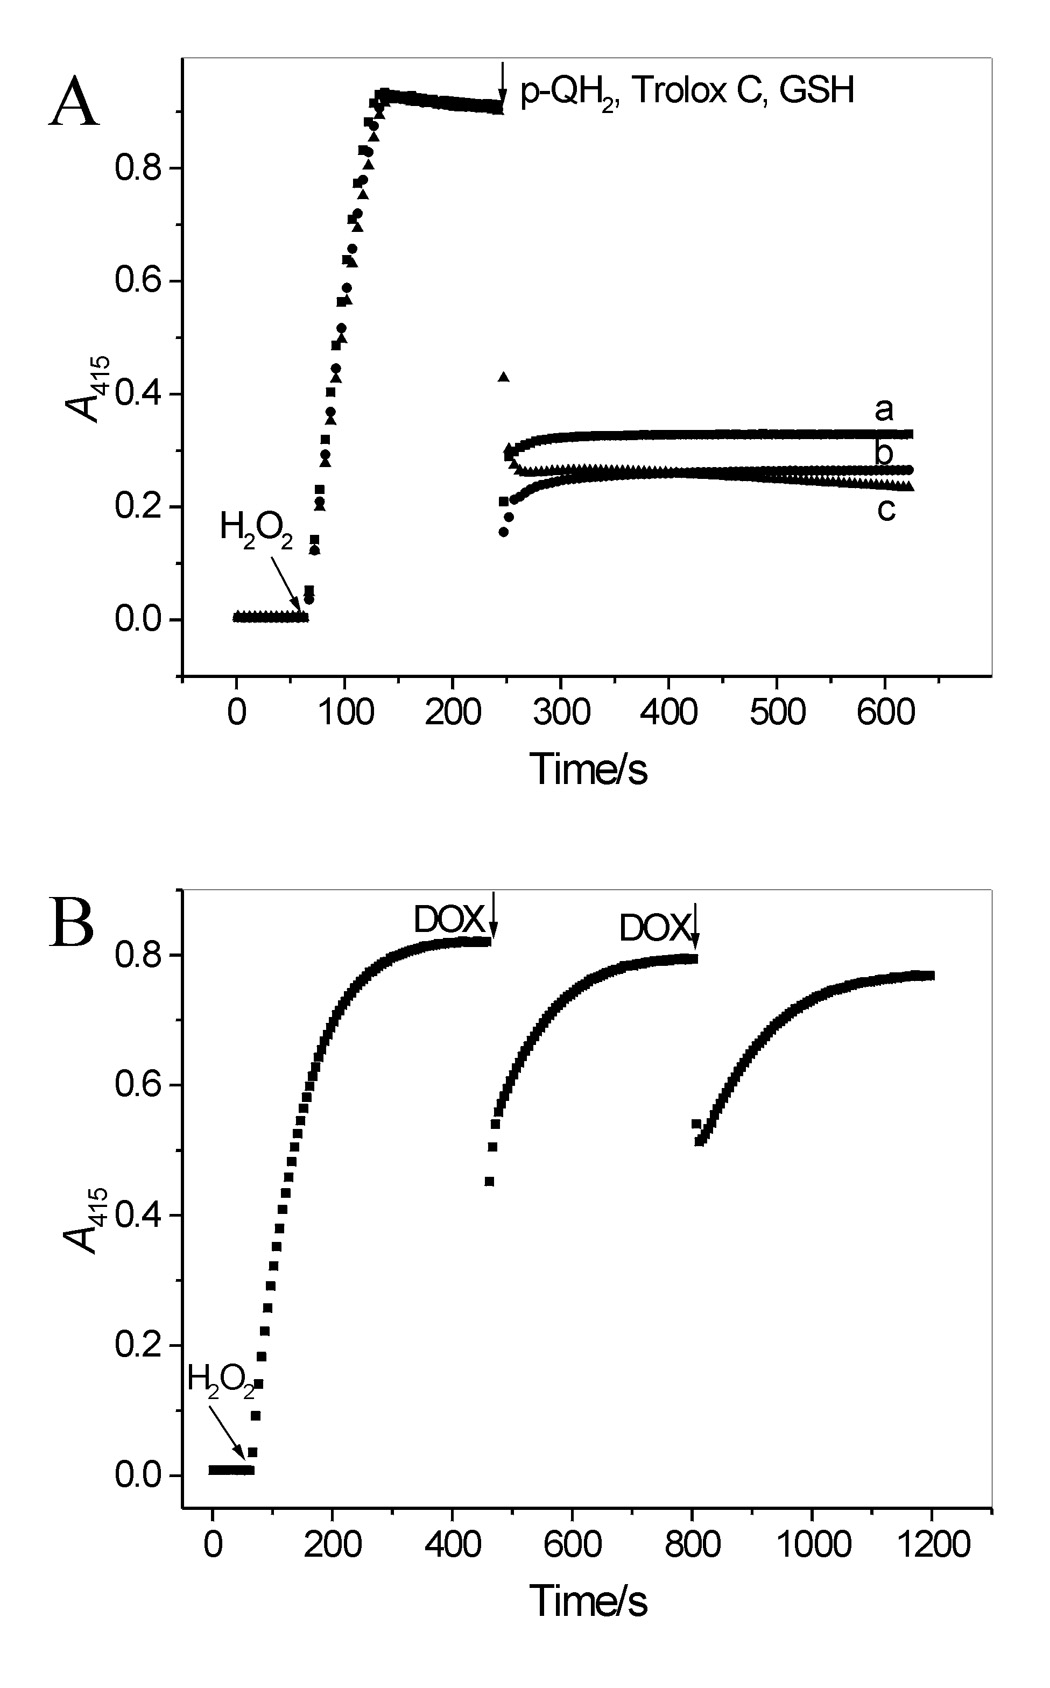
(A) Interaction of ABTS•+ with p-QH2, Trolox C and GSH. ABTS•+ was generated as described in legend to Figure 4A. When the A415 stabilized, p-QH2 was added (9.9 µM) (trace a). Similar experiments performed with Trolox C or GSH (9.9 µM each) produced traces b and c, respectively. (B) DOX reacts with ABTS•+ via electron transfer. ABTS•+ was generated by oxidizing ABTS (25 µM) by LPO and an excess of H2O2 (83 µM). When A415 stabilized, an aliquot of DOX was added (3.5 µM, two doses). After each dose, the A415 recovered, reaching ~97% of its initial level, suggesting that the transient loss of ABTS•+ was mostly due to its reduction via electron transfer from DOX(QH2). The recovered ABTS was immediately oxidized by LPO and the remaining H2O2.
Table 1.
Efficacy of the ABTS•+ reduction, loss of ABTS•+ during the fast phase of the reaction and the initial rate of the reduction of ABTS•+ by DOX, p-QH2, Trolox C and GSH in aerated buffer pH 7.0.
| Reductor | Δ[ABTS•+]/Δ[reductor] | Δ[ABTS•+]/5 s (% of initial level)d | Initial rate, µM/mine |
|---|---|---|---|
| 1.8 ± 0.1a | 48.4 ± 1.3 | 22.0 ± 2.0 | |
| DOX | 3.7 ± 0.4b | ||
| p-QH2 | 1.9 ± 0.1a | 75.6 ± 1.5 | 23.4 ± 0.3 |
| Trolox C | 2.1 ± 0.1a | 84.6 ± 1.8 | 25.6 ± 0.3 |
| GSH | 1.8 ± 0.1c | 50.8 ± 1.7 | 15.7 ± 0.2 |
For the fast process (first 5 s of the reaction).
After 6 min.
After 1 min.
Amount of ABTS•+ lost upon the addition of 9.9 µM p-QH2, Trolox C, GSH, or 6.9 µM DOX measured during the first 5 s after the reductor addition.
Initial rates were determined based on ΔA415 over the first 5 s of the reaction and are expressed per 1 µM of a reductor.
It has been reported that interaction of ABTS•+ with polyphenols leads to their oxidation and formation of covalent adducts with ABTS degradation products [28]. To verify whether decay of ABTS•+ in our system is due to reduction of the radical by DOX, and not due to other reactions such as ABTS degradation or binding to DOX, the radical was first generated using excess of H2O2 over ABTS. When the A415 stabilized, indicating that all ABTS was oxidized, an aliquot of DOX was added. This caused transient decrease in A415 after which A415 increased to the near initial level (96.5% recovery; n = 4) (Fig. 4B). Repetitive additions of DOX induced similar responses. This almost complete recovery strongly suggests that interaction of ABTS•+ with DOX proceeds almost exclusively by electron transfer from the electron donating forms of the drug, DOX(QH2) and DOX(QH•), to ABTS•+, as described by equation 1 and equation 2.
Oxidation of DOX by LPO/H2O2 – effect of ABTS
Because reduction of ABTS•+ is coupled with oxidation of DOX, it was of interest to investigate further the effect of ABTS on the transformation of the drug. Fig. 5 shows typical spectra observed during oxidation of DOX by LPO/H2O2/ABTS. These spectral changes are similar to those observed during exposure of anthracyclines to enzymatic or photochemical oxidizing systems [5,7,9–11,26]. The rate of DOX oxidation increased as the concentration of ABTS increased (Fig. 5, inset A), and the initial rate of the reaction, Vi, was linearly dependent on [ABTS] (inset B). When ABTS was omitted, no changes in A480 were observed (Fig.5, inset A, trace a), confirming that DOX is resistant to oxidation by LPO/H2O2 alone. Thus, ABTS functions as a catalyst in oxidation of the drug by the peroxidase.
Figure 5.
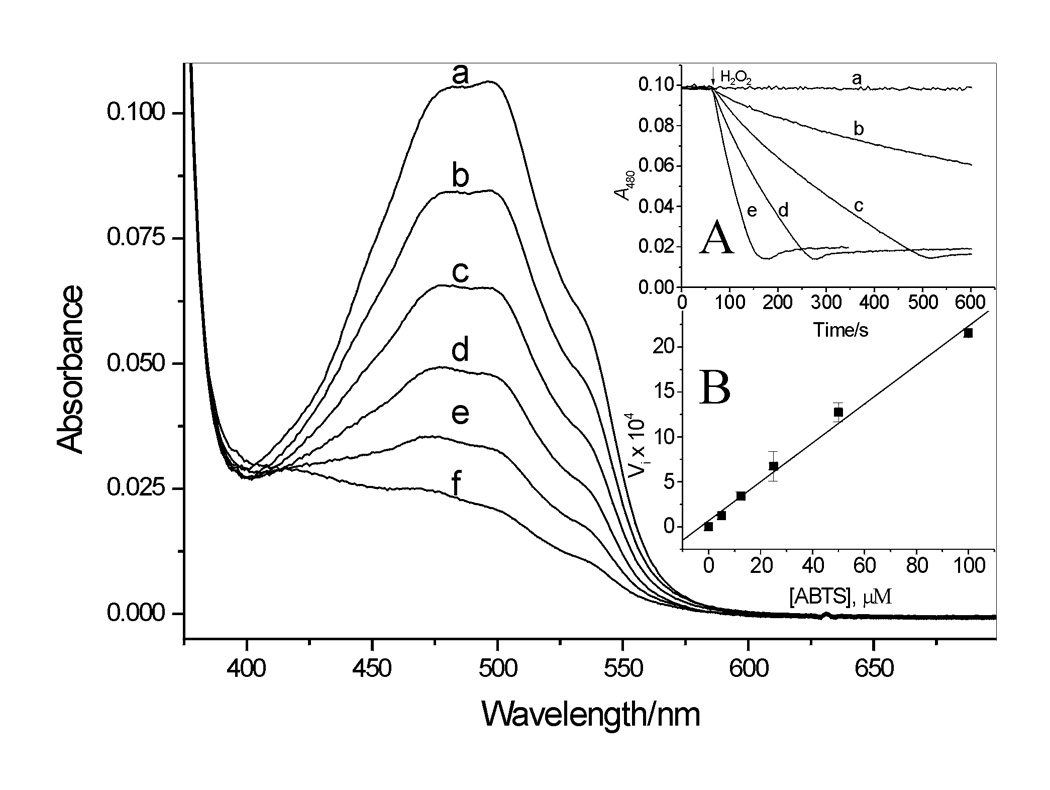
Absorption spectra recorded during oxidation of DOX by LPO/H2O2 in pH 7.0 buffer in the presence of ABTS. Spectra a – f were recorded every 30 s after start of the reaction (H2O2 addition) in the presence of 25 µM ABTS. Inset A. Time course of DOX oxidation measured at 480 nm in the presence of 0, 5.0, 12.5, 25.0, and 50.0 µM ABTS, traces a – e, respectively. Inset B: Initial rate of DOX oxidation (Vi = dA480/dt) versus [ABTS]. [DOX] = 9.1 µM, [LPO] = 25 nM, [H2O2] = 14 µM.
EPR study
ABTS•+ is a persistent radical which can be readily detected and identified by its characteristic EPR spectrum [29,30]. Fig. 6A shows an EPR spectrum of the ABTS•+ radical generated by oxidation of ABTS (193 µM) by LPO (26 nM) and H2O2 (produced by Gl/GO) at pH 7.0. To verify the effect of DOX on ABTS oxidation, we followed the formation of ABTS•+ in the absence and presence of DOX. Fig. 6B shows the time course of the EPR signal amplitude, Amax, of the ABTS•+ radical recorded with DOX omitted (trace a) and in the presence of 26 and 67 µM DOX (traces b and c, respectively). It is evident that DOX markedly and in a concentration-dependent manner inhibits formation of the radical. These results are qualitatively consistent with the spectrophotometrically determined effect of DOX on the ABTS•+ radical formation (Fig. 2A).
Figure 6.
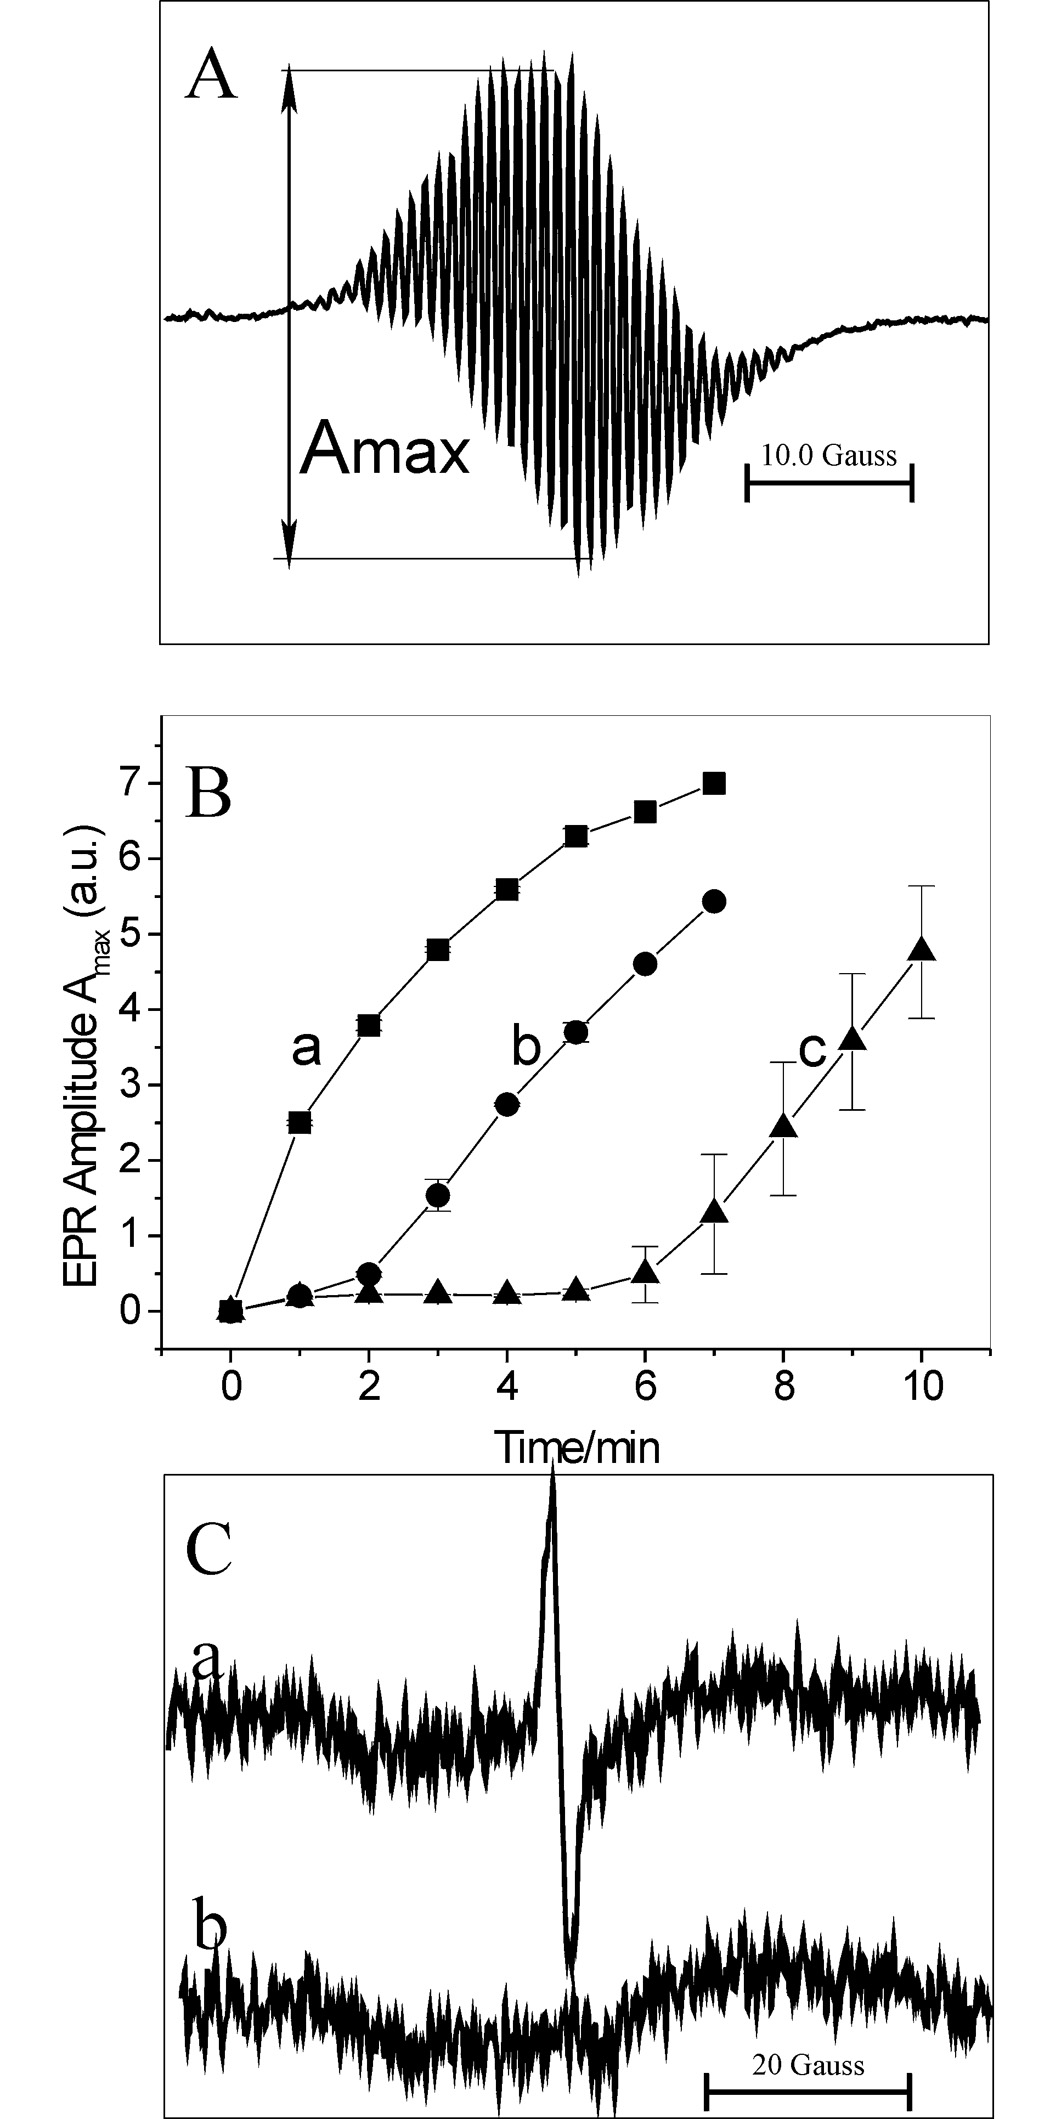
(A) EPR spectrum of ABTS•+ radical. The radical was generated by oxidation of ABTS (193 µM) by LPO (26 nM) in the presence of Gl (1 mM) and GO (0.4 unit/mL) at pH 7.0. (B) EPR amplitude of ABTS•+, Amax, versus time of the reaction carried out in the absence “a” and presence of DOX, 26 and 67 µM for “b” and “c”, respectively. Other conditions were the same as in (A). Amax has been determined as shown in panel A. (C) Trace “a” - EPR spectrum of the semiquinone radical (DOX-QH•). DOX (277 µM) was treated with LPO (67 nM), ABTS (40 µM), Gl (1 mM) and GO (0.4 unit/mL) at pH 7.0. Trace “b” – same as “a” but with GO omitted. Spectra “a” and “b” are average of 5 scans and represent typical results.
Because interaction of DOX with ABTS•+ should generate the respective semiquinone radical DOX(QH•) (Eq 1), experiments were performed to confirm formation of this species. The reaction of DOX (277 µM) with LPO (67 nM), ABTS (40 µM) and H2O2 (generated by Gl/GO), produced an EPR spectrum shown in Fig. 6C (spectrum a) attributed to DOX(QH•). The signal peak-to-peak line width of 1.83 gauss and g = 2.0058 are close to those reported previously for that radical [5,9–11]. When the concentration of ABTS was increased 2- or 3-fold, the signal from DOX(QH•) was absent and the signal from ABTS•+ was observed instead. This is probably because at higher concentrations of ABTS, the DOX(QH•) radical is rapidly removed by ABTS•+ (Eq 2), even though under these conditions the rate of the DOX(QH•) generation is also increased. The net result is a rapid consumption of DOX (Fig. 5). Therefore, for a successful detection of DOX(QH•) it is important to keep the concentration of ABTS at relatively low levels (≪ [DOX]). Another route for decay of DOX(QH•) may be disproportionation (Eq 3). This process affords the drug in its original and completely oxidized (di-quinone) forms, (Q-QH2) and (Q-Q), respectively.
| (3) |
No signal from DOX(QH•) was detected when GO was omitted from the system (Fig. 6C, trace b), since then H2O2 was not generated and, consequently, the peroxidase (LPO) could not function.
Identification of DOX degradation products - MS experiments
MS experiments were performed to identify DOX degradation products. The negative ion (M–H)− with m/z 167.0 was detected in the methanol fraction (Fig.7A), consistent with the presence of 3MeSA in the sample. The MS/MS spectrum of that ion shows peaks at m/z 152.0 and 123.0 (Fig. 7B), which were attributed to 3MeSA after loss of methyl and CO2 groups, respectively. The same ions were detected in aqueous fraction from the extract (not shown). The MS spectrum of the aqueous phase also shows the presence of a (M–H)− ion with m/z 195.0 attributed to 3MePA (Fig. 7C). The identification was based on comparing with MS spectra of authentic 3MeSA and 3MePA samples. Together these data confirm that oxidation of DOX by LPO/H2O2 in the presence of ABTS leads to fragmentation of the drug to 3MeSA and 3MePA. The same species were detected among products derived from oxidation of DOX using other oxidation systems [7,26,27]. This suggests a pattern of degradation that is independent on the type of the ultimate oxidant.
Figure 7.
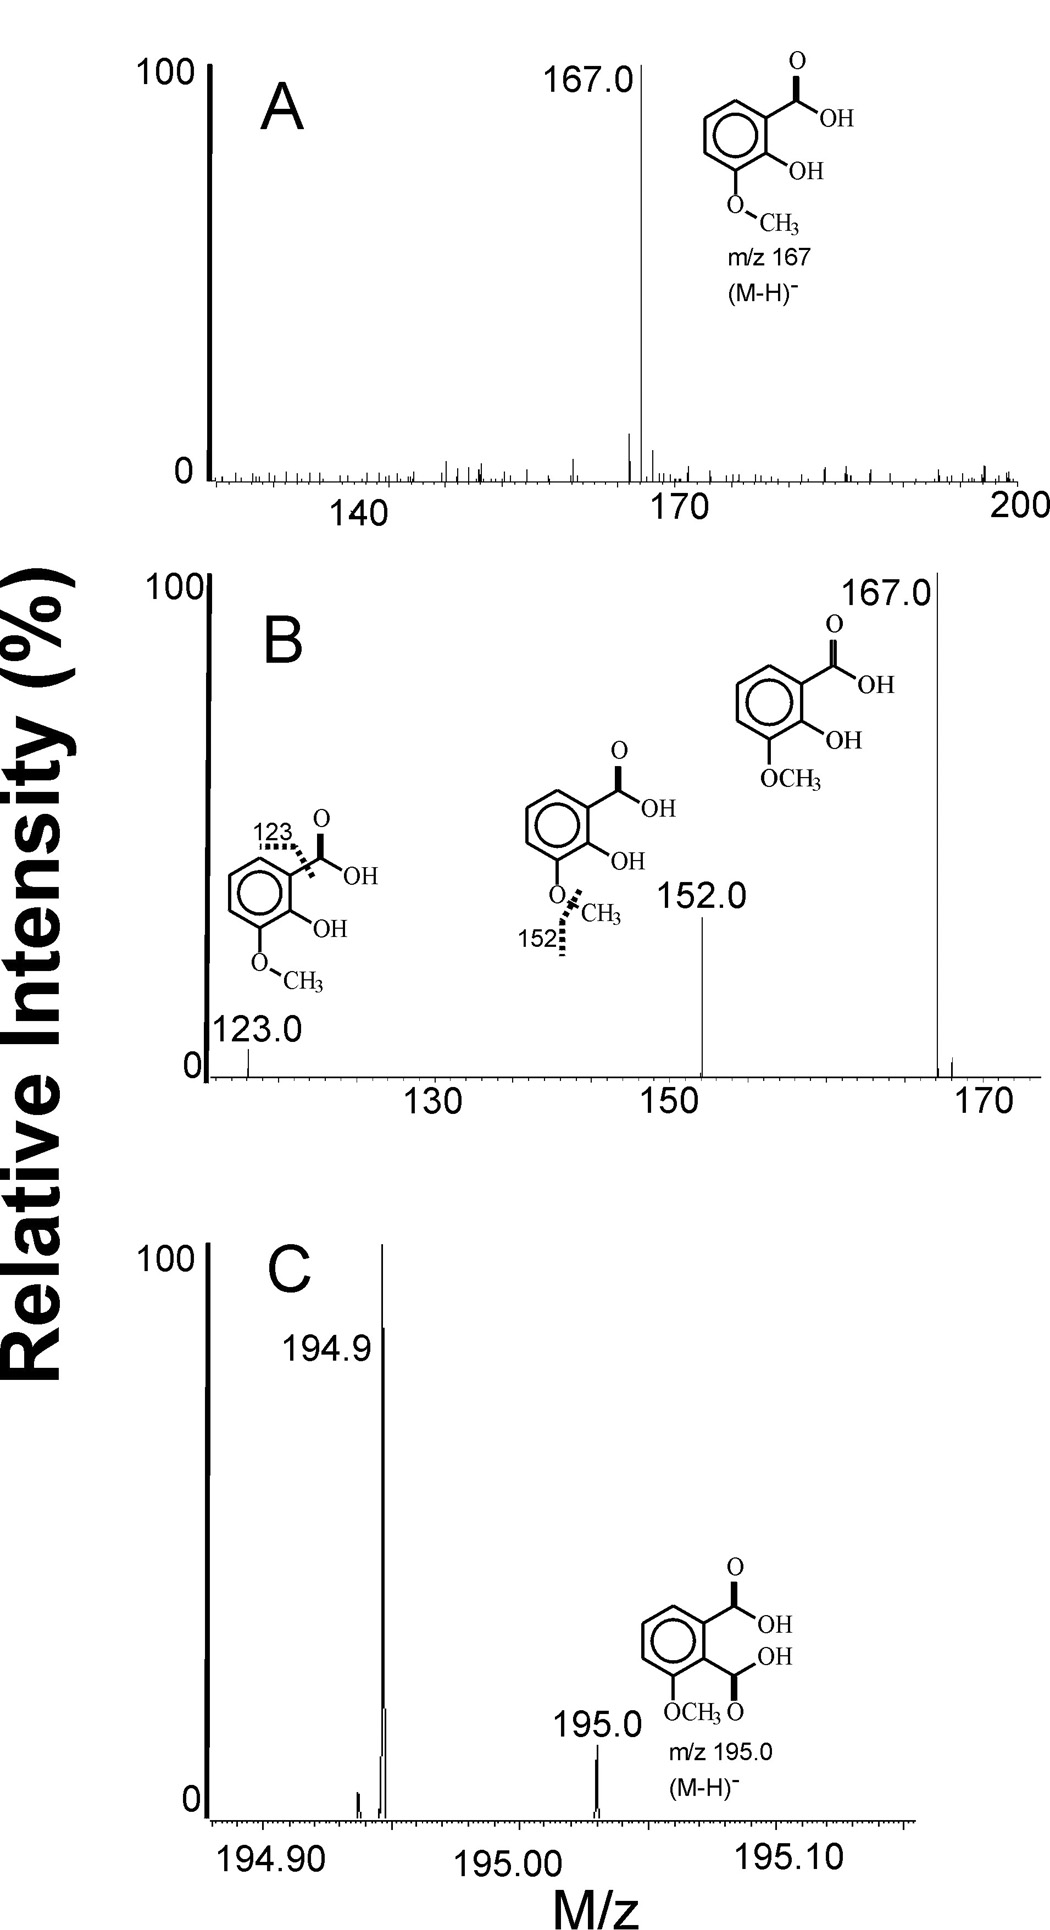
Negative ion MS spectra of DOX oxidation products. (A) MS spectrum of oxidized DOX showing the presence of 3MeSA, m/z 167.0; methanol fraction. (B) MS/MS spectrum of the peak at m/z 167.0 in (A). Ions with m/z 152.0 and 123.0 are those of 3MeSA after loss of CH3 and CO2 groups, respectively. (C) High resolution MS spectrum showing the presence of 3MePA in aqueous fraction, m/z 195.0. The intense peak at m/z 194.9 is from phosphate ion. DOX was oxidized by LPO/H2O2 in the presence of ABTS in phosphate buffer pH 7.0.
Discussion
This study shows that DOX in a concentration-dependent manner inhibits oxidation of ABTS by LPO/H2O2. It also shows that DOX reacts directly with the ABTS•+ radical converting it back to ABTS. Based on stoichiometry of the reaction in its initial fast phase, the drug reacts with ABTS•+ with the efficacy that is comparable to that determined for typical antioxidants Trolox C, GSH and p-QH2 (Table 1). Given that compounds that inhibit oxidation of ABTS or remove the existing ABTS•+ radical are considered antioxidants, results presented in this study suggest that under certain conditions DOX can exhibit antioxidant properties.
ABTS is an excellent substrate for peroxidases [14–16]. Oxidation of ABTS by LPO/H2O2 can be described by the typical peroxidase cycle, in which 1 molecule of H2O2 causes oxidation of 2 molecules of the substrate [16]:
| (4) |
| (5) |
| (6) |
We observed that when DOX was omitted, oxidation of ABTS started immediately upon initiation of the peroxidative process. In contrast, when DOX was present the appearance of ABTS•+ was preceded by a lag period. Because DOX is not oxidized by the LPO/H2O2 system, its inhibitory action cannot be ascribed to competition between ABTS and DOX for the enzyme. It is proposed that the inhibition is rather due to a reduction of the enzymatically generated ABTS•+ back to ABTS by DOX (Eq 1 and Eq 2). This mechanism is consistent with the observation that the inhibitory effect lasts for as long as DOX is present, and only when it is depleted, net oxidation of ABTS is observed. It is also in agreement with the observed rapid reduction of the preformed ABTS•+ by DOX. This process most likely involves the hydroquinone moiety of the drug and the transient semiquinone radical, derived from DOX, as a secondary reductor for ABTS•+ (Eq 1 and Eq 2). The scheme in Fig. 8 illustrates the proposed mechanism for the interaction of DOX with LPO/H2O2/ABTS.
Figure 8.
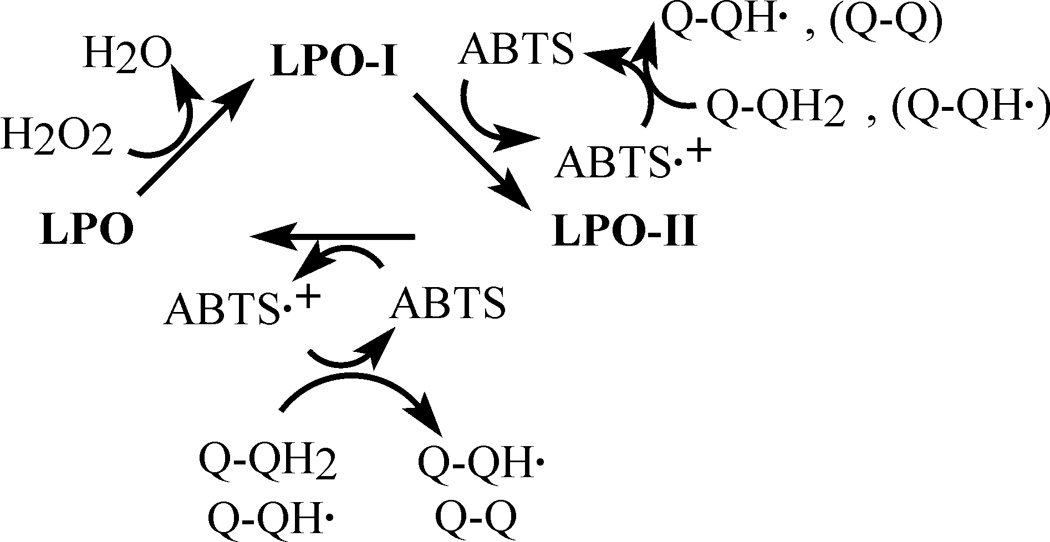
Proposed mechanism of the inhibitory action of DOX on oxidation of ABTS by LPO/H2O2. The inhibition is due to reduction of ABTS•+ by the drugs’ hydroquinone moiety forming a DOX-derived semiquinone, which also reacts with ABTS•+. LPO, LPO-I, LPO-II represent the ferric enzyme, and LPO compounds I and II, respectively. Q-QH2, Q-QH• and Q-Q designate redox-active groups of intact doxorubicin, a doxorubicin free radical (quinone-semiquinone form), and the di-quinone form of DOX, respectively.
The antioxidant capacity of a compound is usually related to its oxidation potential [31]. In case of DOX, the accurate redox potential of its hydroquinone moiety is not known. We expect that because in the molecule of DOX, the hydroquinone moiety is coupled to the highly electrophilic quinone moiety, the corresponding potential E(Q-QH•/Q-QH2), will be above the value determined for p-hydroquinone, E(p-Q•−,2H+/p-QH2) = 0.459 V vs NHE [32]. Because for ABTS•+ E(ABTS•+/ABTS) = 0.68 V [30], and the compound undergoes readily reduction by DOX, the upper limit for E(Q-QH•/Q-QH2) is close to 0.68 V. Thus, the oxidation potential for the Q-QH2 moiety in DOX is expected to be in the range of 0.459 – 0.68 V, which renders it accessible for many biological oxidants. Earlier, using cyclic voltammetry the potential for DOX was estimated to be in the range ~0.474 – 1.024 V versus NHE (0.23 – 0.78 V versus SCE, ref 26), and our new estimate is within this limit.
Interaction of DOX with oxidants appears to be irreversible as it leads to degradation of the anthracycline to low molecular weight compounds, 3MePA and 3MeSA [7,26,27]. This transformation occurs, presumably, through the di-quinone form of the drug, DOX(Q-Q), which could be formed as described by Eq 2 and Eq 3. The resulting 3MeSA, a good electron donor, may contribute to the reduction of ABTS•+, as suggested by larger than 2 ratio Δ[ABTS•+]/Δ[DOX consumed], determined after a prolonged observation (Table 1). Importantly, the presence of 3MeSA, a derivative of salicylic acid, among the DOX metabolites raises a possibility of involvement of this product in biological actions of the anthracycline, as suggested in [26].
The notion that anthracyclines can function as antioxidants is opposite to the currently prevailing hypothesis, according to which anthracyclines are pro-oxidants and exert their biological action through generation of ROS. These two possible mechanisms of action are not mutually exclusive. It is likely that the drugs can operate according to both these mechanisms, given that proper conditions and enzymatic systems are present. In this context it has to be emphasized that in cellular systems anthracyclines stimulate production of H2O2, which then could be used in the drugs’ metabolism. Importantly, the oxidative degradation of DOX has recently been reported to occur in vivo, as suggested by the detection of 3MePA in tissues (heart, liver) of mice administered DOX [7]. Studies in vitro showed that 3MePA and 3MeSA are substantially less cytotoxic to normal and cancer cells than DOX [7,27]. Thus, oxidation of DOX leads to its inactivation, which may diminish its tumoricidal activity.
In conclusion, DOX inhibits the enzymatic oxidation of ABTS via reduction of the ABTS•+ radical chiefly by the drug’s hydroquinone moiety. The reaction of DOX with ABTS•+ occurs with the rate that is close to the rate of reduction of the radical by p-QH2, Trolox C and GSH, but with higher overall “per molecule” efficacy. Daunorubicin (DNR), a doxorubicin analog, also inhibits oxidation of ABTS acting through similar mechanisms (data not shown). Thus, doxorubicin and daunorubicin may function not only as prooxidants but also as antioxidants. This study suggests that oxidative degradation and inactivation of anthracyclines should be considered in any system expressing oxidizing capacity.
Acknowledgements
We thank Mr. Brett A Wagner (University of Iowa) for the sample of 3MePA and Dr. Stephen Macha (University of Cincinnati) for MS analyses of our samples. This work was supported by Merit Review research grants from the Research Service of the Department of Veterans Affairs (BEB), Research Grant (AI34954) from the National Institute of Health (BEB) and the Heartland Affiliate of the American Heart Association (KJR).
Footnotes
This is a PDF file of an unedited manuscript that has been accepted for publication. As a service to our customers we are providing this early version of the manuscript. The manuscript will undergo copyediting, typesetting, and review of the resulting proof before it is published in its final citable form. Please note that during the production process errors may be discovered which could affect the content, and all legal disclaimers that apply to the journal pertain.
REFERENCES
- 1.Lown JW. Adv. Free Radical Biol. Med. 1985;1:225–264. [Google Scholar]
- 2.Doroshow JH. Cancer Res. 1983;43:4543–4551. [PubMed] [Google Scholar]
- 3.Gille L, Nohl H. Free Rad. Biol. Med. 1997;23:775–782. doi: 10.1016/s0891-5849(97)00025-7. [DOI] [PubMed] [Google Scholar]
- 4.Keizer HG, Pinedo HM, Schuurhuis GJ, Joenje H. Pharmacol. Ther. 1990;47:219–231. doi: 10.1016/0163-7258(90)90088-j. [DOI] [PubMed] [Google Scholar]
- 5.Reszka KJ, McCormick ML, Britigan BE. Free Radic. Biol. Med. 2003;35:78–93. doi: 10.1016/s0891-5849(03)00238-7. [DOI] [PubMed] [Google Scholar]
- 6.Menna P, Salvatorelli E, Giampietro R, Liberi G, Teodori G, Calafiore AM, Minotti G. Chem. Res. Toxicol. 2002;15:1179–1189. doi: 10.1021/tx020055+. [DOI] [PubMed] [Google Scholar]
- 7.Cartoni A, Meena P, Salvatorelli E, Braghiroli D, Giampietro R, Animati F, Urbani A, Del Boccio P, Minotti G. J. Biol. Chem. 2004;279:5088–5099. doi: 10.1074/jbc.M306568200. [DOI] [PubMed] [Google Scholar]
- 8.Wagner BA, Teesch L, Buettner GR, Britigan BE, Burns CP, Reszka KJ. Chem Res. Toxicol. 2007;20:920–926. doi: 10.1021/tx700002f. [DOI] [PMC free article] [PubMed] [Google Scholar]
- 9.Reszka KJ, McCormick ML, Britigan BE. Biochemistry. 2001;40:15349–15361. doi: 10.1021/bi011869c. [DOI] [PubMed] [Google Scholar]
- 10.Reszka KJ, Britigan LH, Rasmussen GT, Wagner BA, Burns CP, Britigan BE. Arch. Biochem. Biophys. 2004;427:16–29. doi: 10.1016/j.abb.2004.04.012. [DOI] [PubMed] [Google Scholar]
- 11.Reszka KJ, Britigan LH, Britigan BE. J. Pharmacol. Exp. Ther. 2005;315:283–290. doi: 10.1124/jpet.105.089417. [DOI] [PubMed] [Google Scholar]
- 12.Minotti G, Mancuso C, Frustaci A, Mordente A, Santini SA, Calafiore AM, Liberi G, Gentiloni N. J. Clin. Invest. 1996;98:650–661. doi: 10.1172/JCI118836. [DOI] [PMC free article] [PubMed] [Google Scholar]
- 13.Corna G, Santambrogio P, Minotti G, Cairo G. J. Biol. Chem. 2004;279:13738–13745. doi: 10.1074/jbc.M310106200. [DOI] [PubMed] [Google Scholar]
- 14.Shindler JS, Bardsley WG. Biochem. Biophys. Res. Commun. 1975;67:1307–1312. doi: 10.1016/0006-291x(75)90169-2. [DOI] [PubMed] [Google Scholar]
- 15.Pruitt KM, Kamau DN, Miller K, Mansson-Rahemtulla B, Rahemtulla F. Anal. Biochem. 1990;191:278–286. doi: 10.1016/0003-2697(90)90220-4. [DOI] [PubMed] [Google Scholar]
- 16.Brück TB, Fielding RJ, Symons MCR, Harvey PJ. Eur. J. Biochem. 2001;268:3214–3222. doi: 10.1046/j.1432-1327.2001.02213.x. [DOI] [PubMed] [Google Scholar]
- 17.Re R, Pellegrini N, Proteggente A, Pannala A, Yang M, Rice-Evans C. Free Radic. Biol. Med. 1999;26:1231–1237. doi: 10.1016/s0891-5849(98)00315-3. [DOI] [PubMed] [Google Scholar]
- 18.Bartosz G, Bartosz M. Acta Biochim. Pol. 1999;46:23–29. [PubMed] [Google Scholar]
- 19.Aliaga C, Lissi EA. Can. J. Chem. 2004;82:1668–1673. [Google Scholar]
- 20.Wolfenden BS, Willson RL. J. Chem. Soc., Perkin Trans. 1982;2:805–812. [Google Scholar]
- 21.Nelson DP, Kiesow LA. Anal. Biochem. 1972;49:474–478. doi: 10.1016/0003-2697(72)90451-4. [DOI] [PubMed] [Google Scholar]
- 22.Jenzer H, Jones W, Kohler H. J. Biol. Chem. 1986;261:15550–15556. [PubMed] [Google Scholar]
- 23.Chairs JB, Dattagupta N, Crothers DM. Biochemistry. 1982;21:3927–3932. doi: 10.1021/bi00260a004. [DOI] [PubMed] [Google Scholar]
- 24.Childs RE, Bardsley DG. Biochem. J. 1975;145:93–103. doi: 10.1042/bj1450093. [DOI] [PMC free article] [PubMed] [Google Scholar]
- 25.Arnao MB, Cano A, Hernandez-Ruiz J, Garcia-Canovas F, Acosta M. Anal. Biochem. 1996;236:255–261. doi: 10.1006/abio.1996.0164. [DOI] [PubMed] [Google Scholar]
- 26.Ramu A, Mehta MM, Liu J, Turyan I, Aleksic A. Cancer Chemother. Pharmacol. 2000;46:449–458. doi: 10.1007/s002800000174. [DOI] [PubMed] [Google Scholar]
- 27.Reszka KJ, Wagner BA, Teesch LM, Britigan BE, Spitz DR, Burns CP. Cancer Res. 2005;65:6346–6353. doi: 10.1158/0008-5472.CAN-04-2312. [DOI] [PubMed] [Google Scholar]
- 28.Osman AM, Wong KKY, Fernyhough A. Biophys. Res. Commun. 2006;346:321–329. doi: 10.1016/j.bbrc.2006.05.118. [DOI] [PubMed] [Google Scholar]
- 29.Yim MB, Chock PB, Stadtman ER. J. Biol. Chem. 1993;268:4099–4105. [PubMed] [Google Scholar]
- 30.Scott SL, Chen W-J, Bakac A, Espenson JH. J. Phys. Chem. 1993;97:6710–6714. [Google Scholar]
- 31.Buettner GR. Arch. Biochem. Biophys. 1993;300:535–543. doi: 10.1006/abbi.1993.1074. [DOI] [PubMed] [Google Scholar]
- 32.Wardman P. J. Phys. Chem. Ref. Data. 1989;18:1637–1755. [Google Scholar]


