

Abstract
Non-metric indices of topological features of trabecular bone structure, such as structure model index (SMI), connectivity density (Conn.D), and degree of anisotropy (DA), provide unique information relevant to bone quality. With recent technological advancement, in vivo assessment of these indices may be possible from images acquired using high-resolution imaging techniques such as high-resolution peripheral quantitative computed tomography (HR-pQCT). However, more detailed investigation of the dependence of non-metric indices on spatial resolution is needed to determine their applicability.
The purpose of this study was to determine whether these three non-metric indices are affected by the spatial resolution of CT images. First, the SMI, Conn.D, and DA were calculated for trabecular bone specimens with varying plate-like and rod-like structures from resampled μCT images across a range of spatial resolutions and compared to the reference values. To account for differences in size across different species and anatomical sites, the results are reported in normalized resolution units. Next, the impact of resolution on the non-metric indices for cores of human distal tibia trabecular bone from clinical HR-pQCT images was evaluated to determine the applicability of the non-metric indices to in vivo imaging.
We found that the non-metric indices of trabecular bone structure were affected by spatial resolution of CT images. Particularly, the SMI deviated from the high-resolution μCT reference value depending on the structure type, whether plate-like or rod-like. Both Conn.D and DA were underestimated in the images obtained at an in vivo resolution. It is not trivial to determine absolute threshold for validity of these non-metric indices without considering a specific study design (e.g. relative resolution, the size of the treatment effect to detect, and specimen type). The results of this study provide an upper bound for the accuracy of the non-metric indices under limited resolution scenarios.
Keywords: Structure model index, Resolution, Trabecular bone, Micro-CT, HR-pQCT
INTRODUCTION
Characterization of trabecular bone quantity and quality has received considerable attention due to its sensitivity to stimuli, including hormonal (8, 31), mechanical (12), and therapeutic (3, 30) effects. Trabecular bone structure is one feature of bone quality that is known to affect bone strength, and its quantification has become an important area of research. With technical advances in imaging and image processing, this field has grown and both ex vivo and in vivo imaging studies have become a standard part of skeletal characterization for phenotyping (2, 17), assessing skeletal status (1, 15), and monitoring therapy (3, 30).
A variety of structural indices have been introduced to quantitatively characterize the geometric properties of trabecular bone. These include volume and surface fraction (BV/TV and BS/BV) and metrics such as trabecular thickness (Tb.Th), trabecular number (Tb.N), and trabecular spacing (Tb.Sp). Additional, non-metric indices such as structure model index (SMI), connectivity density (Conn.D), and degree of anisotropy (DA) have been introduced to describe topological features of bone microstructure. Their predictive powers for mechanical strength of trabecular bone has been demonstrated (14, 22, 23), providing unique information relevant to bone quality. SMI, which is derived from surface convexity, has been proposed as feature by which to classify trabecular bone structure type -- specifically, the degree to which the structural elements resemble plate-like or rod-like geometries. A rod-like trabecular bone structure is characteristic of osteoporotic patients (11) and is strongly correlated with bone strength (23). The degree of trabecular connectivity, measured by Conn.D, also provides valuable information, since loss of connectivity has substantial impact on structural integrity and results in elevated fracture risk (4, 9, 27). DA is a measure of directional variation of a structure, calculated from a ratio of maximum to minimum eigenvalues of the mean intercept length tensor (7, 10, 26). Though not directly correlated with the mechanical properties of bone, DA provides insight into the directional dependence of bone strength (4, 10). With age, trabecular bone is known to become more rod-like (6), with connectivity being lost by disruption of thin horizontal trabeculae, and increasingly anisotropic (24).
The recent advancement in non-invasive imaging techniques, such as high-resolution magnetic resonance imaging (HR-MRI) and peripheral quantitative computed tomography (HR-pQCT), allows in vivo assessment of trabecular bone structure indices. Three-dimensional trabecular bone structure indices, and especially the non-metric indices described above, have been routinely assessed ex vivo, from images obtained by micro-computed tomography (μCT). Assessment of trabecular microstructure has been attempted using multi-detector-row computed tomography at an in-plane resolution of 250 μm and a slice thickness of 500 μm (13). With the emergence of HR-MRI and HR-pQCT, in vivo nominal resolutions of approximately 150 μm in-plane with a 400-μm slice thickness and an 82-μm isotropic voxel size, can be achieved, respectively. At these resolutions, however, the average human trabeculae only spans 1 - 2 voxels in diameter, giving rise to significant partial volume effects that confound the thresholding process and limit the accuracy of structural indices. While the resolution dependence of conventional structure indices such as BV/TV, Tb.Th, Tb.N, and Tb.Sp has previously been investigated for different modalities (18, 20, 25, 29), resolution effects for non-metric indices, such as SMI, Conn.D, and DA have not been rigorously evaluated. A more detailed investigation on resolution dependence of non-metric indices is needed to determine their applicability to in vivo imaging of trabecular bone structure.
The goal of this study is to determine whether three non-metric indices, namely SMI, Conn.D and DA of a trabecular bone structure are affected by the spatial resolution of CT images. To answer this question, three non-metric indices were calculated for specimens with varying plate-like and rod-like structures and sizes from resampled μCT images across a range of spatial resolutions. To determine the applicability of these non-metric indices for trabecular bone structure to the in vivo imaging, the impact of resolution on three non-metric indices was also evaluated for the clinical HR-pQCT images by comparing against the μCT reference measurements.
MATERIALS AND METHODS
Simulations
To determine whether the non-metric indices of a trabecular bone are affected by the spatial resolution of CT images, the values calculated for specimens with varying plate-like and rod-like structures from resampled μCT images at a range of spatial resolution were compared to the reference values.
Specimens
To represent various trabecular structure sizes and types (i.e. spanning rod, plate, and mixed structures), the following four specimen groups were used in the simulation part of this study: bovine proximal femur and tibia, human radius, and murine proximal tibia. Seven bovine proximal femur cores and eight bovine proximal tibia cores, 8 mm in diameter and 10 mm in length, were obtained. The cores were repeatedly sonicated (Branson 2510, Branson Ultrasonic Corporation, Denbury, CT, USA) in a mild detergent (10% Terg-A-Zyme solution, Aclonox, White Plains, NY, USA) bath for defatting prior to immersion in water in preparation for imaging. Fifteen human radius cubes with a side length of 12 mm were extracted from fifteen cadavers (eight males and seven females, aged 72.8 ± 10.8 years), 10 mm proximal to the distal endplate. The cubes were fixed with marrow intact for imaging. Left tibiae (n = 14) from 12-week old mice were isolated and cleaned of adherent tissue. The bones were then defatted by sequential extraction in ethanol and diethyl ether using a Soxhlet apparatus and dried overnight at 90°C.
Micro-computed tomography Acquisition
The bovine proximal femur and bovine proximal tibia specimens were imaged with an isotropic voxel size of 16 μm in a commercial micro-tomography system (μCT 40, Scanco Medical AG, Bassersdorf, Switzerland). The following settings were used for acquisition: source voltage 55 kVp, tube current 144 μA, and matrix size of 1024 × 1024. The human radius and murine tibia were imaged in a μCT 20 (Scanco MedicalAG) system at voxel sizes of 34 μm and 9 μm respectively. Acquisition was performed as described previously (19).
Analysis
For structural evaluation purposes, volumes of interest comprising trabecular bone were manually identified for each specimen. A central 5.12 mm cubic section for both bovine femur and tibia cores and an 8.8 mm cubic section for the human radius cubes were extracted from the center of each volume. The full trabecular compartment of murine tibia, defined by semi-automatically drawn contours at the endocortical boundary was used, spanning 1 mm distally from the growth plate. All subsequent image-processing steps were conducted using Image Processing Language (IPL, Scanco Medical AG) on a dual-Alpha OpenVMS workstation (DS20E, Hewlett Packard Inc.).
To examine the effect of voxel size on SMI, Conn.D, and DA, the original grayscale images were resampled isotropically to a range of lower voxels: Human radii were resampled to isotropic voxel sizes of 34, 59, 82 and 153 μm; murine tibiae to voxel sizes of 18, 27, 36, 54 and 72 μm; and both bovine proximal femur and tibia cores to voxel sizes of 16, 34, 82, 153 μm. Representative three-dimensional images and grayscale cross-sectional images of each specimen type are shown in Figure 1 at their original resolutions and at the corresponding lowest tested resolution. The nominal resolutions of 82 μm and 153 μm are comparable to the in vivo in-plane resolutions of HR-pQCT imaging and clinical magnetic resonance imaging, respectively. Similarly, 72 μm is comparable to the low-end resolution mode for common in vivo small animal μCT.
Figure 1.

The representative μCT three-dimensional images (4 mm cubic sections (a, d, g) and a murine tibia section) and the visually matched cross-sectional images of the specimens used in this study: a bovine proximal femur and tibia (b, e) imaged at 16 μm and (c, f) resampled to 153 μm; a human distal tibia (h) imaged at 34 μm and (i) resampled to 153 μm; a murine tibia (k) imaged at 9 μm and (l) resampled to 72 μm. At the lowest resampled resolutions, images are highly pixelated, approximating the details of trabecular structure.
A fixed global threshold was used to segment the bone phase prior to the structure indices calculations. A grayscale value was visually selected, so that the resulting binary image best represented the original grayscale image. This process was done on each sample group and at each resampled voxel size.
The non-metric indices and Tb.Th were obtained from the resulting binary images generated at each resampled voxel size. As described by Hildebrand and Rueggsegger (11), the SMI values were calculated from the tetrahedrons enclosed in the triangulated surface representation of the volume data. The distance transformation method, where maximal spheres are filled into the object of interest, was applied to obtain Tb.Th, Conn.D was calculated using the Conn-Euler method as described in Odgaard et al (27) and DA was calculated as the ratio of the minor and major principal components of the mean intercept length ellipsoid determined using a projected surface method (7).
The non-metric indices obtained from the images reconstructed at the original voxel size were taken as the reference values and listed in Table 1. The values obtained from the resampled images were compared to these reference values to evaluate the effect of resolution on the non-metric indices calculation. To account for differences in trabecular thickness across different species and anatomical sites, the nominal resolution was normalized by the reference Tb.Th, the group average value calculated at the reference resolution of each sample (Table 1). This relative resolution is a measure of number of pixels assigned to an average trabecula. All results are presented in term of this relative resolution.
Table 1.
The reference values for Tb.Th and the non-metric indices (SMI, Conn.D and DA) (mean ± SD) for each specimen used in the simulation study, calculated from the μCT images at the original (reference) resolution
| Index | Bovine prox. femur | Bovine prox. tibia | Human radius | Murine tibia |
|---|---|---|---|---|
| N | 7 | 8 | 15 | 14 |
| Original nominal resolution [μm] | 16 | 16 | 34 | 9 |
| Relative resolution [Pixels/Tb.Th] | 11.1 | 12.2 | 4.3 | 6.1 |
| Ref. Tb.Th [μm] | 177.5 ± 7.2 | 195.9 ± 14.8 | 147.3 ± 18.2 | 54.9 ± 6.6 |
| SMI | 0.20 ± 0.36 | 0.76 ± 0.62 | 2.26 ± 0.40 | 1.32 ± 0.5 |
| Conn.D [mm-3] | 4.92 ± 1.59 | 3.48 ± 0.80 | 1.90 ± 0.97 | 246 ± 35 |
| DA | 2.12 ± 0.31 | 1.80 ± 0.43 | 1.73 ± 0.14 | 1.91 ± 0.1 |
The reference Tb.Th at the original nominal resolution was used to calculate the relative resolution.
HR-pQCT Protocols
To determine the applicability of the non-metric indices for trabecular bone structure to in vivo imaging, the non-metric indices were calculated for trabecular bone cores of human distal tibia from the images obtained using HR-pQCT and compared to μCT reference measurements.
Specimens
Sixteen trabecular bone cores (10 mm in diameter, 15 mm in length) were obtained from the distal tibiae of 5 human donors post mortem (three males and two females, aged 62.6 ± 10.4 years). The tissue was acquired from a national tissue bank (National Disease Research Interchange, Philadelphia, PA). The cores were extracted approximately 10 mm away from the joint line, defatted and immersed in distilled water, as described above, prior to HR-pQCT and μCT imaging.
Micro-computed tomography and HR-pQCT acquisition
The human distal tibia core specimens were imaged by μCT at 16 μm resolution as described above for the bovine samples. Additionally, the samples were imaged with a clinical HR-pQCT system (XtremeCT, Scanco Medical AG, Bassersdorf, Switzerland) using the standard in vivo protocol described in previous patient studies (1, 15). In short, the x-ray source potential was 60 kVp with a current of 900 μA. A 2D 3072 × 256 element CCD detector was used to acquire 750 projections at a 100 ms integration time per rotation. The 12.6 mm field of view was reconstructed across a 1536 × 1536 matrix, yielding 82 μm voxels. The full length of each core was covered by the automatic acquisition of two adjacent image stacks, spanning 9.05 mm each.
Analysis
A concentric cylindrical volume of interest with an 8 mm diameter was manually defined for each distal tibia core sample. Representative grayscale images of human distal tibia core are shown in Figure 2 at 16 μm using μCT and at 82 μm using HR-pQCT. The original grayscale μCT images of human distal tibiae were processed in the following manner: noise was reduced by applying Gaussian filter (σ = 1.0, support = 1) and the image was binarized using a visually selected, fixed global threshold described previously. Since resampling effectively removes high frequency noise, a smoothing step was not performed for the resampled images prior to discretization. The resulting images were then binarized in the same manner as described for the 16μm images. Calculation of the structural indices in HR-pQCT was based on the segmentation scheme provided by the manufacturer for in vivo analyses. A Laplace-Hamming filter was applied to the original grayscale images to provide smoothing and edge enhancement. Next, the smoothed image was normalized to a fixed maximum intensity. Finally, a fixed global threshold was used to extract the bone phase in the same manner. The SMI, Conn.D, and DA were calculated from the binary images for each of the previous cases.
Figure 2.

The representative visually matched grayscale cross-sectional images (top) and three-dimensional images (bottom) of human distal tibia imaged using a) μCT at 16μm, and b) HR-pQCT at 82 μm (equivalent to relative resolution of 1.73 pixels/Tb.Th). The image is highly pixelated causing severe approximation of the fine trabecular structure in the HR-pQCT image.
Statistical Analysis
In the simulation study, the significance of differences in the SMI, Conn.D, and DA for each specimen with respect to the relative resolution was tested by a single-factor repeated measure analysis of variance. If significance is found, then a paired t-test was applied to isolate the significant differences against the reference value. In addition, the coefficient of determination (r2) between values obtained at each resampled resolution and at the reference relative resolution was calculated to measure the degree of agreement. In the HR-pQCT protocol study, the non-metric indices for human distal tibia cores obtained from the HR-pQCT images and the μCT images resampled at 82 μm were both compared to the reference values. A regression analysis was performed and the linear equations and coefficients of determination (r2) were obtained for each case. The significance in difference was tested using a paired t-test with α = 0.05. For the SMI, a Bland-Altman plot was assessed for qualitative comparison against the values obtained at the reference resolution.
RESULTS
Simulations
Among the four specimen types, human radius cubes had the most rod-like trabecular structure while the bovine proximal femora had the most plate-like trabecular structure. The bovine bones (both tibiae and femora) and the human tibiae were similar in trabecular thickness; the murine tibiae were roughly one-third the size of the other specimens. As is evident in representative grayscale images in Figure 1, at a low resolution, the details of the trabecular structures are lost and the images are highly pixelated.
The SMI increasingly deviated from the reference values in response to decreased relative resolution (Figure 3a); however, the degrees varied depending on a structure type. More rod-like structures among the tested specimens, human distal radii and murine tibiae became significantly different (p < 0.001) from the corresponding reference values at around 3 pixels/Tb.Th (Figure 3a). For example, at 6.1 pixels/Tb.Th, the SMI of the murine tibiae was 1.3 on average (Table 1), meaning a mixture of plate-like and rod-like structures. However, as the relative resolution degraded down to 0.8 pixel/Tb.Th, its SMI became 2.4, a more rod-like structure (Figure 3a). At this low relative resolution, the details were lost and the trabecular structure became more like clusters (Figure 1). Consequently the r2 value for the murine tibiae dropped to 0.76 (Figure 3b).
Figure 3.

The changes in the non-metric indices (a, c, and e) and in their correlation (r2) with the reference resolution (b, d, and f) against relative resolution. The Conn.D for murine tibia is out of the plotted range thus not shown here. The lines are simply connecting the data points.
RMANOVA and paired t-tests revealed significant decreases in Conn.D with a decrease in relative resolution for all tested specimens (all p < 0.001) (Figure 3c). The degree of decrease in Conn.D varied from 28% (bovine tibiae) to 76% (murine tibiae) depending on specimen type. The correlations to the reference values, decreased dramatically for bovine proximal femur and murine tibia as the relative resolution decreased (Figure 3d).
The observed deviations of DA from the reference values ranged up to -11% (murinetibiae) (Figure 3e). The correlations to the reference values started weakening at a notably higher relative resolution than SMI (Figure 3f). For instance, although no significant deviation from the reference value was detected for murine tibiae (Figure 3e), the correlation to the reference value dropped dramatically down to r2 = 0.01 (Figure 3f).
HR-pQCT Protocols
The non-metric indices for trabecular bone cores of human distal tibia calculated from the images at 82 μm correlated well (r2 > 0.75) with the reference values obtained from the μCT images at 16 μm, whether images were resampled from the μCT images or acquired using HR-pQCT (Table 2). However, the errors in absolute values were observed (Figure 4 a-c and Table 2). As observed in the simulation study, the accuracy of SMI was structure-type dependent (Figure 5) (see Discussions). Despite their excellent correlations to the reference values, the Conn.D obtained from the resample images and the HR-pQCT images were significantly underestimated (p < 0.001) by 16% and 31%, respectively (Table 2). Similarly, the DA obtained from the HR-pQCT images was significantly underestimated (p < 0.001) by 10% (Table 2).
Table 2.
The average values of Tb.Th, non-metric indices (SMI, Conn.D, and DA) (mean ± SD), and the correlation coefficients (r2) of non-metric indices for trabecular bone cores of human distal tibia obtained from the reference μCT images (16 μm), the μCT images resampled at 82 μm, and the HR-pQCT images acquired at 82 μm
| Mean ± SD |
r2 |
|||||
|---|---|---|---|---|---|---|
| Index | μCT at 16 μm | μCT at 82 μm (resampled) | HR-pQCT at 82 μm | μCT at 16μm vs. μCT at 82 μm (resampled) | μCT at 16 μm vs. HR-pQCT at 82 μm | μCT at 82 μm (resampled) vs. HR-pQCT at 82 μm |
| Ref. Tb.Th [μm] SMI | 146.5 ± 23.1 | 175.7 ± 21.1 | 232.4 ± 22.4 | - | - | - |
| Over all | 1.24 ± 0.42 | 1.61 ± 0.62 | 1.13 ± 0.72 | 0.94** | 0.90ns | 0.95** |
| More plate-like (SMI ≤ 1.5) | 1.04 ± 0.35 | 1.32 ± 0.49 | 0.77 ± 0.54 | 0.93** | 0.82* | 0.90** |
| More rod-like (SMI > 1.5) | 1.67 ± 0.13 | 2.24 ± 0.33 | 1.92 ± 0.31 | 0.73* | 0.60ns | 0.97** |
| Conn.D [mm-3] | 4.16 ± 1.14 | 3.48 ± 1.08 | 2.87 ± 0.87 | 0.81** | 0.75** | 0.98** |
| DA | 2.24 ± 0.27 | 2.28 ± 0.30 | 2.02 ± 0.28 | 0.89ns | 0.93** | 0.90** |
The reference Tb.Th was used to calculate the relative resolution.
p < 0.01
p < 0.001
not significant (p > 0.05)
Figure 4.

The linear regression analyses on the non-metric indices for trabecular bone core of human distal tibia to determine the correlations between the measurements calculated from two sets of images obtained differently: (a-c) the HR-pQCT images and the μCT images at reference resolution (16 μm) and (d-f) the resampled μCT images and the HR-pQCT images both at 82 μm.
Figure 5.
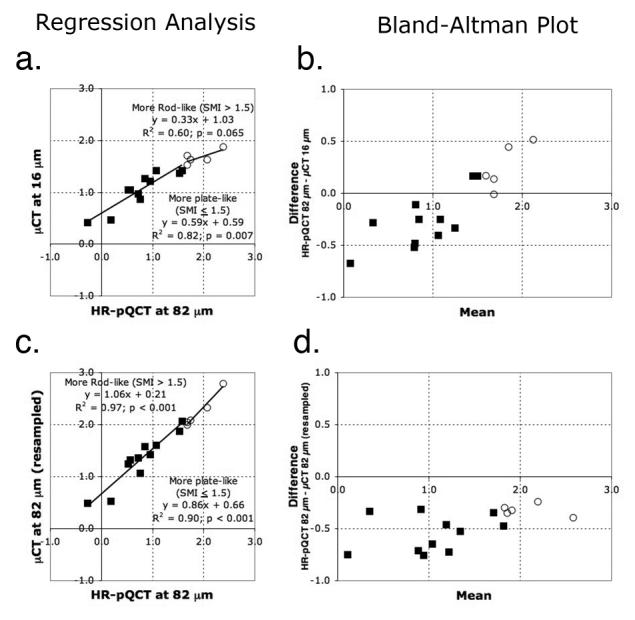
The linear regression analyses and the Bland-Altman plots on the SMI for trabecular bone core of human distal tibia calculated from two sets of images obtained differently: (a-b) The HR-pQCT images and the μCT images at reference resolution (16 μm) and (c-d) the resampled μCT images and the HR-pQCT images both at 82 μm. The measurements are grouped by the structure type at threshold SMI = 1.5. The predominantly plate-like structure (SMI ≤ 1.5) is represented by a filled square and the predominantly rod-like structure (SMI > 1.5) by an open circle. The linear regression analysis determines the correlations and the Bland-Altman plots qualitatively compare the measurements obtained from two datasets.
DISCUSSION
In this study, we found that three non-metric indices of trabecular bone structure are affected by the spatial resolution of CT images. Specifically, the SMI values we obtained from resampled μCT images for bone specimens with a range of morphologies increasingly deviated from the reference values as the relative resolution decreased (Figure 3a), and its magnitude varied depending on the structure type, whether plate-like or rod-like. Similarly in a more clinically relevant context, the SMI of human trabecular bone from the distal tibia obtained at the in vivo resolution (82 μm) was also structure-type dependent: the magnitude of deviation from the reference value increased as the SMI increased (Figure 5b). Both Conn.D and DA of the specimens obtained from their resampled μCT images decreased as the relative resolution decreased (Figure 3c and e), and those of human distal tibia obtained from the HR-pQCT images were significantly lower than the corresponding μCT reference values (Table 2).
Considering the applicability of SMI to the in vivo imaging such as using HR-pQCT, the challenges are two-fold. First, the current in vivo relative resolution is limited to ∼2 pixels/trabecula on average for the distal radius and tibia. Ito et al (13) reported that even with images obtained using multi-detector-row CT at a spatial resolution of 250 × 250 × 500 μm, fractured and non-fractured vertebrae were distinguishable (p < 0.0001). However, the in-plane relative resolution was only 1.4 pixels/Tb.Th at this resolution. Our results show that the reliability of the measurement at this relative resolution is questionable (Figure 3b). Therefore, we speculate that the observed discriminatory power of the SMI by Ito et al (13) is driven primarily by bone volume rather than by its true topology at this resolution. The question on the minimal relative resolution required for the reasonable accuracy and reliability of SMI is not a trivial to answer as discussed here.
From the simulation study, we found that the accuracy of the SMI with respect to relative resolution is structure-type dependent: a plate-like structure is less sensitive to resolution degradation and consequent partial volume averaging than a rod-like structure is. A possible explanation for this difference lies in the definition, SMI = (BV·dBS/dr)/BS2. A plate-like structure has minimal change in surface curvature (dBS/dr ≈ 0), making it robust against pixelation. On the contrary, a rod-like structure has more curved surface (high dBS/dr), as well as inherent low bone volume fraction (BV/TV) and high surface-to-volume ratio (BS/BV), together making it more prone to greater partial volume effect. As a result, a rod-like structure is increasingly misrepresented as the relative resolution decreases (Figure 1).
Second, in a clinically relevant context, the observed structure-type dependence of SMI at a low relative resolution (particularly 1 - 2 pixels/Tb.Th achievable by HR-pQCT) implies that the errors are different not only between anatomical sites (e.g. radius and tibia) but also between two trabecular bones with different structure types at the same anatomical site. For example, although determined from the HR-pQCT images at the same resolution (82 μm), radius specimens in MacNeil and Boyd (21) were highly rod-like (SMI = 3.0 ± 0.8) and the SMI correlated poorly (r2 = 0.075) with the reference value; on the other hand, human distal tibia in the current study had a mixture of plate-like and rod-like structures (SMI = 1.2 ± 0.4) and correlated strongly (r2 = 0.90) with the μCT-obtained reference value (Table 2).
In addition, the difference in errors between specimens with different structure types at the same anatomical site can be a problem in clinical studies. To illustrate this inter-specimen difference of errors in the SMI at the in vivo resolution, human distal tibia samples were grouped by the structure type at a threshold SMI of 1.5, as seen in Figure 5. Although SMI obtained from the HR-pQCT images had no significant error compared to the reference value overall (Table 2), SMI of the predominantly plate-like structure (SMI ≤ 1.5) was 26% lower than the reference value on average, while that of the predominantly rod-like structure (SMI > 1.5) was 14 % higher (Figure 5a and b). In other words, a structure type assessed by the SMI may be exaggerated beyond the true trabecular structure type when obtained from images at the in vivo resolution.
Although the Conn.D for trabecular bone cores of human distal tibia obtained from the HR-pQCT images at the in vivo resolution was significantly underestimated, it correlated well with the μCT reference value (r2 = 0.75, p < 0.001) (Table 2). Hence, this result supports the suggestion of obtaining Conn.D from the HR-pQCT images at 82 μm (21). However, in the simulation study, the correlation with the reference value dramatically decreased with the relative resolution for some specimens (Figure 3d), in agreement with the previous studies (16, 17). From these results, the resolution dependence of Conn.D may be affected by site dependent differences. In addition, Conn.D alone cannot be a measure of bone quality (5) due to its weak correlations with mechanical properties and other metrics (23). Thus it must be used in conjunction with other metrics and micro finite element analysis (21).
Among the three tested non-metric trabecular structure indices, the DA showed no significant difference from the reference value throughout the tested relative resolutions for all specimens. In addition, the strong correlation with the reference value (r2 ≥ 0.71) was also maintained except for murine tibiae (Figure 3f). The underlying mechanism is that isotropic resampling averages equally in all directions, thereby effectively leaving the ratio constant (16). While the DA of human distal tibiae obtained from the HR-pQCT images at the clinical in vivo resolution had an excellent correlation (r2 = 0.93) in this study, MacNeil and Boyd (21) reported weaker correlation for human distal radii (r2 = 0.67).
Two limitations in the methods used in this study are worth noting. First, even though thresholding is crucial in segmenting the bone phase for the calculation of non-metric indices, selecting an optimal threshold value is not trivial. Although commonly used, a manual threshold selection, such as the global fixed threshold method used in this study, can be increasingly subjective, especially as relative resolution decreases. As a result, non-negligible systematic errors are introduced in the structure measure calculations. An automatic, non-subjective thresholding method, however, did not relieve the challenge in selecting the optimal threshold for images at such a low relative resolution - the non-metric indices calculated from the images segmented using adaptive-iterative threshold method (28), showed similar deviation patterns from the reference values and had similar or lower correlations to the reference values especially at a low relative resolution below 3 pixels/Tb.Th (data not shown).
Second, neither resampling μCT images at a lower resolution nor ex vivo imaging represents the image quality actually acquired in an in vivo scenario. By resampling, the noise is effectively reduced, resulting in under-representation of the impact of resolution on the non-metric indices than in in vivo imaging using HR-pQCT acquired at the same resolution (16) (Figure 5d). However, resampling facilitated accurate comparison between exactly matched volumes of interest (17). Similarly, ex vivo imaging disregards the artifacts typically associated with in vivo imaging conditions such as lower signal-to-noise ratio due to greater surrounding bone and soft tissue volumes, increased beam hardening, and artifacts related to patient motion. Nonetheless, ex vivo imaging was necessary in this study for obtaining the μCT reference values and for the resampling simulations.
In conclusion, we found that three non-metric indices of trabecular bone structure are affected by the spatial resolution of CT images. Most notably, the SMI deviated from the high-resolution μCT reference value depending on the structure type, whether plate-like or rod-like. The other two indices, the Conn.D and DA were both underestimated at an in vivo resolution (82 μm). It is not trivial to determine absolute threshold for validity of these non-metric indices without considering a specific study design (e.g. relative resolution, the size of the treatment effect to detect, and specimen type). The results of this study provide an upper bound for the accuracy of the non-metric indices under limited resolution scenarios.
Acknowledgements
The authors would like to thank Ahi Issever for preparing the human distal radius specimens and Mary Bouxsein for valuable discussions. This study was supported by NIH RO1 AG17762.
Footnotes
Publisher's Disclaimer: This is a PDF file of an unedited manuscript that has been accepted for publication. As a service to our customers we are providing this early version of the manuscript. The manuscript will undergo copyediting, typesetting, and review of the resulting proof before it is published in its final citable form. Please note that during the production process errors may be discovered which could affect the content, and all legal disclaimers that apply to the journal pertain.
REFERENCES
- 1.Boutroy S, Bouxsein ML, Munoz F, Delmas PD. In vivo assessment of trabecular bone microarchitecture by high-resolution peripheral quantitative computed tomography. J Clin Endocrinol Metab. 2005;90:6508–15. doi: 10.1210/jc.2005-1258. [DOI] [PubMed] [Google Scholar]
- 2.Bouxsein ML, Uchiyama T, Rosen CJ, Shultz KL, Donahue LR, Turner CH, Sen S, Churchill GA, Muller R, Beamer WG. Mapping quantitative trait loci for vertebral trabecular bone volume fraction and microarchitecture in mice. J Bone Miner Res. 2004;19:587–99. doi: 10.1359/JBMR.0301255. [DOI] [PubMed] [Google Scholar]
- 3.Chesnut CH, 3rd, Majumdar S, Newitt DC, Shields A, Van Pelt J, Laschansky E, Azria M, Kriegman A, Olson M, Eriksen EF, Mindeholm L. Effects of salmon calcitonin on trabecular microarchitecture as determined by magnetic resonance imaging: results from the QUEST study. J Bone Miner Res. 2005;20:1548–61. doi: 10.1359/JBMR.050411. [DOI] [PMC free article] [PubMed] [Google Scholar]
- 4.Davison KS, Siminoski K, Adachi JD, Hanley DA, Goltzman D, Hodsman AB, Josse R, Kaiser S, Olszynski WP, Papaioannou A, Ste-Marie LG, Kendler DL, Tenenhouse A, Brown JP. Bone strength: the whole is greater than the sum of its parts. Semin Arthritis Rheum. 2006;36:22–31. doi: 10.1016/j.semarthrit.2006.04.002. [DOI] [PubMed] [Google Scholar]
- 5.Day JS, Ding M, Odgaard A, Sumner DR, Hvid I, Weinans H. Parallel plate model for trabecular bone exhibits volume fraction-dependent bias. Bone. 2000;27:715–20. doi: 10.1016/s8756-3282(00)00371-9. [DOI] [PubMed] [Google Scholar]
- 6.Ding M, Hvid I. Quantification of age-related changes in the structure model type and trabecular thickness of human tibial cancellous bone. Bone. 2000;26:291–5. doi: 10.1016/s8756-3282(99)00281-1. [DOI] [PubMed] [Google Scholar]
- 7.Goulet RW, Goldstein SA, Ciarelli MJ, Kuhn JL, Brown MB, Feldkamp LA. The relationship between the structural and orthogonal compressive properties of trabecular bone. J Biomech. 1994;27:375–89. doi: 10.1016/0021-9290(94)90014-0. [DOI] [PubMed] [Google Scholar]
- 8.Gouveia CH, Jorgetti V, Bianco AC. Effects of thyroid hormone administration and estrogen deficiency on bone mass of female rats. J Bone Miner Res. 1997;12:2098–107. doi: 10.1359/jbmr.1997.12.12.2098. [DOI] [PubMed] [Google Scholar]
- 9.Guo XE, Kim CH. Mechanical consequence of trabecular bone loss and its treatment: a three-dimensional model simulation. Bone. 2002;30:404–11. doi: 10.1016/s8756-3282(01)00673-1. [DOI] [PubMed] [Google Scholar]
- 10.Harrigan TP, Mann RW. Characterization of microstructural anisotropy in orthotropic materials using a second rank tensor. Journal of Materials Science. 1984;19:761–767. [Google Scholar]
- 11.Hildebrand T, Ruegsegger P. Quantification of Bone Microarchitecture with the Structure Model Index. Comput Methods Biomech Biomed Engin. 1997;1:15–23. doi: 10.1080/01495739708936692. [DOI] [PubMed] [Google Scholar]
- 12.Huiskes R, Ruimerman R, van Lenthe GH, Janssen JD. Effects of mechanical forces on maintenance and adaptation of form in trabecular bone. Nature. 2000;405:704–6. doi: 10.1038/35015116. [DOI] [PubMed] [Google Scholar]
- 13.Ito M, Ikeda K, Nishiguchi M, Shindo H, Uetani M, Hosoi T, Orimo H. Multi-detector row CT imaging of vertebral microstructure for evaluation of fracture risk. J Bone Miner Res. 2005;20:1828–36. doi: 10.1359/JBMR.050610. [DOI] [PubMed] [Google Scholar]
- 14.Ito M, Nishida A, Koga A, Ikeda S, Shiraishi A, Uetani M, Hayashi K, Nakamura T. Contribution of trabecular and cortical components to the mechanical properties of bone and their regulating parameters. Bone. 2002;31:351–8. doi: 10.1016/s8756-3282(02)00830-x. [DOI] [PubMed] [Google Scholar]
- 15.Khosla S, Riggs BL, Atkinson EJ, Oberg AL, McDaniel LJ, Holets M, Peterson JM, Melton LJ. 3rd Effects of sex and age on bone microstructure at the ultradistal radius: a population-based noninvasive in vivo assessment. J Bone Miner Res. 2006;21:124–31. doi: 10.1359/JBMR.050916. [DOI] [PMC free article] [PubMed] [Google Scholar]
- 16.Kim DG, Christopherson GT, Dong XN, Fyhrie DP, Yeni YN. The effect of microcomputed tomography scanning and reconstruction voxel size on the accuracy of stereological measurements in human cancellous bone. Bone. 2004;35:1375–82. doi: 10.1016/j.bone.2004.09.007. [DOI] [PubMed] [Google Scholar]
- 17.Kohler T, Beyeler M, Webster D, Muller R. Compartmental bone morphometry in the mouse femur: reproducibility and resolution dependence of microtomographic measurements. Calcif Tissue Int. 2005;77:281–90. doi: 10.1007/s00223-005-0039-2. [DOI] [PubMed] [Google Scholar]
- 18.Kothari M, Keaveny TM, Lin JC, Newitt DC, Genant HK, Majumdar S. Impact of spatial resolution on the prediction of trabecular architecture parameters. Bone. 1998;22:437–43. doi: 10.1016/s8756-3282(98)00031-3. [DOI] [PubMed] [Google Scholar]
- 19.Laib A, Hauselmann HJ, Ruegsegger P. In vivo high resolution 3D-QCT of the human forearm. Technol Health Care. 1998;6:329–37. [PubMed] [Google Scholar]
- 20.Laib A, Ruegsegger P. Calibration of trabecular bone structure measurements of in vivo three-dimensional peripheral quantitative computed tomography with 28-micromresolution microcomputed tomography. Bone. 1999;24:35–9. doi: 10.1016/s8756-3282(98)00159-8. [DOI] [PubMed] [Google Scholar]
- 21.Macneil JA, Boyd SK. Accuracy of high-resolution peripheral quantitative computed tomography for measurement of bone quality. Med Eng Phys. 2007 doi: 10.1016/j.medengphy.2006.11.002. [DOI] [PubMed] [Google Scholar]
- 22.MacNeil JA, Boyd SK. Load distribution and the predictive power of morphological indices in the distal radius and tibia by high resolution peripheral quantitative computed tomography. Bone. 2007;41:129–37. doi: 10.1016/j.bone.2007.02.029. [DOI] [PubMed] [Google Scholar]
- 23.Mittra E, Rubin C, Qin YX. Interrelationship of trabecular mechanical and microstructural properties in sheep trabecular bone. J Biomech. 2005;38:1229–37. doi: 10.1016/j.jbiomech.2004.06.007. [DOI] [PubMed] [Google Scholar]
- 24.Mosekilde L, Ebbesen EN, Tornvig L, Thomsen JS. Trabecular bone structure and strength - remodelling and repair. J Musculoskelet Neuronal Interact. 2000;1:25–30. [PubMed] [Google Scholar]
- 25.Muller R, Koller B, Hildebrand T, Laib A, Gianolini S, Ruegsegger P. Resolution dependency of microstructural properties of cancellous bone based on three-dimensional mu-tomography. Technol Health Care. 1996;4:113–9. [PubMed] [Google Scholar]
- 26.Odgaard A. Three-dimensional methods for quantification of cancellous bone architecture. Bone. 1997;20:315–28. doi: 10.1016/s8756-3282(97)00007-0. [DOI] [PubMed] [Google Scholar]
- 27.Odgaard A, Gundersen HJ. Quantification of connectivity in cancellous bone, with special emphasis on 3-D reconstructions. Bone. 1993;14:173–82. doi: 10.1016/8756-3282(93)90245-6. [DOI] [PubMed] [Google Scholar]
- 28.Ridler TW, Calvard S. Picture thresholding using an iterative selection method. IEEE Transaction on Systems, Man, and Cybernetics SMC-8. 1979:630–632. [Google Scholar]
- 29.Tabor Z. Analysis of the influence of image resolution on the discriminating power of trabecular bone architectural parameters. Bone. 2004;34:170–9. doi: 10.1016/j.bone.2003.10.002. [DOI] [PubMed] [Google Scholar]
- 30.van Rietbergen B, Majumdar S, Newitt D, MacDonald B. High-resolution MRI and micro-FE for the evaluation of changes in bone mechanical properties during longitudinal clinical trials: application to calcaneal bone in postmenopausal women after one year of idoxifene treatment. Clin Biomech (Bristol, Avon) 2002;17:81–8. doi: 10.1016/s0268-0033(01)00110-3. [DOI] [PubMed] [Google Scholar]
- 31.Zeni S, Gomez-Acotto C, Di Gregorio S, Mautalen C. Differences in bone turnover and skeletal response to thyroid hormone treatment between estrogen-depleted and repleted rats. Calcif Tissue Int. 2000;67:173–7. doi: 10.1007/s00223001106. [DOI] [PubMed] [Google Scholar]