

Introduction
Electrocardiographic imaging (ECGI) is a noninvasive functional imaging modality which reconstructs epicardial potentials, electrograms, and activation and recovery maps from body-surface ECG potentials. For this purpose, up to 256 ECGs are recorded by a 256-channel body surface potential mapping (BSPM) system and the heart-torso geometry is obtained using thoracic computed tomography (CT)1,2. This technique was developed and validated extensively in normal and abnormal canine hearts3–11. More recently, ECGI was validated in humans by comparison with direct intra-operative epicardial mapping in patients undergoing open-heart surgery12. To date, ECGI has been applied in adult human subjects for the following purposes: 1. To study cardiac electrophysiology of the normal adult human heart2. 2. To image electrophysiologic responses to pacing in heart failure patients undergoing cardiac resynchronization therapy13 (pacing sites were localized with an accuracy better than 10 mm)14. 3. To guide catheter ablation of focal ventricular and atrial tachycardias15,16. 4. To image typical atrial flutter prior to catheter ablation1 and atypical atrial flutter prior to a surgical Cox-Maze procedure17.
Here we describe for the first time, a case where ECGI was applied to a pediatric patient with a congenital structural heart defect. The patient had a univentricular heart and Wolff-Parkinson-White syndrome, and ECGI was used to localize the accessory pathway and help guide catheter ablation. To date, there have been no reported cases of ECGI in the pediatric population.
Clinical Course
The patient is a 12 year old female who was diagnosed at birth with tricuspid and pulmonary atresia and interrupted inferior vena cava (IVC) with azygous continuation to the superior vena cava (SVC). Her palliative surgeries included a Kawashima procedure18, followed by completion of her Fontan circulation19 with extracardiac hepatic diversion into the cavopulmonary circuit. She had a remote history of intermittent preexcitation without clinical evidence of tachycardia. However, more recent electrocardiograms demonstrated persistent preexcitation with a short PR interval of 76 msec and a prolonged QRS duration of 195 msec. She had progressive loss of ventricular function with worsening symptoms of heart failure. She had progressed to New York Heart Association (NYHA) stage III heart failure, despite medical therapy, including initiation of intravenous inotropes. Given her history of pre-excitation in the presence of repaired congenital heart disease and heart failure, she was referred to our institution for further evaluation.
On presentation to our institution, a 2-D echocardiogram demonstrated a severely dilated single left ventricle with a LV end diastolic volume of 167ml (z-score 5.9), LV end systolic volume of 127ml (z-score 10.2) and severely decreased systolic function (ejection fraction 23.8%). Her initial 12-lead ECG (Figure 1) demonstrated pre-excited rhythm which localized the pathway to a right lateral position according to the Arruda algorithm20. The decision was made at that time to proceed with an electrophysiologic study (EPS) and ablation of her accessory pathway to potentially improve both her mechanical and electrical ventricular synchrony (CRT through ablation).
Figure 1.
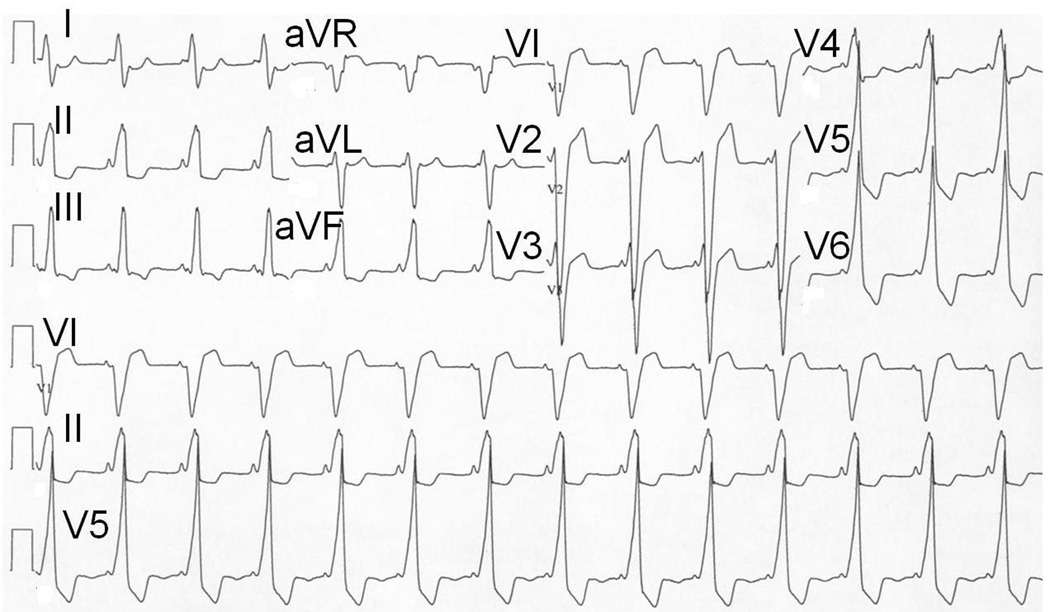
12-lead ECG obtained at initial evaluation of the patient. Note the positive delta wave in V1 and aVF, suggestive of a right lateral manifest accessory pathway according to the Arruda algorithm.
Prior to her electrophysiology study (EPS), her pre-excited baseline rhythm (without adenosine) was mapped with ECGI using electrode-strips covering the front and the back of the torso for a total of 200 electrodes. An ECG gated chest CT (gated to 70% R-R interval) was performed to obtain an accurate heart-torso anatomy. Body surface signals were base-line corrected, filtered to remove 60 Hz noise, and ECGI-reconstructed epicardial potential maps and ventricular activation sequence were produced during a single pre-excited beat (Figure 2). Panel A shows an epicardial potential minimum (most negative potential on the epicardial surface6) at the region of earliest epicardial breakthrough of the activation wavefront (deep blue), 35 ms after onset of the delta wave on the body-surface ECG (lead V2 is shown in the inset for timing). The center of the potential minimum (indicated by an asterisk) was located high on the atrio-ventricular valve (AVV) annulus, near the root of the ascending aorta (AAO), in the paraseptal region. Epicardial potentials during early repolarization (T-wave) followed the same spatial pattern as early activation but with reversed polarity, exhibiting a region of potential maximum (shown in orange, Panel B) at the area of earliest breakthrough. The ECGI reconstructed activation sequence shows activation initiating from the same area (shown in red, Panel C) and propagating in a base-to-apex pattern. Activation initiates from a single site located anteroseptally (marked by asterisk, Figure 2, panels C and D) and excites the whole ventricle without obvious fusion with excitation via the native conduction system, characteristic of a maximally pre-excited right sided pathway. The potential and activation maps indicated the presence of an activation source (insertion of the accessory pathway) at this region.
Figure 2.
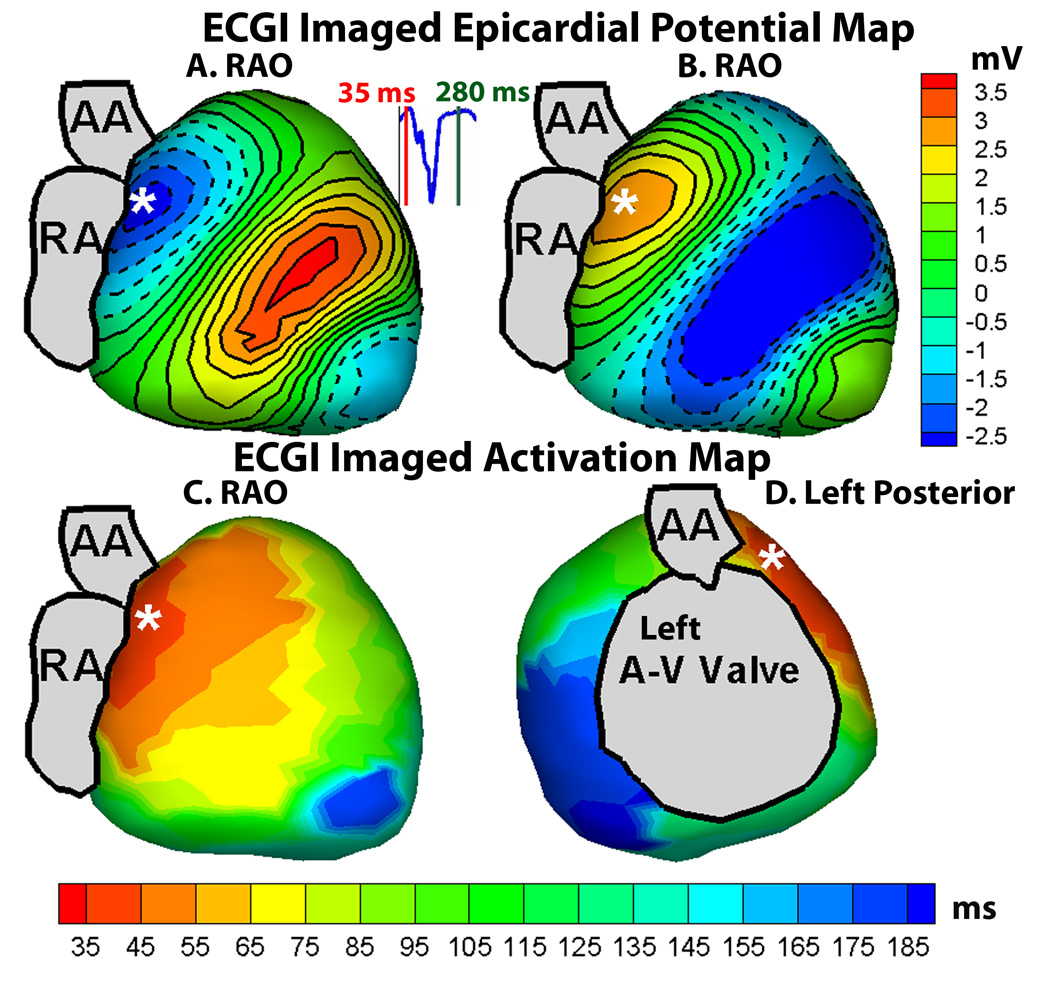
A : Right anterior oblique (RAO) view of ECGI reconstructed epicardial potential map, showing the earliest breakthrough (region of negative potentials in deep blue, with the center of the breakthrough site marked by asterisk) at the anteroseptal area near the root of ascending aorta. B : Same RAO view of ECGI epicardial potential map during early repolarization; epicardial potentials follow the same pattern as in A but with reversed polarity (region of potential maximum in orange). C : Right anterior oblique (RAO) view of ECGI imaged epicardial activation map, showing earliest activation (in red, initiation site marked by asterisk) at the anteroseptal region. D : Left posterior view of the ECGI imaged activation map.
She then underwent cardiac catheterization with EPS and attempted ablation. At the time of her procedure, she weighed 32.5kg with a height of 142cm (BSA 1.13m2). Given her anatomy, there was no transvenous route to access her atria; as such a retrograde aortic approach was utilized. Her EPS demonstrated a short H1V1 interval of 8msec confirming pre-excitation. A 7Fr Radiofrequency (RF) Marinr® catheter (4mm tip) (Medtronic, Minneapolis, MN) was then prolapsed across the aortic valve and introduced retrograde into the left ventricle (Figure 3). Activation mapping was performed during the pre-excited rhythm around the left AVV annulus. Earliest activation on this annulus was seen in the anteroseptal area below the aortic valve annulus. A 73 point Carto (Biosense Webster, Diamond Barr, CA) electroanatomical activation map was constructed of the left ventricle (figure 4) which confirmed early activation in the basal anteroseptal area of the LV, immediately below the aortic valve annulus. Timing in this area was quite early (18–32msec pre-delta); however, multiple RF applications in this area failed to affect accessory pathway (AP) conduction. While there was occasional rapid junctional rhythm, retrograde ventricular:atrial (V:A) conduction was preserved 1:1 with no evidence of heart block. A total of 71 RF test lesions were applied (5 minutes 43 seconds of RF energy); however, AP conduction remained intact and the procedure was abandoned.
Figure 3.
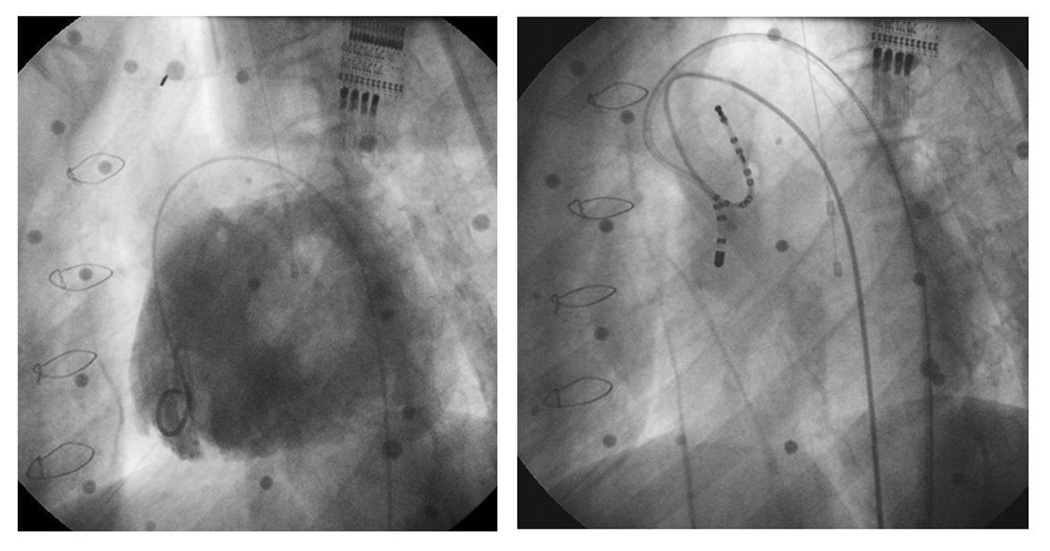
Angiographic images obtained during catheterization. The left panel demonstrates a contrast injection into the single left ventricle via a 4Fr pigtail catheter in the left anterior oblique (LAO) projection. There is a single left sided AVV visualized. This angiogram was the roadmap used to guide catheter mapping and ablation. The right panel (same projection) demonstrates the ablation catheter crossing the aortic valve retrogradely for ablation. The distal tip of the ablation catheter is positioned in the left anteroseptal region, near the common bundle of His.
Figure 4.
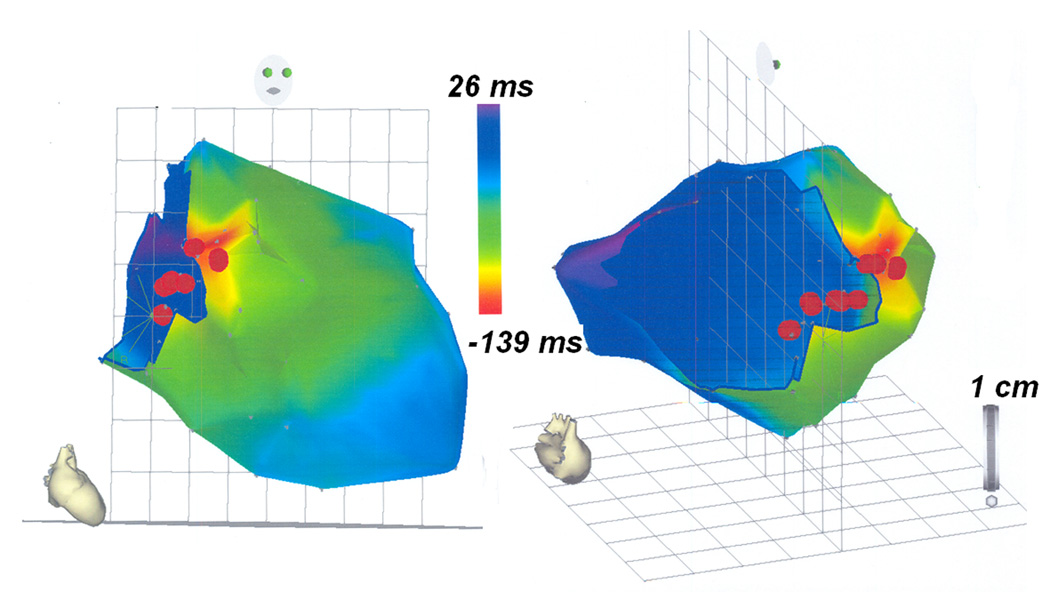
A 73-point CARTO map created during EPS in the RAO (right panel) and left posterior projection (left panel). CARTO maps were constructed during ablation using mid-QRS as the reference point, with areas of red representing areas of early activation and areas of blue representing areas of late activation. The red dots represent a few of the RF lesions.
Her post-ablation ECG remained unchanged. The patient was maximized on medical therapy with improvement in symptoms and discharged home 1 day post EPS to follow up in Cardiology clinic.
Discussion
Noninvasively, and prior to catheterization, ECGI generated a map of the ventricular activation sequence, showing the area of earliest activation in the paraseptal region below the root of the ascending aorta (AAO). The ECGI data guided the EPS and approach to ablation. Electroanatomic 3D mapping of the AVV annulus identified the basal anteroseptal region below the aortic valve annulus as the earliest site of activation during the pre-excited rhythm, concurring with the constructed noninvasive ECGI maps (Figure 2). The entire ECGI activation map correlated well with the invasive electroanatomic mapping data, as can be seen by comparing the RAO and left posterior views of the ECGI activation map in Figure 2 (panels C and D) and the corresponding views of the invasive CARTO map in Figure 4 (panels A and B). Given her unique anatomy, a retrograde approach was necessary; however, AP conduction remained robust despite aggressive ablation. In conjunction with the data obtained from ECGI, we postulate that the pathway might have been on a vestigial right AVV annulus and was in a location not amenable to transcatheter ablation. An epicardial pathway is also a possibility. However, congenital epicardial pathways in children and adults are often associated with the coronary venous system, so this anteroseptal location would not be typical for an epicardial pathway. The location of the presumed vestigial RV pathway and site of earliest epicardial activation indicated by ECGI (Figure 2) are discordant with the site of earliest endocardial activation detected by contact mapping (Figure 4). This is because the ECGI technique reconstructs the surface epicardial activation, whereas the earliest site annotated in red by contact mapping (Figure 4) represents the earliest LV endocardial site accessed by the catheter tip. With a right sided endocardial pathway in the vestigial RV, the earliest ventricular activation would be expected at the endocardial RV base. Her palliative surgeries (Kawashima procedure and completion of Fontan circulation with extracardiac hepatic diversion into the cavopulmonary circuit) did not allow transvenous access to the atria and necessitated an aortic retrograde approach which did not enable transvenous access to map the vestigial RV endocardium. The reconstructed ECGI and contact activation maps therefore merely show the earliest ventricular activation visible to each modality respectively. The contact activation map (Figure 4) is viewed from a superior aspect when compared with the ECGI map (Figure 2). It is also rotated clockwise. The apparent dispersion of RF lesions (Figure 4) is not uncommon with catheter mapping. There is linear excursion of the heart during the respiratory cycle and this can sometimes elongate an otherwise focal series of lesions. In presence of significantly abnormal cardiac anatomy, the noninvasive ECGI technique produced a ventricular activation map which correlated well with the activation sequence generated through invasive electroanatomical mapping. This case study demonstrates the feasibility of noninvasive ECGI imaging in patients with complex congenital heart disease. It engenders the promise of further application of ECGI for understanding ventricular activation and electrophysiology and for aiding in diagnosis and therapy in such cases.
Acknowledgements
The study was supported by Merit Award R37-HL-033343 and Grant R01-HL-49054 from the National Heart, Lung, and Blood Institute to Y. Rudy. Dr. Rudy is the Fred Saigh Distinguished Professor at Washington University in St. Louis.
Footnotes
Disclosures: Y. R. chairs the scientific advisory board and holds equity in CardioInsight Technologies (CIT). CIT does not support any research conducted by Y.R., including that presented here.
Publisher's Disclaimer: This is a PDF file of an unedited manuscript that has been accepted for publication. As a service to our customers we are providing this early version of the manuscript. The manuscript will undergo copyediting, typesetting, and review of the resulting proof before it is published in its final citable form. Please note that during the production process errors may be discovered which could affect the content, and all legal disclaimers that apply to the journal pertain.
References
- 1.Ramanathan C, Ghanem RN, Jia P, et al. Noninvasive Electrocardiographic imaging for cardiac electrophysiology and arrhythmia. Nat Med. 2004;10:422–428. doi: 10.1038/nm1011. [DOI] [PMC free article] [PubMed] [Google Scholar]
- 2.Ramanathan C, Jia P, Ghanem RN, et al. Activation and repolarization of the normal human heart under complete physiological conditions. Proc Nat Acad Sci U S A. 2006;103:6309–6314. doi: 10.1073/pnas.0601533103. [DOI] [PMC free article] [PubMed] [Google Scholar]
- 3.Messinger-Rapport BJ, Rudy Y. Non-invasive recovery of epicardial potentials in a realistic heart-torso geometry: normal sinus rhythm. Circ. Res. 1990;66:1023–1039. doi: 10.1161/01.res.66.4.1023. [DOI] [PubMed] [Google Scholar]
- 4.Oster HS, Taccardi B, Lux RL, et al. Electrocardiographic imaging: noninvasive localization of pacing sites simulating ectopic foci. Circulation. 1994;90:1–437. [Google Scholar]
- 5.Oster HS, Taccardi B, Lux RL, et al. Electrocardiographic imaging: noninvasive characterization of intramural myocardial activation from inverse-reconstructed epicardial potentials and electrograms. Circulation. 1998;97:1496–1507. doi: 10.1161/01.cir.97.15.1496. [DOI] [PubMed] [Google Scholar]
- 6.Oster HS, Taccardi B, Lux RL, et al. Noninvasive electrocardiographic imaging: Reconstruction of epicardial potentials, electrograms and isochrones, and localization of single and multiple electrocardiac events. Circulation. 1997;96:1012–1024. doi: 10.1161/01.cir.96.3.1012. [DOI] [PubMed] [Google Scholar]
- 7.Burnes JE, Taccardi B, MacLeod RS, et al. Noninvasive ECG imaging of electrophysiologically abnormal substrates in infarcted hearts: a model study. Circulation. 2000;101:533–540. doi: 10.1161/01.cir.101.5.533. [DOI] [PubMed] [Google Scholar]
- 8.Burnes JE, Taccardi B, Rudy Y. A noninvasive imaging modality for cardiac arrhythmias. Circulation. 2000;102:2152–2158. doi: 10.1161/01.cir.102.17.2152. [DOI] [PMC free article] [PubMed] [Google Scholar]
- 9.Burnes JE, Taccardi B, Ershler PR, et al. Noninvasive electrocardiographic imaging of substrate and intramural ventricular tachycardia in infarcted hearts. J Am Coll Cardiol. 2001;38:2071–2078. doi: 10.1016/s0735-1097(01)01653-9. [DOI] [PMC free article] [PubMed] [Google Scholar]
- 10.Burnes JE, Ghanem RN, Waldo AL et al. Imaging dispersion of myocardial repolarization. I. Comparison of body-surface and epicardial measures. Circulation. 2001;104:1299–1305. doi: 10.1161/hc3601.094276. [DOI] [PubMed] [Google Scholar]
- 11.Ghanem RN, Burnes JE, Waldo AL, et al. Imaging dispersion of myocardial repolarization. II. Noninvasive reconstruction of epicardial measures. Circulation. 2001;104:1306–1312. doi: 10.1161/hc3601.094277. [DOI] [PubMed] [Google Scholar]
- 12.Ghanem RN, Jia P, Ramanathan C, et al. Noninvasive electrocardiographic imaging (ECGI): comparison to intraoperative mapping in patients. Heart Rhythm. 2005;2:339–354. doi: 10.1016/j.hrthm.2004.12.022. [DOI] [PMC free article] [PubMed] [Google Scholar]
- 13.Jia P, Ramanathan C, Ghanem RN, et al. Electrocardiographic imaging of cardiac resynchronization therapy in heart failure: observation of variable electrophysiologic responses. Heart Rhythm. 2006;3:296–310. doi: 10.1016/j.hrthm.2005.11.025. [DOI] [PMC free article] [PubMed] [Google Scholar]
- 14.Ghosh S, Rudy Y. Accuracy of quadratic versus linear interpolation in noninvasive Electrocardiographic imaging (ECGI) Ann. Biomed. Eng. 2005;33:1187–1201. doi: 10.1007/s10439-005-5537-x. [DOI] [PMC free article] [PubMed] [Google Scholar]
- 15.Intini A, Goldstein RN, Jia P, et al. Electrocardiographic imaging (ECGI), a novel diagnostic modality used for mapping of focal left ventricular tachycardia in a young athlete. Heart Rhythm. 2005;2:1250–1252. doi: 10.1016/j.hrthm.2005.08.019. [DOI] [PMC free article] [PubMed] [Google Scholar]
- 16.Wang Y, Cuculich PS, Woodard PK, et al. Focal atrial tachycardia after pulmonary vein isolation: noninvasive mapping with electrocardiographic imaging (ECGI) Heart Rhythm. 2007;4:1081–1084. doi: 10.1016/j.hrthm.2007.04.014. [DOI] [PMC free article] [PubMed] [Google Scholar]
- 17.Wang Y, Schuessler RB, Damiano RJ, et al. Noninvasive Electrocardiographic Imaging (ECGI) of Scar-Related Atypical Atrial Flutter. Heart Rhythm. 2007 doi: 10.1016/j.hrthm.2007.08.019. (in press) [DOI] [PMC free article] [PubMed] [Google Scholar]
- 18.Kawashima Y, Kitamura S, Matsuda H, et al. Total cavopulmonary shunt operation in complex cardiac anomalies: a new operation in complex cardiac anomalies: a new operation. J. Thorac Cardiovasc Surg. 1984;87:74–81. [PubMed] [Google Scholar]
- 19.Uemura H, Yagihara T, Hattori R, et al. Redirection of hepatic venous drainage after total cavopulmonary shint in left isomerism. Ann Thorac Surg. 1999;68:1731–1735. doi: 10.1016/s0003-4975(99)00665-7. [DOI] [PubMed] [Google Scholar]
- 20.Arruda MS, McClelland JH, Wang X, et al. Development and validation of an ECG algorithm for identifying accessory pathway ablation site in Wolff-Parkinson-White syndrome. J Cardiovasc Electrophysiol. 1998;9:2–12. doi: 10.1111/j.1540-8167.1998.tb00861.x. [DOI] [PubMed] [Google Scholar]