

Abstract
Aim
This paper is a discussion detailing the decisions concerning whether to include or exclude findings from a meta-analysis of report of quantitative studies of antiretroviral adherence in HIV-positive women.
Background
Publication constraints and the absence of reflexivity as a criterion for validity in, and reporting of, quantitative research preclude detailing the many judgements made in the course of a meta-analysis. Yet, such an accounting would assist researchers better to address the unique challenges to meta-analysis presented by the bodies of research they have targeted for review, and to show the subjectivity, albeit disciplined, that characterizes the meta-analytic process.
Data sources
Data were 29 published and unpublished studies on antiretroviral adherence in HIV-positive women of any race/ethnicity, class, or nationality living in the United States of America. The studies were retrieved between June 2005 and January 2006 using 40 databases.
Review methods
Findings were included if they met the statistical assumptions of meta-analysis, including: (1) normal distribution of observations; (2) homogeneity of variances; and (3) independence of observations.
Results
Relevant studies and findings were excluded because of issues related to differences in study design, different operationalizations of dependent and independent variables, multiple cuts from common longitudinal data sets, and presentation of unadjusted and adjusted findings. These reasons led to the exclusion of 73% of unadjusted relationships and 87% of adjusted relationships from our data set, leaving few findings to synthesize.
Conclusion
Decisions made during research synthesis studies may result in more information losses than gains, thereby obliging researchers to find ways to preserve findings that are potentially valuable for practice.
Keywords: quantitative approaches, systematic review, meta, analysis, HIV/AIDS, women’s health, health care
Introduction
Although meta-analysis is distinguished from other types of literature reviews by its supposedly greater objectivity and transparency, researchers have long understood the ‘hidden judgements, choices and compromises’ (Nurius & Yeaton 1987) that also define it. Space restrictions in journals and the absence of reflexivity as a criterion for validity in and reporting of quantitative research preclude detailing the many decisions researchers made in the course of a meta-analysis. Yet such an accounting would assist researchers better to address the unique challenges presented by the bodies of research they have targeted for meta-analysis, and to show the subjectivity, albeit disciplined, that characterizes any method to synthesize research findings (Sandelowski et al. 2007).
Accordingly, in this paper, we focus on the decisions concerning whether to include or exclude findings from a meta-analysis of reports of quantitative studies on predictors of antiretroviral adherence in HIV-positive women. Although meta-analysis is commonly considered the preferred method for quantitative research synthesis, meta-analysis may not be possible due to heterogeneity in study design, population, interventions, or other characteristics. Indeed, many literature reviews indicate that meta-analysis was considered but ultimately abandoned due to heterogeneity of study characteristics (e.g. Rueda et al. 2006). However, reviewers do not detail the issues and corresponding decisions that resulted in the exclusion of findings or entire studies from a review, ultimately leading researchers to abandon meta-analysis in favour of other synthesis methods (e.g. vote counting, narrative review).
This article is based on work completed in our ongoing study to develop methods to synthesize qualitative and quantitative research findings in common domains of health-related research. We chose empirical studies of antiretroviral adherence in HIV-positive women of any race/ethnicity, class, or nationality living in the United States of America (USA), with the research question: Which factors were (positively or negatively) associated with medication adherence in HIV-positive women? The studies were retrieved using all major channels of communication (Cooper 1998), most notably, 40 databases housing citations to literature across the health, behavioural and social sciences. Our study thus far includes 42 reports (36 journal articles and 6 unpublished theses or dissertations), which were retrieved between June 2005 and January 2006. Twelve were reports of qualitative studies, one was a mixed method study and 29 were reports of quantitative studies.
In this article, we report our efforts to meta-analyse the findings from the 29 reports of quantitative studies as a prelude to combining these synthesis results with the results of the synthesis of the qualitative findings concerning which factors were associated with medication adherence. (The actual synthesis will appear in another article.) Meta-analysis involves calculating effect sizes – numerical values that reflect the magnitude of the relationship between an independent and dependent variable – and then aggregating them into a single summary value. Meta-analysis requires several statistical assumptions, including: (1) that each study estimate the same parameter, subject to a small amount of random variation, and (2) independence of observations within and across studies (i.e. for each relationship between an independent and dependent variable, no more than one effect size is contributed by a single participant; Berk & Freedman 2003). To meet these assumptions, we had to exclude many relevant studies or relationships within studies. In the remainder of this paper, we track these exclusions by describing the challenges we encountered in managing differences in study design, different operationalizations of dependent and independent variables, multiple cuts from common longitudinal data sets, and presentations of unadjusted and adjusted findings.
Differences in study design
Quantitative meta-analysis has typically been conducted with reports of studies conducted under the same study design. For example, many meta-analyses entail the synthesis of the results of randomized controlled clinical trials (RCTs) evaluating the effect of a treatment/intervention on some outcome. Fewer meta-analyses involve the synthesis of observational studies, and even fewer include both types of studies. Yet, to meet the objectives of our study – to synthesize studies with different designs – no report was excluded because of design. Table 1 profiles the 29 reports of quantitative studies. As shown in Column 2, our data set included 26 reports of observational studies and three reports of RCTs.
Table 1.
Profile of 29 reports of quantitative studies considered for meta-analysis
| Report | Study design* | Dependent variable | Measure of medication adherence† | Recall period | Treatment of adherence in analysis‡ | Definition of adherence in analysis |
|---|---|---|---|---|---|---|
| Douglass et al. (2003) | O | Difficulty taking meds | N/A | |||
| Durante et al. (2003) | O | Adherence | Modification of ACTG Baseline Questionnaire (P) (1) Pill count and (2) Whether missed dose for each of 14 reasons | 3 days | D | (1) 100% of doses and (2) not missed for that reason |
| Erlen et al. (2002) | O | Adherence | Investigator-derived instrument (1) Whether missed a dose in past 24 hours and (yes, no) (2) How many pills were taken on time as scheduled (none; very few; a few; about half; most; nearly all; all) | 24 hours | D | (1) Never missed a dose and (2) ‘nearly all’ or ‘all’ |
| Feigel (2003) | O | Adherence | WIHS questionnaire (P) ‘Was there an unplanned period of time in the last 3 months when you stopped taking all ARV meds for at least one day?’ and ‘Within the past 6 months, how often did you take your ARVs as prescribed?’ (100 of time; 95–99% of time; 75–94% of time; <75% of time) | 3 and 6 months | D | >95% for both questions |
| Garcia-Teague (2002) | O | Adherence | Investigator-derived instrument ‘How often did you take your ARV medications the way the directions tell you, in the last 4 weeks?’ [almost all the time (>95%, more than 19/20 doses); most of the time (80–95%); usually (60–80%); about half the time (40–60%, half the doses); some of the time (20–40%); very little of the time (<20%, one of five doses)] | 1 month | C | |
| Hirokawa (2003) | O | Adherence | Pharmacy records
Percentage of time participants picked up medications |
C | ||
| Howard et al. (2002) | O | Adherence | MEMS cap
Ratio of MEMs openings to number of doses prescribed |
24 hours | C | |
| Ickovics et al. (2002) | O | Adherence | MEMS cap
Ratio of MEMs openings to number of doses prescribed |
24 hours | C | |
| Jones et al. (2003) | RCT | Adherence | Modified ACTG (P)
Percentage of time taking all of ARVs |
7 days | C | |
| Kalichman et al. (2001) | O | Adherence | Investigator-derived instrument Number of missed doses | 7 days | D | Took all doses |
| Laine et al. (2000) | O | Adherence | Medicaid pharmacy records Percentage of prescribed drug coverage from the first until the end of the last prescription in the first postpartum year. Used (1) the number of days covered by a specific type and strength of a drug (from the National Drug Code), assuming the lowest recommended daily dose, and (2) the ‘days supply’ field on the claim. | D | Enough medication to cover 80% of days | |
| Mann (2001) | RCT | Adherence | RAND Medical Outcomes Study (P)
Five items assessing whether participants followed their doctors’ treatment plan over the past month, three items assessing how medications were taken [(none of the time (1) to all of the time (6)] |
1 month | C | |
| Mellins et al. (2002) | O | Adherence | Modified ACTG (P)
Percentage of missed pills |
2 days | D | Took all pills |
| Mellins et al. (2003) | O | Adherence | Modified ACTG (P) Percentage of missed pills | 2 days | D | Took all pills |
| Mostashari et al. (1998) | O | Adherence | Investigator-derived instrument Number of days per week medication was taken, number of missed doses each day | 7 days | D | Took medication ≥ 6 days/week and did not miss any doses per day |
| Murphy et al. (2002) | O | Adherence | Modified ACTG, investigator-derived instruments, pill count (1) Percentage of pills taken yesterday, day before yesterday, and last Saturday; (2) Whether off schedule by more than an hour yesterday, day before yesterday, and last Saturday; (3) Percentage of pills remaining in bottle (pill count); and (4) two items assessing when medication was missed [(within the past week (1) to never skip medications (6)] and how often they took medication within past month [never (1) to all of the time (5)] | 3 days, 7 days–1 month | D | (1, 2 and 3) 95% and (4) missed medication further in the past than within the last week and taken medication ‘all of the time’ in the past month |
| Nguyen (2000) | O | Adherence | Pill count using medical records at correctional facility | C | ||
| Patania (2003) | O | Medication use | N/A | |||
| Phillips et al. (2005) | O | Adherence | Modified ACTG Baseline
Questionnaire List of 14 commonly reported reasons for missing medications; how often missed medication for that reason [never (1) to often (4)] |
Not specified | C, D | Never missed medications |
| Schuman et al. (2001) | O | Adherence | HERS interview
‘In the past 2 weeks, how much of the time did you take your antiretroviral medications as frequently as prescribed?’ ‘always’ (100% of the time), ‘almost always’ (>75% of the time), ‘most’ (50–75% of the time), ‘little’ (25–50% of the time), and ‘rarely/never’ (<25% of the time). |
2 weeks | D | 75% |
| Sharpe et al. (2004) | O | Adherence | SHAS interview
‘How often are you able to take the HIV/AIDS drugs exactly the way your doctor told you to take them?’ (always, usually, sometimes, rarely) |
Not specified | D | Always |
| Sowell et al. (2001a) | O | Intentions to adhere | N/A | |||
| Sowell et al. (1999) | O | Intentions to adhere | N/A | |||
| Sowell et al. (2001b) | O | Intentions to adhere | N/A | |||
| Stone et al. (2001) | O | Adherence | HERS adherence instrument
Any doses skipped the previous day and in the previous 3 days |
3 days | D | Took all doses |
| Turner et al. (2000) | O | Adherence | Medicaid pharmacy records
Percentage of prescribed drug coverage from the first until the end of the last prescription in the first postpartum year. Used (1) the number of days covered by a specific type and strength of a drug (from the National Drug Code), assuming the lowest recommended daily dose, and (2) the ‘days supply’ field on the claim. |
D | 80% | |
| Wilson et al. (2002) | O | Adherence | WIHS questionnaire (P)
How often participants took medications as prescribed |
6 months | D | 95% |
| Wilson et al. (2001) | O | Adherence | Pill count based on ACTG
Ratio of pills remaining to pills prescribed |
4 days | D | Took all doses |
| Wyatt et al. (2004) | RCT | Adherence | Investigator-derived instrument How many days they had taken their HIV medication exactly as prescribed (on schedule and the correct dose) | 2 weeks | D | Took medication exactly as prescribed everyday |
O = observational; RCT = randomized controlled trial.
P = only a portion of the instrument was used; N/A = not available; ACTG= Aids Clinical Trial Group; HERS = HIV Epidemiology Research Study; MEMS = Medication Event Monitoring System; SHAS = Supplement to HIV and AIDS Surveillance; WIHS = Women’s Interagency Health Study.
C = adherence was treated as continuous variable; D = adherence was treated as dichotomous variable.
Control
One relevant dimension of study design is control: whether it is obtained statistically (as in an observational study) or by manipulation (as in an experimental study). The distinction is relevant to research synthesis in that each type of study has different research goals, which in turn drive sampling, measurement and analysis. Despite differences in research goals, some reports of RCTs present findings similar to findings in reports of observational studies: relationships between adherence and independent variables other than the intervention. This raises the question of which factors are important in deciding whether to combine findings from the two types of studies in meta-analysis.
The first issue concerns the similarity of individuals who participate in observational studies and RCTs. A commonplace argument is that individuals who participate in RCTs differ from those who do not (e.g. in access to health care, health status or motivation for study participation; Gurwitz et al. 1992). Although we cannot know the extent to which women who participated in the observational and RCT studies in our data set differed from the population of women with HIV, we do know the extent to which women who participated in the two types of studies were similar. We compared demographic profiles on variables such as race/ethnicity, age, marital status, education, parity, substance use, and physical or sexual abuse and determined that women in the observational studies were similar to the women in the RCTs. Moreover, the recruitment strategy (in all studies, non-probability sampling using convenience samples) and inclusion criteria for the two types of studies were similar. Therefore, we reasoned that the populations were similar enough not to preclude the synthesis of findings from both kinds of studies.
Another issue is whether similar types of variables are assessed. Whereas observational studies typically examine relationships between several predictors and adherence for all participants, RCTs typically examine the relationship between an intervention and adherence. Accordingly, in reports featuring findings of an RCT, the relationship between other predictors and adherence may be omitted or may be presented separately for the treatment and control conditions. We reasoned that to make findings from RCTs comparable to findings from observational studies, the relationship between adherence and predictors must be collapsed across all participants (i.e. not by condition). We also reasoned that only baseline findings could be combined. This is because interventions are designed to increase adherence, and, therefore, the relationship between predictors and adherence may be attenuated (in the case of barriers) or augmented (in the case of facilitators) by the intervention. Follow-up results from an RCT would, therefore, be incomparable and, thus, uncombinable with findings from observational studies. Applying this logic to our sample of 29 studies resulted in the exclusion of one report of an RCT (Wyatt et al. 2004) from the meta-analysis, as shown in Figure 1.
Figure 1.
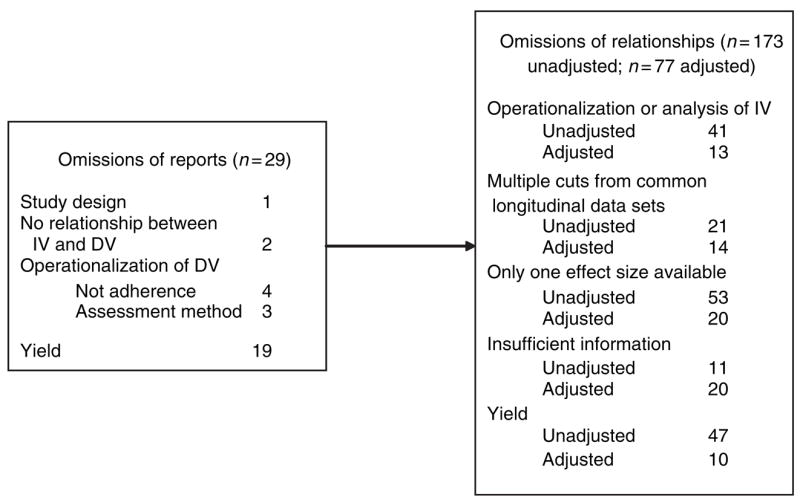
Tracking reasons for excluding reports and relationships from metaanalysis.
Time
Another relevant dimension of study design is time: whether assessments of adherence and predictors were simultaneous or lagged, and whether assessments occurred only once or more than once. Of the 28 reports remaining in our review, six presented findings from more than one time point. Of these six, two were reports of RCTs and, therefore, we could use only baseline results (Mann 2001, Jones et al. 2003); two presented results averaged across all time points (Turner et al. 2000, Hirokawa 2003); and two presented results from more than one time period (Ickovics et al. 2002, Mellins et al. 2003). The Ickovics et al. report was mostly descriptive; the only inferential statistics for time compared average adherence for the 3 weeks prior to giving birth to average adherence for the 3 weeks after giving birth. In the Mellins et al. report, findings were presented for two follow-up assessments: The first assessment occurred 4–5 months after baseline, and the second occurred 8–18 months after the first follow-up. This case violates the assumption of statistical non-independence. Various strategies exist for such situations (Lipsey 1994). Because findings from the first follow-up were closest in time to simultaneous assessments, from which the majority of effect sizes in our meta-analysis were obtained, we considered only including findings from the first follow-up in the meta-analysis. Important to consider is whether effect sizes are of similar magnitude at different time points. We compared effect sizes from the latter report to those from other reports to ensure that they were similar in magnitude. If they had not been, we would have excluded this report because our data set did not contain a large enough sample of studies with varying follow-up periods to examine the moderating effect of time of follow-up.
Different operationalizations of key variables
One issue common to any research synthesis is that key dependent and independent variables are rarely operationalized the same way across studies. Studies are typically conducted under different definitions of constructs, different methods and measures to assess them, or different cutoffs for categorizing scores. These variations have implications for whether and how effect sizes can be calculated and, therefore, whether these findings can be combined.
Dependent variable considerations
Our first step was to define the dependent variable. Although we searched for and retrieved reports on medication adherence, not all reports presented relationships between adherence and one or more independent variable. For example, as shown in Column 3 of Table 1, four reports featured findings with other dependent variables, including beliefs or intentions to adhere (Sowell et al. 1999, 2001a,Sowell et al. b) and difficulty taking medications (Douglass et al. 2003), and two reports presented only descriptive statistics for adherence (Nguyen 2000, Patania 2003). As shown in Figure 1, this resulted in the exclusion of six reports.
In the 22 remaining reports, operationalization of medication adherence was particularly challenging. Although medication adherence was generally conceived as the extent to which women took their medication as prescribed, researchers defined it in various ways, such as the number or percentage of prescriptions filled at the pharmacy or the percentage of pills taken, as shown in Column 3 of Table 1. In addition, medication adherence was variously assessed, as shown in Column 4: by self-report, electronic detection system, pill count, or by pharmacy records. For this analysis, we defined medication adherence as the amount or percentage of medication consumed, as assessed by self-report, electronic detection system, or pill count. We omitted three reports of studies that involved the use of pharmacy records to determine whether women had enough drug coverage for the time period assessed, as there is no evidence that women actually received or took the drugs (Laine et al. 2000, Turner et al. 2000, Hirokawa 2003).
The 19 remaining reports presented at least one unadjusted (bivariate) or adjusted (multivariable) relationship between adherence and at least one independent variable and, therefore, could be considered for meta-analysis. Yet, in one study (Murphy et al. 2002), four different definitions of medication adherence were used: (1) self-reported dosing adherence over the past 3 days; (2) self-reported schedule adherence over the past 3 days; (3) adjusted pill count over the past 3 days; and (4) self-reported dosing over the past week/month. In order to avoid violating the assumption of statistical independence, we selected one definition, resulting in the exclusion of 45 unadjusted relationships (15 independent variables × dependent variables; not shown in Figure 1).
Also evident in the remaining 19 reports were differences in the way adherence was measured. As shown in Column 4 of Table 1, several measures were used. Even when the same measure was used, different portions of it constituted the measurement tool for the study. For example, the AIDS Clinical Trials Group questionnaire (Chesney et al. 2000) was used in six studies; yet, in one of these studies, only the question about reasons for missed doses was used (Phillips et al. 2005), whereas in another study, only the question about the number of missed pills was used (Mellins et al. 2002). Additionally, as shown in Column 5, measures assessed adherence over different time periods, ranging from 24 hours to 6 months, with some measures not specifying a time period at all. This is a typical challenge in meta-analysis; researchers rarely operationalize the dependent variable in the same way or use the same measures to assess it. Excluding on the basis of this difference would mean that few findings would ever be available to synthesize. Yet if a sizable relationship exists between the independent and dependent variables, no matter how the dependent variable was assessed, reviewers can be more confident about its validity.
Another challenge was differences in how the dependent variables were treated in the analyses reported. As shown in Column 6 of Table 1, in some studies, medication adherence was treated as a continuous variable, and in others, it was dichotomized (presumably) according to a clinically relevant criterion. Yet, even what constitutes a clinically relevant criterion was inconsistent across studies. For example, as shown in Column 7, in the majority of studies, a 95% adherence level was used, which is generally accepted as the level below which drug resistance starts to develop (Paterson et al. 2000). In other studies (Laine et al. 2000, Turner et al. 2000, Schuman et al. 2001, Jones et al. 2003), values such as 80% were used, which are more common for other chronic diseases such as hypertension. Further complicating matters is that adherence was coded differently (1 vs. 0) across studies reporting logistic regression. To make the findings comparable and, thus, combinable, we had to invert odds ratios in five studies so that every relationship was coded in the same direction (Stone et al. 2001, Wilson et al. 2001, 2002, Mellins et al. 2002, 2003).
How adherence is treated in an analysis will affect the choice of effect size index to use. Separate indexes exist for continuous and dichotomous outcomes. For continuous outcomes, common effect size indexes include Pearson’s r and various forms of the difference between means (e.g. Hedge’s g, Cohen’s d, Glass’ delta). For dichotomous outcomes, common effect size indexes include relative risk or odds ratio. To put continuous and dichotomous data into the same metric, standardized means may be converted to odds ratios or vice versa. We chose Cohen’s d because adherence was assessed as a continuous variable, even if analysed as a dichotomous variable.
Independent variable considerations
Operationalizations of independent variables presented challenges as well. The first challenge was that variables were conceptualized differently across studies. For example, the construct knowledge was conceptualized as being aware of one’s latest CD4 and viral load counts (Durante et al. 2003) and correct understanding of dosing frequency and food dosing restrictions (Stone et al. 2001). Social support was also variously conceptualized across studies as: living with other HIV-positive people (Durante et al. 2003); indicating that a spouse, partner or child is the first or second most supportive person (Murphy et al. 2002); feeling that one’s HIV doctor always listens or understands (Mostashari et al. 1998); and a composite of items from the MOS HIV social support subscale (Garcia-Teague 2002). Even when a construct was conceptualized similarly across studies, different instruments were used to assess it. For example, depression was assessed with the Center for Epidemiological Studies Depression Scale (Kalichman et al. 2001, Schuman et al. 2001, Stone et al. 2001, Feigel 2003, Phillips et al. 2005) and the Hospital Anxiety and Depression Scale (Garcia-Teague 2002). In deciding which relationships to include in the meta-analysis, we reasoned that variables conceptualized differently (e.g. knowledge) could not be included because they were topically incomparable, but that variables conceptualized similarly but assessed with different instruments (e.g. depression) could be included.
Studies also differed in their analyses of independent variables. Five variables – age, depression, education, CD4 count and viral load – were treated as continuous variables in some studies and as categorical variables in others. Moreover, the values for categorizing variables differed across studies. For example, in three studies, viral load was categorized as detectable vs. undetectable (Kalichman et al. 2001, Schuman et al. 2001, Wilson et al. 2002). In other studies, viral load was treated as two categories (<5000 vs. 5000 or more; Murphy et al. 2002); four categories (<1000; 1000–10,000; 10,000–100,000; and 100,000 or more; Stone et al. 2001); and as a mean score (Garcia-Teague 2002). Although dependent variables measured on different scales can be transformed into a common metric, independent variables cannot. Therefore, we had to decide whether to use the continuous or categorical treatments of these variables.
An important issue to consider is whether categorizations are similar enough that findings can be combined statistically. For example, some investigators trichotomized CD4 count (Stone et al. 2001, Howard et al. 2002, Wilson et al. 2002), whereas others dichotomized it (Mostashari et al. 1998, Kalichman et al. 2001, Schuman et al. 2001, Murphy et al. 2002). Although we could not perform calculations to make different dichotomies comparable to each other, whenever we could obtain frequencies, we could combine multiple categories to create a new dichotomous variable. For example, in studies in which CD4 count was represented as <200, 200–500 and >500, we could combine frequencies for 200–500 and >500 to yield <200 vs. ≥200. In other cases, however, we would have to exclude effect sizes based on substantially different categorizations. For instance, for viral load, we could not combine undetectable vs. detectable with (1) 5000 vs. 5000 or more or (2) < 1000; 1000–10,000; 10,000– 100,000; and 100,000 or more, because (1) and (2) are not clinically similar to detectable vs. undetectable load.
After making findings homogeneous enough to be statistically combined, we considered other goals, such as preserving the largest number of findings. For example, we examined which treatment of variables – categorical or dichotomous – resulted in the exclusion of fewer relationships. For age, the mean was used more often, but for depression, education, CD4 count and viral load, categories were used more often. If we were to preserve the maximum number of relationships, we would have to exclude relationships based on categorical treatment of age and continuous treatment of the other four variables. In summary, because of the different ways that independent variables were operationalized or treated in reported analyses, 13 adjusted and 41 unadjusted relationships could not be included in the metaanalysis, as shown in Figure 1.
Multiple cuts from common longitudinal data sets
One notable characteristic of the reports we reviewed is that they include findings from large, well-known longitudinal studies. The most common were the Women’s Interagency Health Study (WIHS) and the HIV Epidemiology Research Study (HERS), two ongoing longitudinal cohort studies that assess the physical and psychological effects of HIV infection as women experience them in everyday life. Various investigators have used different cuts from the larger data set to examine different research questions. For example, using HERS data, Stone et al. (2001) examined the cross-sectional relationship between adherence and regimen complexity and correct understanding of dosing instructions, whereas Howard et al. (2002) examined the longitudinal relationship between adherence and various predictors. Taking different cuts of data from the same data set presents challenges for synthesizing findings. Unique variables from the same data set can be incorporated readily into the meta-analysis. Yet, variables from the same data set pose the problem of statistical non-independence because they were obtained from some, if not all, of the same participants. Indeed, we could not discern from published reports from the same cohort study how many of the same participants were included in each report, in part, because of the different sample sizes used for the analyses.
Of the 19 remaining reports, nine presented data from a large longitudinal data set, producing four instances of overlapping samples, shown in Table 2: (1) two sets of three reports, including Schuman et al. (2001), Howard et al. (2002), and Stone et al. (2001); and Schuman et al. (2001), Feigel (2003), and Wilson et al. (2002); and (2) two sets of two reports, including Mellins et al. (2002, 2003); and Ickovics et al. (2002) and Wilson et al. (2001). As meta-analysis requires independence of observations, we had to decide which findings from these nine reports could be included. One possibility is to give preference to peerreviewed, published reports as opposed to theses, dissertations or non-peer-reviewed reports. The reasoning behind this solution is that the studies featured in published reports are presumed to be of higher quality than those featured in unpublished reports and, therefore, the findings might be more valid. Yet the publication bias (e.g. towards reports with significant findings) undermines this potential advantage (Cooper 1998). Another possibility is to give preference to reports published most recently, as errors in calculation of variables would have been detected and corrected. Yet another possibility is to consider whether the findings reported are from the entire study population or a subsample.
Table 2.
Variables included in reports from common longitudinal data sets
| Schuman et al. (2001) (WIHS and HERS) | Stone et al. (2001) (HERS) | Howard et al. (2002) (HERS) |
|---|---|---|
| Race | Race | Race |
| Education | Education | Education |
| Illicit drug use | Illicit drug use | Illicit drug use |
| CD4 count | CD4 count | CD4 count |
| Depression | Depression | |
| Viral load | Viral load | |
| Regimen type | Regimen type | Regimen type |
| Age | Age | |
| Employment | Employment | |
| Side effects | Side effects | |
| Health insurance coverage | ||
| Methadone maintenance | ||
| Homelessness | ||
| Regular site for health care | ||
| Forgetting | ||
| Number of pills in regimen | Number of pills in regimen | |
| Dosing frequency | Dosing frequency | |
| Mode of HIV transmission | ||
| Dosing complexity | ||
| Knowledge | ||
| Live with children | ||
| Alcohol use | ||
| Time receiving ART | ||
| Daily number of pills | ||
| Schuman et al. (2001) (WIHS and HERS) | Feigel (2003) (WIHS) | Wilson et al. (2002) (WIHS) |
|
| ||
| Race | Race | |
| Education | Education | |
| Illicit drug use | Illicit drug use | |
| CD4 count | CD4 count | |
| Depression | ||
| Viral load | ||
| Regimen type | Viral load | |
| Age | Regimen type | |
| Employment | Age | |
| Side effects | Employment | |
| Health insurance coverage | ||
| Methadone maintenance | ||
| Homelessness | ||
| Regular site for health care | ||
| Forgetting | ||
| Anxiety | ||
| Depression | ||
| Optimism | ||
| Negative growth resulting from HIV | ||
| Parenthood | ||
| Inconsistent condom use | ||
| Partner HIV status | ||
| Time receiving ART | ||
| AIDS-defining illness | ||
| Detectable viral load 6 months later | ||
| CD4 count 6 months later | ||
| Alcohol use | ||
| Current health perceptions | ||
| Physical functioning | ||
| Pain levels | ||
| Energy or fatigue | ||
| Emotional well-being | ||
| Cognitive functioning or distress | ||
| Social functioning | ||
| Role functioning | ||
| Number of male sexual partners | ||
| Ickovics et al. (2002) | Wilson et al. (2001) | |
|
| ||
| Prenatal vs. postnatal period | ||
| Dosing frequency | ||
| Race | ||
| Study site | ||
| Regimen type | ||
| Child with HIV | ||
| Medicaid recipient | ||
| Illicit drug use | ||
| Alcohol use | ||
| HIV diagnosis | ||
| Trimester care began | ||
| Took all prenatal vitamins | ||
| Missed prenatal appointments | ||
| Concerns about zidovudine | ||
| Age | ||
| Depression | ||
| Mellins et al. (2002) | Mellins et al. (2003) | |
|
| ||
| Psychiatric diagnosis | Psychiatric diagnosis | |
| Substance abuse diagnosis | Substance abuse diagnosis | |
| Demoralization | Demoralization | |
| Education | Education | |
| Disclosure to family | Disclosure to family | |
| Age | Age | |
| Time since diagnosis | Time since diagnosis | |
| Income | Income | |
| Number of people in the home | Number of people in the home | |
| Race | Race | |
| Parenting stress | Parenting stress | |
| CD4 count | CD4 count | |
| Viral load | Viral load | |
| Child’s HIV status | ||
| Number of pills taken per day | ||
| Regimen type | ||
| Having a partner | ||
| Employment | ||
| Negative stress | ||
| Marital status | ||
| Self-efficacy | ||
None of these solutions could be applied across the board for our four instances of overlapping samples, compelling us to make case-by-case decisions. In the two sets of three reports, two of the three reports used HERS data (Stone et al. 2001, Howard et al. 2002) or WIHS data (Wilson et al. 2002, Feigel 2003), and the third report used both HERS and WIHS data (Schuman et al. 2001). In deciding between the two reports of HERS data, we chose the more recently published report because there was no other obvious distinction (Stone et al. 2001, Howard et al. 2002). In the case of the two reports of WIHS data, each focused on the analysis of different variables, so we were able to consider for inclusion all relationships (Wilson et al. 2002, Feigel 2003). For the report that used both HERS and WIHS data, we considered only those variables that were not presented in any of the other reports from HERS or WIHS (i.e. homelessness, methadone maintenance, regular site for healthcare and health insurance coverage; Schuman et al. 2001). In the third instance of overlapping samples, the two reports assessed unique variables, so we were able to consider all relationships (Wilson et al. 2001, Ickovics et al. 2002). In the fourth instance, we chose the more recently published report because there was no other obvious distinction (Mellins et al. 2002, 2003). Excluding non-independent relationships from the four instances of overlapping samples, we lost 14 adjusted and 21 unadjusted relationships from the meta-analysis, as shown in Figure 1. We encountered a fifth instance of overlapping samples in which one report included analyses for a subsample of women characterized as ‘long-term adherers’ (Turner et al. 2000), whereas the other report included analyses with all women (Laine et al. 2000). These reports were already excluded from the metaanalysis because pharmacy data were used to measure adherence. Had we decided to include these two reports, we would have included the findings from all women in order to maximize comparability with other studies in our sample.
Presentation of findings: unadjusted vs. adjusted relationships
Another difference we encountered in the 19 reports remaining is that in eight of them, authors presented only unadjusted relationships, in two, only adjusted relationships (e.g. a regression model that includes 10 independent variables entered simultaneously), and in nine, both kinds of relationships. Unadjusted results were reported as means or proportions (for adherence operationalized as continuous vs. dichotomous), for which authors calculated t-tests, chisquares, or a non-parametric version of these tests (i.e. Wilcoxon or Kruskal–Wallis). Adjusted results were obtained from multivariable logistic or linear regression models. Multivariable models may be created by different methods; investigators may choose independent variables they believe may be associated with adherence a priori, based on expert opinion or previous literature, or they may use a statistical model selection technique. In the reports we reviewed, the method of choice was backward elimination; all variables were entered into a model simultaneously and, step-by-step, the least significant variable was eliminated until all remaining variables were statistically significant. A potential limitation to using model reduction techniques is that the effect size for excluded variables cannot be quantified, leaving open the question of the population effect size. A variable may have had a non-zero effect size, but may have been omitted from the final model because it failed to achieve statistical significance (P < 0.05) due to low power. Yet, this situation is not different from the situation in which a researcher chose not to measure a variable at all; in either case, the population effect size may be underestimated or overestimated.
Because both unadjusted and adjusted results were presented, we had to decide which results could be included in a meta-analysis. Multivariable models are a source of difference, as each model has a different set of independent variables, creating different partial relationships. Because combining statistics that do not estimate the same parameter is unreasonable, researchers usually meta-analyse only unadjusted relationships (Becker & Schram 1994). Although this is sensible from a statistical standpoint, important information may be gleaned by comparing a synthesis obtained from unadjusted findings to a synthesis obtained from adjusted findings. Variables consistently (and, perhaps, strongly) associated with the outcome, no matter how many or which other variables are statistically controlled, may be particularly important to address in research-based clinical interventions. Therefore, it may be reasonable to perform separate meta-analyses with unadjusted and adjusted findings and highlight areas of convergence and divergence.
Final considerations
After excluding relationships for the reasons detailed above, some independent variables were the only one of their kind remaining. Additionally, some independent variables were only assessed in one study (e.g. physical well-being; Garcia-Teague 2002). By definition, a single relationship cannot be meta-analysed. As shown in Figure 1, these reasons resulted in the exclusion of 20 adjusted and 53 unadjusted relationships from the meta-analysis.
A final issue is that, ultimately, some relationships could not be included in the meta-analysis because we had insufficient information for calculating effect sizes. In some reports, nonsignificant results were noted only as ‘non-significant’, with no accompanying statistical values, degrees of freedom or significance values. In other reports, only P-values were reported, but we could not discern the direction of the relationship. In yet other reports, authors reported the mean value of an independent variable for each level of the dependent variable (e.g. mean age for adherent and non-adherent women), preventing us from calculating the effect size (e.g. Wilson et al. 2002). In all cases, we attempted to contact primary authors, but we were not always able to obtain the requested information. As a result of insufficient information for calculating effect sizes, we lost 20 adjusted and 11 unadjusted relationships.
What was left to synthesize?
The methodological considerations detailed above led to the exclusion of 73% of unadjusted relationships and 87% of adjusted relationships from our data set. Table 3 shows the results of the meta-analysis of unadjusted relationships, which was conducted using a random effects model. (The meta-analysis of adjusted relationships resulted in pooled effect sizes for only three variables – drug use, age, CD4 count – each with three to six effect sizes.) Of the 16 independent variables shown in Table 3, only three were statistically significant, as indicated by the pZ column. Greater medication adherence was associated with fewer doses per day and higher CD4 cell count, whereas less medication adherence was associated with drug use.
Table 3.
Meta-analysis of unadjusted relationships
| k | d | 95% CI | Z | pZ | Q | pQ | |
|---|---|---|---|---|---|---|---|
| Variables associated with greater medication adherence | |||||||
| Two or fewer vs. three or more doses per day | 2 | 0.51 | 0.20–0.82 | 3.24 | 0.00 | 0.04 | 0.84 |
| Higher vs. lower CD4 cell count | 5 | 0.45 | 0.10–0.79 | 2.56 | 0.01 | 11.46 | 0.02 |
| Employment | 2 | 0.39 | −0.09–0.87 | 1.60 | 0.11 | 4.64 | 0.03 |
| Detectable vs. undetectable viral load | 2 | 0.30 | −0.10–0.69 | 1.48 | 0.14 | 1.64 | 0.20 |
| At least one child | 2 | 0.30 | −0.22–0.83 | 1.12 | 0.26 | 1.02 | 0.31 |
| Optimism | 2 | 0.16 | −0.33–0.65 | 0.64 | 0.52 | 2.51 | 0.11 |
| Anxiety | 2 | 0.10 | −0.01–0.21 | 1.74 | 0.08 | 0.46 | 0.50 |
| Black vs. Latina race | 2 | 0.09 | −0.34–0.52 | 0.42 | 0.67 | 3.33 | 0.07 |
| More vs. less education | 5 | 0.08 | −0.07–0.22 | 1.03 | 0.30 | 1.56 | 0.82 |
| Age | 4 | 0.07 | −0.10–0.24 | 0.83 | 0.41 | 4.51 | 0.21 |
| Variables associated with less medication adherence | |||||||
| Drug use | 5 | −0.52 | −0.66 to −0.38 | −7.12 | 0.00 | 1.86 | 0.76 |
| Depression | 3 | −0.37 | −0.77–0.03 | −1.80 | 0.07 | 6.60 | 0.04 |
| Alcohol use | 4 | −0.26 | −0.58–0.07 | −1.54 | 0.12 | 5.11 | 0.16 |
| Black vs. White race | 2 | −0.20 | −0.42–0.02 | −1.79 | 0.07 | 0.25 | 0.62 |
| HAART vs. non-HAART regimen | 3 | −0.15 | −0.32–0.01 | −1.80 | 0.07 | 1.85 | 0.40 |
| Latina vs. White race | 2 | −0.02 | −0.28–0.24 | −0.18 | 0.86 | 0.57 | 0.45 |
Findings are ranked from highest to lowest effect size (d). k = number of relationships; d = standardized difference between means; CI = confidence interval; Z = tests whether d is significantly different from zero; Q = tests presence of heterogeneity.
Several caveats should be kept in mind when interpreting these results. One is that meta-analyses of findings from observational studies may produce spurious results, and, therefore, causal inferences should not be drawn (Egger et al. 1998). For example, is low CD4 count an antecedent or outcome of poor adherence, or is some third variable related to both? Because meta-analyses of observational findings can produce spurious results and explanations for those results, Egger et al. recommended examining sources of heterogeneity (i.e. reasons for variation between studies). However, with only two to five effect sizes contributing to each pooled effect size, it is unlikely that we could identify important sources of heterogeneity (e.g. study or population characteristics). Moreover, publication bias may be present, but it is difficult to discern which study is aberrant when the number of findings (k) is small. Another limitation is that with a small k, we cannot know the accuracy of the population effect size and cannot generalize to the larger population of studies, which is a goal of random effects models (Raudenbush 1994). A final limitation is that the meta-analysis does not allow us to draw conclusions about the relationship between adherence and the majority of variables investigated in the studies. Thus, relatively little is gained from this mode of synthesis in terms of informing clinical practice or theory about adherence.
Conclusion
In this paper, we have empirically demonstrated the extent to which the decision-making process to include or exclude relevant reports or findings from reports is a judgemental process driven by reviewers’ purposes and the unique profile of the body of research selected for review. Reports or findings allowed in because they ostensibly address a research question may, nevertheless, be out because they are not amenable to the kind of analysis reviewers want to conduct, because they are too unique to be compared or combined, or because no common metric can be found to allow ostensibly comparable findings to be combined. In sum, decisions made during research synthesis studies may result in more information losses than gains and, thereby, oblige researchers to find ways to preserve findings that are potentially valuable for practice.
What is already known about this topic
Meta-analysis is the gold standard for quantitative synthesis.
Many bodies of literature cannot be meta-analysed due to heterogeneity of study characteristics.
What this paper adds
An examination of the issues that reviewers must consider but which typically are omitted from reports of meta-analyses.
Adetailed account of the decisions to include and exclude findings and entire reports from a meta-analysis.
Acknowledgments
The study featured here, entitled Integrating qualitative & quantitative research findings, is funded by the National Institute of Nursing Research, National Institutes of Health, 5R01NR004907, 3 June 2005–31 March 2010. We also acknowledge Career Development Award # MRP 04-216-1 granted to the first author from the Health Services Research and Development Service of the Department of Veterans Affairs. The views in this paper are those of the authors and do not necessarily represent the views of the Department of Veterans Affairs.
Footnotes
Author contributions
CIV, JB and MS were responsible for the study conception and design and CIV, JB, VH and MS were responsible for the drafting of the manuscript. CIV, JB and MS performed the data collection and CIV, JB, VH and MS performed the data analysis. CIV, JB and MS obtained funding. CIV, JB, VH and MS made critical revisions to the paper. CIV and VH provided statistical expertise. MS supervised the study.
Contributor Information
Corrine I. Voils, Center for Health Services Research in Primary Care, Veterans Affairs Medical Center and Department of Medicine, Duke University Medical Center, Durham, North Carolina, USA.
Julie Barroso, Adult Nurse Practitioner Program, School of Nursing, Duke University, Durham, North Carolina, USA.
Victor Hasselblad, Duke University Medical Center, Durham, North Carolina, USA.
Margarete Sandelowski, Director of Annual Summer Institutes in Qualitative Research, School of Nursing, University of North Carolina at Chapel Hill, Chapel Hill, North Carolina, USA.
References
- Becker BJ, Schram CM. Examining explanatory models throughout research synthesis. In: Cooper H, Hedges LV, editors. The Handbook of Research Synthesis. Russell Sage Foundation; New York: 1994. pp. 357–381. [Google Scholar]
- Berk RA, Freedman DA. Statistical assumptions as empirical commitments. In: Blomberg TG, Cohen S, editors. Law, Punishment, and Social Control: Essays in Honor of Sheldon Messinger. Aldine de Gruyter; Hawthorne, NY: 2003. pp. 235–254. [Google Scholar]
- Chesney MA, Ickovics JR, Chambers DB, Gifford AL, Neidig J, Zwickl B, Wu AW. Self-reported adherence to antiretroviral medications among participants in HIV clinical trials: the AACTG adherence instruments. AIDS Care. 2000;12:255–266. doi: 10.1080/09540120050042891. [DOI] [PubMed] [Google Scholar]
- Cooper H. Synthesizing Research: A Guide for Literature Reviews. Sage; Thousand Oaks, CA: 1998. [Google Scholar]
- Douglass JL, Sowell RL, Phillips KD. Using Peplau’s theory to examine the psychosocial factors associated with HIV-infected women’s difficulty in taking their medications. The Journal of Theory Construction & Testing. 2003;7:10–17. [Google Scholar]
- Durante AJ, Bova CA, Fennie KP, Danvers KA, Holness DR, Burgess JD, Williams AB. Home-based study of anti- HIV drug regimen adherence among HIV-infected women: feasibility and preliminary results. AIDS Care. 2003;15:103–115. doi: 10.1080/0954012021000039806. [DOI] [PubMed] [Google Scholar]
- Egger M, Schneider M, Smith GD. Spurious precision? Meta-analysis of observational studies. British Medical Journal. 1998;316:140–144. doi: 10.1136/bmj.316.7125.140. [DOI] [PMC free article] [PubMed] [Google Scholar]
- Erlen JA, Sereika SM, Cook RL, Hunt SC. Adherence to antiretroviral therapy among women with HIV infection. Journal of Obstetric, Gynecologic, and Neonatal Nursing. 2002;31:470–477. doi: 10.1111/j.1552-6909.2002.tb00070.x. [DOI] [PubMed] [Google Scholar]
- Feigel CA. Unpublished thesis. University of Southern California; 2003. Stress, coping, and medication adherence among HIV infected mothers. [Google Scholar]
- Garcia-Teague LA. Unpublished thesis. University of California; Los Angeles: 2002. Factors associated with appointment and medication adherence in low income Latinas living with the human immunodeficiency virus. [Google Scholar]
- Gurwitz JH, Col NF, Avorn J. The exclusion of the elderly and women from clinical trials in acute myocardial infarction. Journal of American Medical Association. 1992;268:1417–1422. [PubMed] [Google Scholar]
- Hirokawa D. Unpublished thesis. University of Nevada; 2003. Women, HIV/AIDS, and Poverty: An Examination of the Efficacy of an AIDS Drug Assistance Program in the State of Nevada. [Google Scholar]
- Howard AA, Arnsten JH, Lo Y, Vlahov D, Rich JD, Schuman P, Stone VE, Smith DK, Schoenbaum EE. A prospective study of adherence and viral load in a large multi-center cohort of HIV-infected women. AIDS. 2002;16:2175–2182. doi: 10.1097/00002030-200211080-00010. [DOI] [PubMed] [Google Scholar]
- Ickovics JR, Wilson TE, Royce RA, Minkoff HL, Fernandez MI, Fox-Tierney R, Koenig LJ. Prenatal and postpartum zidovudine adherence among pregnant women with HIV: results of a MEMS substudy from the Perinatal Guidelines Evaluation Project. Journal of Acquired Immune Deficiency Syndromes. 2002;30:311–315. doi: 10.1097/00126334-200207010-00007. [DOI] [PubMed] [Google Scholar]
- Jones DL, Ishii M, LaPerriere A, Stanley H, Antoni M, Ironson G, Schneiderman N, Van Splunteren F, Cassells A, Alexander K, Gousse YP, Vaughn A, Brondolo E, Tobin JN, Weiss SM. Influencing medication adherence among women with AIDS. AIDS Care. 2003;15:463–474. doi: 10.1080/0954012031000134700. [DOI] [PubMed] [Google Scholar]
- Kalichman SC, Rompa D, DiFonzo K, Simpson D, Austin J, Luke W, Kyomugisha F, Buckles J. HIV treatment adherence in women living with HIV/AIDS: research based on the Information- Motivation-Behavioral Skills model of health behavior. Journal of the Association of Nurses in AIDS Care. 2001;12:58–67. doi: 10.1016/S1055-3290(06)60217-3. [DOI] [PubMed] [Google Scholar]
- Laine C, Newschaffer CJ, Zhang D, Cosler L, Hauck WW, Turner BJ. Adherence to antiretroviral therapy by pregnant women infected with human immunodeficiency virus: a pharmacy claims-based analysis. Obstetrics and Gynecology. 2000;95:167–173. doi: 10.1016/s0029-7844(99)00523-2. [DOI] [PubMed] [Google Scholar]
- Lipsey MW. Identifying potentially interesting variables and analysis opportunities. In: Cooper H, Hedges LV, editors. The Handbook of Research Synthesis. Russell Sage Foundation; New York: 1994. pp. 111–123. [Google Scholar]
- Mann T. Effects of future writing and optimism on health behaviors in HIV-infected women. Annals of Behavioral Medicine. 2001;23:26–33. doi: 10.1207/S15324796ABM2301_5. [DOI] [PubMed] [Google Scholar]
- Mellins CA, Havens JF, McCaskill EO, Leu CS, Brudney K, Chesney MA. Mental health, substance use and disclosure are significantly associated with the medical treatment adherence of HIV-infected mothers. Psychology, Health, & Medicine. 2002;7:451–460. [Google Scholar]
- Mellins CA, Kang E, Leu CS, Havens JF, Chesney MA. Longitudinal study of mental health and psychosocial predictors of medical treatment adherence in mothers living with HIV disease. AIDS Patient Care and STDS. 2003;17:407–416. doi: 10.1089/108729103322277420. [DOI] [PubMed] [Google Scholar]
- Mostashari F, Riley E, Selwyn PA, Altice FL. Acceptance and adherence with antiretroviral therapy among HIV-infected women in a correctional facility. Journal of Acquired Immune Deficiency Syndromes and Human Retrovirology. 1998;18:341–348. doi: 10.1097/00042560-199808010-00005. [DOI] [PubMed] [Google Scholar]
- Murphy DA, Greenwell L, Hoffman D. Factors associated with antiretroviral adherence among HIV-infected women with children. Women & Health. 2002;36:97–111. doi: 10.1300/J013v36n01_07. [DOI] [PubMed] [Google Scholar]
- Nguyen PV. Unpublished thesis. University of Texas; 2000. Ensuring drug compliance in HIV+ female offenders in a correctional facility. [Google Scholar]
- Nurius PS, Yeaton WH. Research synthesis reviews: an illustrated critique of ‘hidden’ judgments, choices, and compromises. Clinical Psychology Review. 1987;7:695–714. [Google Scholar]
- Patania SS. Unpublished thesis. Johns Hopkins University; 2003. Use of antiretrovirals and PCP prophylaxis in HIV positive urban women with depressive symptoms: The HERS study. [Google Scholar]
- Paterson DL, Swindells S, Mohr J, Brester M, Vergis EN, Squier C, Wagener MM, Singh N. Adherence to protease inhibitor therapy and outcomes in patients with HIV infection. Annals of Internal Medicine. 2000;133:21–30. doi: 10.7326/0003-4819-133-1-200007040-00004. [DOI] [PubMed] [Google Scholar]
- Phillips KD, Moneyham L, Murdaugh C, Boyd MR, Tavakoli A, Jackson K, Vyavaharkar M. Sleep disturbance and depression as barriers to adherence. Clinical Nursing Research. 2005;14:273–293. doi: 10.1177/1054773805275122. [DOI] [PubMed] [Google Scholar]
- Raudenbush SW. Random effects models. In: Cooper H, Hedges LV, editors. The Handbook of Research Synthesis. Russell Sage Foundation; New York: 1994. pp. 301–322. [Google Scholar]
- Rueda S, Park-Wyllie L, Bayoumi A, Tynan A, Antoniou T, Rourke S, et al. Patient support and education for promoting adherence to highly active antiretroviral therapy for HIV/AIDS. The Cochrane Database of Systematic Reviews 2006. 2006;3:1–38. doi: 10.1002/14651858.CD001442.pub2. [DOI] [PMC free article] [PubMed] [Google Scholar]
- Sandelowski M, Voils CI, Barroso J. Comparability work and the management of difference in research synthesis studies. Social Science & Medicine. 2007;64:236–247. doi: 10.1016/j.socscimed.2006.08.041. [DOI] [PMC free article] [PubMed] [Google Scholar]
- Schuman P, Ohmit SE, Cohen M, Sacks HS, Richardson J, Young M, Schoenbaum E, Rompalo A, Gardner L. Prescription of and adherence to antiretroviral therapy among women with AIDS. AIDS and Behavior. 2001;5:371–378. [Google Scholar]
- Sharpe TT, Lee LM, Nakashima AK, Elam-Evans LD, Fleming PL. Crack cocaine use and adherence to antiretroviral treatment among HIV-infected black women. Journal of Community Health. 2004;29:117–127. doi: 10.1023/b:johe.0000016716.99847.9b. [DOI] [PubMed] [Google Scholar]
- Sowell RL, Phillips KD, Murdaugh C, Tavokali A. Health care providers’ influence on HIV-infected women’s beliefs and intentions related to AZT therapy. Clinical Nursing Research. 1999;8:336–354. doi: 10.1177/10547739922158340. [DOI] [PubMed] [Google Scholar]
- Sowell RL, Murdaugh CL, Addy C, Moneyham L, Tavokoli A, Misener T. Preventing perinatal human immunodeficiency virus transmission: factors influencing women’s intentions toward zidovudine therapy. Southern Medical Journal. 2001a;94:1177–1184. [PubMed] [Google Scholar]
- Sowell RL, Phillips KD, Seals BF, Misener TR, Rush C. HIV-infected women’s experiences and beliefs related to AZT therapy during pregnancy. AIDS Patient Care and STDS. 2001b;15:201–209. doi: 10.1089/10872910151133747. [DOI] [PubMed] [Google Scholar]
- Stone VE, Hogan JW, Schuman P, Rompalo AM, Howard AA, Korkontzelou C, Smith DK. Antiretroviral regimen complexity, self-reported adherence, and HIV patients’ understanding of their regimens: survey of women in the HER study. Journal of Acquired Immune Deficiency Syndromes. 2001;28:124–131. doi: 10.1097/00042560-200110010-00003. [DOI] [PubMed] [Google Scholar]
- Turner BJ, Newschaffer CJ, Zhang D, Cosler L, Hauck WW. Antiretroviral use and pharmacy-based measurement of adherence in postpartum HIV-infected women. Medical Care. 2000;38:911–925. doi: 10.1097/00005650-200009000-00005. [DOI] [PubMed] [Google Scholar]
- Wilson TE, Ickovics JR, Fernandez MI, Koenig LJ, Walter E. Self-reported zidovudine adherence among pregnant women with human immunodeficiency virus infection in four US states. American Journal of Obstetrics and Gynecology. 2001;184:1235–1240. doi: 10.1067/mob.2001.114032. [DOI] [PubMed] [Google Scholar]
- Wilson TE, Barron Y, Cohen M, Richardson J, Greenblatt R, Sacks HS, Young M. Adherence to antiretroviral therapy and its association with sexual behavior in a national sample of women with human immunodeficiency virus. Clinical Infectious Diseases. 2002;34:529–534. doi: 10.1086/338397. [DOI] [PubMed] [Google Scholar]
- Wyatt GE, Longshore D, Chin D, Carmona JV, Loeb TB, Myers HF, Warda U, Liu H, Rivkin I. The efficacy of an integrated risk reduction intervention for HIV-positive women with child sexual abuse histories. AIDS and Behavior. 2004;8:453–462. doi: 10.1007/s10461-004-7329-y. [DOI] [PubMed] [Google Scholar]