

Abstract
Recent studies suggest obesity is associated with lower serum PSA, perhaps influencing recommendation for prostate biopsy, potentially explaining part of the observed poorer prognosis among obese men. African American men have the highest rates of prostate cancer and are more likely to die of the disease making early detection a priority in this group. We present findings from the Flint Men’s Health Study, a study in African American men, which are consistent with most studies suggesting that overweight men have PSA levels 0.15–0.30 ng/mL lower than those who are not overweight. We have coupled our results with a systematic review of publications in this area.
Keywords: Obesity, Body Mass Index, Waist Circumference, Height, Prostate Cancer, Free PSA, African Americans
INTRODUCTION
The discovery of serum prostate specific antigen (PSA) and its extensive use for the last two decades has dramatically influenced the way prostate cancer is diagnosed and monitored both before and after treatment 1. In spite of this, limitations still exist in the use of the PSA screening for early detection of prostate cancer, which has led to conflicting recommendations in whom to screen and what age to begin screening. Perhaps the most significant issue is the inability to determine a cut-point for “normal” PSA level, resulting in a relatively poor positive predictive value of the PSA screening test 2, 3. Results from the end-of-study biopsies performed as part of the Prostate Cancer Prevention Trial (PCPT) indicate poor sensitivity at the PSA cut-point of 4.0 ng/mL and no normal threshold as clinically significant prostate cancer was discovered at all PSA levels 4, 5. It has also been suggested that pre-diagnostic PSA no longer adequately predicts important prognostic features, particularly at levels below 10 ng/mL 6.
There was some inconsistency in epidemiologic literature published prior to 2000 as to whether obesity is a risk factor for prostate cancer. However, results from recent studies more clearly show obese men present with more advanced stage disease and have a higher risk of recurrence compared to non-obese men 7–12. Studies also indicate obesity is associated with a lower “risk” of early stage/less aggressive disease 10, 11, 13. Debate exists as to the contributing factors that account for the observed poorer outcomes associated with obesity. Is it the result of a more aggressive phenotype due to a distinct underlying biological effect of obesity on prostate cancer initiation and progression, or could it be attributed in part to delayed diagnosis and less successful treatment among obese men 14?
Findings from the San Antonio center for Biomarkers Of Risk (SABOR) study were the first to demonstrate a strong inverse relation between body mass index (BMI) and total serum PSA level among a population-based sample of healthy men without prostate cancer, suggesting that reliance on PSA testing and the current recommended PSA cutoffs for men in the general population (≥4.0 ng/ml) for biopsy referral in obese men may result in protracted progression of disease 15. A number of subsequent reports support these findings, but studies have not been entirely consistent, as even a prior publication from the SABOR study reported no relation between BMI and PSA levels. Furthermore, there is no definitive knowledge regarding the metabolic and/or hormonal influences which explain the association between obesity and PSA level. If the underlying biology is closely linked to processes connected to increased adipose tissue, BMI is may not be the optimal measure as it does not distinguish fat from lean body mass. There are several other measures of body composition which are valid indicators of adiposity and may be more sensitive in predicting PSA levels. In the current investigation, we examined the relation between BMI, waist circumference, waist to hip ratio (WHR) and height with both total and bioavailable serum PSA concentrations in the Flint Men’s Health Study (FMHS)--a large, population-based study originally designed to evaluate age-specific PSA ranges and prostate cancer risk factors among African American men. In addition, we have conducted a review of the recent literature published in the area of obesity and prostate specific antigen in an effort to synthesize the existing knowledge and discuss the impact of these findings in the context of current and future prostate cancer screening practices.
METHODS
Data Collection
The Flint Men’s Health Study (FMHS) is a cross-sectional community-based study of prostate disease in African-American men. The study design, sampling and methods for data collection have been described in detail previously 16, 17. The protocol was reviewed and approved by the University of Michigan Institutional Review Board. At baseline, 730 men aged 40 to 79, were recruited from a probability sample of age-eligible residents in Flint, Michigan and neighboring communities. All subjects completed an interviewer administered, in-home survey collecting information on demographics, behavioral factors (smoking, alcohol consumption, physical activity), occupational history, family history of prostate cancer, and a complete medical history. Three-hundred seventy-nine men (52%) participated in a clinical examination that included measurement of serum PSA (free and total), digital rectal exam (DRE), transrectal ultrasonography to determine prostate volume, as well as measurement of height, weight, waist and hip circumferences. Exam participants were asked to refrain from sexual activity for at least 24 hours prior to measurement of PSA, and blood draws were performed prior to the DRE to avoid transitory increases in PSA. Men with an elevated total PSA (≥4.0 ng/ml) and/or an abnormal DRE were referred for prostate biopsy. Eleven subjects were diagnosed with prostate cancer as a consequence of the protocol. These cases were excluded as well as those men (n = 15) with abnormal DRE and/or total PSA levels ≥4.0 ng/ml who did not submit to a prostate biopsy, those with undetectable PSA levels (n = 3) based on the assay (Abbott AxSYM polyclonal-monoclonal immunoassay (<0.1 ng/ml)) or missing anthropometric measures (n = 2), leaving a total of 348 men eligible for this analysis.
Statistical Analysis
Analysis was performed using Statistical Analysis System software version 9.1 (SAS Institute, Cary N.C). BMI was calculated from measured weight and height in kg/m2. In examining the association between BMI and PSA levels in linear regression analyses, BMI was treated as both a continuous variable and then as a categorical variable in an analysis of variance according to the current Centers for Disease Control (CDC) criteria (normal weight (< 25.0 kg/m2); overweight (25.0–29.9 kg/m2); and obese (≥30.0 kg/m2)). To facilitate comparison with SABOR results, two additional categories were created that represent morbid or extreme obesity (35.0–39.9 kg/m2 and ≥40kg/m2), represented in Figure 1. Waist circumference, WHR and height were analyzed as continuous variables and divided into approximate quartiles based on their distributions in the total sample. Since the distributions of both free and total PSA were skewed, a natural log transformation was performed to normalize the distributions and subsequently back transformed to the original scale to facilitate interpretation of results. In some circumstances, the log transformation did not produce normally distributed data. Therefore, non-parametric analysis of variance was used to assess the contribution of body composition measures on variation in log total and log free PSA levels as well as the ratio of free to total PSA (%fPSA) adjusted for age.
Figure 1.
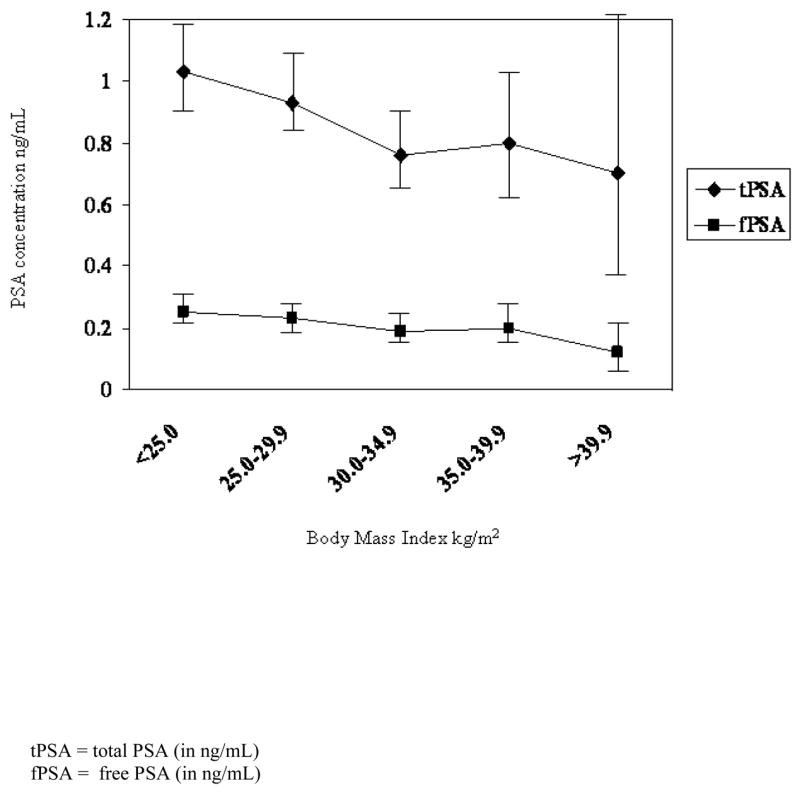
The age-adjusted least-squares mean PSA concentrations according to body mass index (with 95% confidence intervals).
RESULTS
The mean age of the 348 FMHS subjects at baseline was 57 years. The distribution of subjects by age and body mass index is described in Table 1. Despite the initial sampling strategy to oversample men in older age groups, just over 60% of participants were younger than 60 at the baseline clinical examination. Approximately 32% of subjects were considered obese and nearly 70% classified as overweight (or obese). The mean waist circumference of FMHS subjects was 38 inches with 30% having a waist circumference of greater than 40 inches (the conventional classification for abdominal obesity 18). The mean total PSA level was 1.36 ng/mL and a mean %fPSA of 27%.
Table 1.
Selected characteristics and serum PSA among Flint Men’s Health Study (FMHS) participants without prostate cancer
| Participant characteristic | N (%) or mean (SD) |
|---|---|
| No. Subjects | 348 (100) |
| Age (in years) | |
| 40 to 49 | 101 (29.0) |
| 50 to 59 | 111 (31.9) |
| 60 to 69 | 89 (25.6) |
| ≥70 | 47 (13.5) |
| Body Mass Index (kg/m2) | |
| < 25.0 or normal | 112 (32.2) |
| 25.0–29.9 or overweight | 126 (36.2) |
| ≥30.0 or obese | 110 (31.6) |
| Waist Circumference (inches) | 38.0 (6.2) |
| Hip Circumference (inches) | 39.7 (5.4) |
| Height (inches) | 70.0 (2.7) |
| Waist-to-Hip Ratio | 0.95 (0.1) |
| Total PSA† (ng/mL) | 1.36 (1.8) |
| Free PSA † (ng/mL) | 0.29 (0.2) |
| % fPSA ‡ | 27.0 (10.0) |
Raw mean and standard deviation of total and free PSA concentration: Geometric mean for study sample: Total = 0.90 ng/mL
Free = 0.23 ng/mL
Ratio of free to total PSA concentration
Excludes missing data
After adjustment for age, BMI was inversely related to both total (p = 0.03) and free (p = 0.009) PSA concentrations among subjects (Table 2). The geometric mean of total PSA level among men with a BMI of 30 or more kg/m2 was 0.31 ng/mL lower than those with a BMI of less than 25 kg/m2. Although trends by BMI level were similar for free and total PSA concentrations and measures of waist circumference and WHR, those inverse associations were weak. No association was observed between height and PSA concentrations. Likewise, no consistent association was observed between any of the measures gathered and %f PSA. In an effort to replicate the findings of Baillargeon et al. 15, Figure 1 illustrates the relation between PSA concentrations and BMI including the subclasses representing morbidly obese participants. Despite limitations in sample size, our results are remarkably similar to the aforementioned investigation as men with BMI equal to or greater than 40 kg/m2 had total PSA levels 0.42 ng/mL lower than those with BMI less than 25 kg/m2. The monotonic association was less pronounced for free PSA.
Table 2.
Select measures of body composition, total PSA concentration and %f PSA among 348 African American men without prostate cancer at baseline examination.
| N (%) | Total PSA‡ (ng/mL) | P-value * | Free PSA‡ (ng/mL) | P-value * | % fPSA | P-value * | |
|---|---|---|---|---|---|---|---|
| BMI | |||||||
| Normal (<25.0 kg/m2) | 112 (32.2) | 1.05 | 0.25 | 26.0 | |||
| Overweight (25.0–29.9 kg/m2) | 126 (36.2) | 0.95 | 0.23 | 27.2 | |||
| Obese (≥30 kg/m2) | 110 (31.6) | 0.74 | 0.03 | 0.19 | 0.009 | 28.1 | 0.35 |
| Waist Circumference | |||||||
| < 34 inches | 78 (22.4) | 1.02 | 0.25 | 25.8 | |||
| 34 to 37.5 inches | 97 (27.9) | 0.92 | 0.23 | 27.8 | |||
| 37.6 to 41 inches | 88 (25.3) | 0.92 | 0.23 | 27.7 | |||
| > 41 inches | 85 (24.4) | 0.81 | 0.26 | 0.20 | 0.20 | 26.9 | 0.56 |
| Waist to Hip ratio | |||||||
| < 0.91 | 79 (22.7) | 1.05 | 0.26 | 25.9 | |||
| 0.91–0.95 | 95 (27.3) | 0.77 | 0.22 | 29.2 | |||
| 0.96–1.00 | 102 (29.3) | 0.91 | 0.21 | 25.9 | |||
| >1.00 | 72 (20.7) | 0.94 | 0.11 | 0.22 | 0.17 | 27.3 | 0.14 |
| Height | |||||||
| <68 inches | 78 (22.4) | 1.03 | 0.24 | 25.7 | |||
| 68 to 69.9 inches | 88 (25.3) | 0.87 | 0.23 | 29.0 | |||
| 70 to 71.9 inches | 99 (28.5) | 0.85 | 0.21 | 27.0 | |||
| ≥72 inches | 83 (23.8) | 0.89 | 0.73 | 0.22 | 0.95 | 26.5 | 0.23 |
Geometric mean of total and bioavailable PSA concentrations rounded to two significant digits
p-value corresponding to age-adjusted difference in log transformed PSA and %fPSA comparing all groups
COMMENT
The upward trend in the prevalence of obesity has become a major public health concern in this United States. Ogden et al. (18), estimated that 34% of the U.S. adult population in 2004 was considered overweight and 32% obese 19. If current trends are extrapolated into the future, by 2010, more than 40% of the total adult population will be classified as obese 20. The prevalence of overweight and obesity in the African American community is particularly staggering, as 45% of the adult population is presently classified as obese 19. An estimated mortality burden of at least 300,000 deaths (all causes) per year and $90 billion in direct health care costs have been attributed to excess weight and relatively sedentary lifestyle 21, 22.
The pathophysiology of obesity may be viewed as an imbalance between energy intake (kilocalories), mechanisms controlling appetite, and energy expenditure. The metabolic consequences of central abdominal obesity include insulin resistance, hyperinsulinemia, glucose intolerance or type-2 diabetes, increased triglyceride levels, increased production of proinflammatory cytokines, elevated C-reactive protein and increased endogenous production of bioavailable sex-steroid hormones. The increased levels of insulin are positively correlated with increased production of bioavailable insulin-like growth factor I (IGF-I) in the liver, fat cells and other organs. IGF-I has been shown to exhibit mitogenic and anti-apoptotic actions that have been associated with risk of solid organ cancers 23–28.
Results from a number of epidemiologic investigations suggest that obesity is associated with an increased risk of advanced prostate cancer, biochemical recurrence and death 29–32. It has been proposed that the development of aggressive disease among obese men may be due to elevated levels of estradiol relative to testosterone, insulin and insulin-like growth factors and/or altered adipokine concentrations; however, others have attributed these findings to a delayed detection of prostate cancer, related to a difficulty in the palpation of the prostate during clinical examination (DRE) and/or PSA screening in heavy men 14, 15, 33.
Thompson et al. (2003) cite the difficulty in determining the appropriate cutoff optimal for distinguishing normal from abnormal PSA values. Although serum PSA elevations greater than 4.0 ng/mL are associated with prostate cancer, the positive predictive value (PPV) of a serum PSA value between 4.0 ng/mL and 10 ng/mL is only 20–30%, with PPV raising to 40–70% for serum PSA values greater than 10 ng/mL 3. The PPV of serum PSA values below 4.0 ng/mL are not well defined.
As PSA is only available serum marker for prostate cancer, multiple approaches have been proposed in an effort to increase the sensitivity of the test, including supplementing total PSA concentrations with PSA velocity (the rate of increase in PSA concentration over time) and %fPSA. A post-hoc analysis of prostate cancer risk as a function of PSA level conducted among placebo controls in the Prostate Cancer Prevention Trial (PCPT) who had undergone a prostate biopsy suggests also consideration of DRE findings and family history of prostate cancer in interpreting PSA values before biopsy referral 34. The specificity of the PSA test is improved through our understanding the influences of serum PSA among men without disease. The evidence clearly indicates age is a strong predictor of PSA level, serum PSA increasing in a linear fashion with increasing age, so that age-specifsc normal ranges have been proposed to identify those at a higher probability of having prostate cancer 35. Evidence also suggests that PSA level is positively associated with prostate gland volume and higher in African Americans36, 37.
A number of recent studies examining the relation between serum PSA and body mass generally suggest an inverse relation, but the findings are not entirely consistent (Table 3). In 2004, Thompson et al. reported no association between PSA level and BMI among 1,565 healthy men participating in the SABOR study 38. However, as previously mentioned, a subsequent analysis of 2,779 men published from the same study was the first to show age-adjusted PSA concentration decreasing in a linear fashion with increasing BMI (p < 0.0001), and the results were reportedly similar across age and race strata. Assuming that the participants from the first study represent more than half the subjects included in the analysis, no explanation was provided by the authors to explain the discrepant findings 15. Following investigations, including the current analysis, report largely similar findings indicating PSA levels 0.15–0.30 ng/mL lower among men with a BMI greater than 30 kg/m2 compared to men with a BMI less than 25 kg/m2 39–42. However, have others reported no association between BMI and PSA 43–45.
Table 3.
A summary of findings from studies of body composition and prostate specific antigen (PSA) levels in men without diagnosis of prostate cancer.
| First Author
(year of publication) |
Study Population | Measure(s) | Findings | Comments |
|---|---|---|---|---|
| Ku et al. (2002)43 | 6,005 men
40–59 yrs |
BMI | BMI 20.47 (ORa = 1.55 (0.99,2.41))
BMI 20.48–27.09 (referent) BMI 27.10 (ORa = 0.79 (0.45–1.39)) |
Age only predictor of having a PSA > 2.5ng/mL in multivariable analysis |
| Thompson et al. (2004)38 | 1,565 men
≥20 yrs |
BMI | No reported variation in PSA by BMI
No reported modification by race or family history, however regression lines appear to differ between races |
SABORb study |
| Baillargeon et al. (2005)15 | 2,770 men
≥20 yrs |
BMI | Inverse linear association with PSA (p<0.0001)
No reported modification by race/ethnicity (data not shown) |
SABORb study |
| Kristal et al. (2005)39 | 9,459 men
≥55 yrs |
BMI | Inverse association with PSA (p<0.0001)
No association with PSA velocityd |
PCPTc placebo controls |
| Ochiai et al. (2005)44 | 653 men
median age 62 yrs |
BMI, BSA weight, height | BSA inversely associated to PSA (p<0.05)
PSA unrelated to BMI, weight, height |
BMI, BSA, height available on 478 subjects |
| Barqawi et al. (2005)41 | 4,458 men
median age 60 yrs |
BMI | BMI inversely associated with total and complexed PSA | PCAWe |
| Fowke et al. (2006)40 | 299 men
40–79 yrs |
BMI, height | BMI inversely associated with PSA among men <60 yrs
(p = 0.02) and free PSA (p = 0.04), but not % fPSA (p = 0.49) Height unrelated to PSA |
Subset of SSCSf study Comparison of Caucasian and African American men |
| Fowke et al. (2007)45 | 380 men
≥40 yrs |
BMI, WHR, WC, height | PSA unrelated to BMI, WC, height, but positively associated with WHR (p = 0.04) | |
| Werny et al. (2007)42 | 2,396 men
≥40 yrs |
BMI, WC, height, weight skinfoldg
TBW |
BMI inversely associated with PSA among whites,
Hispanics, but not blacks TBW inversely associated with PSA among whites, blacks, but not Hispanics |
NHANESh (2001–2004) |
Age-adjusted odds ratio predicting probability of having a PSA >2.5 ng/mL;
San Antonio study of Biomarkers Of Risk;
Prostate Cancer Prevention Trial
% change per year;
Prostate Cancer Awareness Week 2003 National Screening Program;
Southern Community Cohort Study;
Tricep and subscapular thickness;
National Health And Nutrition Examination Survey;
KEY: BMI=Body Mass Index (kg/m2); WHR=Waist/Hip ratio; WC=Waist Circumference; BSA=Body Surface Area (sqrt[m*kg/3600]); TBW=Total Body Water
Recognizing the limitations of using BMI as a surrogate measure of adiposity, a small number of investigations, including our own, have considered the use of additional measures such as waist circumference (WC) and WHR and have surprisingly not observed similar or stronger relations with PSA levels as BMI 42, 45. No significant association between height and total PSA has been observed in any investigation. However, Fowke et al. has shown an association between height and %fPSA, which was not replicated in our data 40. Using data gathered as part of the National Health and Nutrition Examination Survey (NHANES 2001–2004), Werny et al. reported significant inverse relationships between BMI, weight, WC, total body water (TBW), tricep skinfold and PSA among white men participating in the study. However, no significant associations were reported for measured height, or subscapular skinfold thickness 42. Our study and others have examined in addition total PSA, PSA velocity and bioavailable or free PSA levels. Our findings are similar to those reported by Fowke et al., indicating that free PSA is inversely associated with BMI, but no relation between BMI and %fPSA. Finally, Kristal et al. found that among PCPT placebo controls, BMI (1 year post-randomization) was unrelated to PSA velocity (p = 0.84), but weight gain over the next 6 years was inversely related to change in PSA (p<0.02) 39.
To date, the FMHS is still one of the largest studies of prostate disease among African Americans. The methods of the study are well-suited for this investigation because, as the original goals focused on the examining the distribution of PSA in healthy African American men, efforts were made to reduce both internal (diurnal) and external (DRE, sexual activity) sources of variability. Biopsy referral for abnormal test results and excluding individuals who would not submit for biopsy further reduces the possibility of inclusion of prostate cancer cases in the study population. Furthermore, the impact of studying this relation in the African American community is particularly important in that these men face a poorer prognosis and higher mortality compared to other racial and ethnic groups. This is likely due in part to limited access to medical care and screening for the disease.
There are study limitations which require some consideration in interpreting our results. The cross-sectional design of the study, as is the case for the vast majority of investigations reviewed, is not optimal for establishing a causal relation between obesity and PSA. However, the longitudinal findings by Kristal et al, support a temporal sequence between weight gain and PSA change. A reported 10 pound gain in weight over any single year was associated with a 0.024 ng/mL decrease in PSA adjusting for baseline PSA (PSA at the beginning of the year), age, race and smoking 39. In addition, we were limited in our investigation of PSA levels among men characterized as morbidly obese due to the small number of men with BMIs ≥ 35.0 kg/m2 (n = 42). Our best estimate of the mean PSA concentrations among the heaviest men in our study population align closely with others15, yet with the imprecision in these estimates one cannot exclude the possibility that PSA levels do not differ from men with BMIs in the normal range.
The underlying biology explaining the relationship between BMI and PSA concentration is poorly understood. The weaker associations observed with WHR and WC may suggest that the suppression of PSA is not as closely related to the elevated estrogen to androgen ratio observed in men with abdominal adiposity as has been proposed 15. It has also been hypothesized that the association may be explained through effectively a dilution in PSA with an increase in plasma volume observed in obese men 33, a theory supported by the results of Werny et al 42.
CONCLUSIONS
Taken together, the findings of our study and others suggest a modest decrease in PSA concentrations with increasing body mass among men without prostate cancer. However, the importance of this relation and its contribution to delayed detection and consequently poorer prognosis among obese men diagnosed with prostate cancer is still debatable. One must also consider the screening practices of the individual, competing risk factors and normal physician practice for recommendation of a prostate biopsy in assessing the impact. It has been suggested that we must dispose of the notion that PSA levels are classified as either normal or elevated and men are generally not well-served when biopsy referral is based on conventional cutpoints (>4.0 ng/mL or >2.5 ng/mL) 3. We propose that physicians should consider the impact of obesity on PSA and drop the threshold for prostate biopsy. Likewise, Buschmeyer and Freedland have suggested multiplying measured PSA concentrations by a constant among obese men which would depend on the severity of the condition33, the algorithm determined based on the findings of SABOR 15. In the future, we believe that accounting for body mass in addition to other prostate cancer risk factors in interpreting PSA concentrations and assessing risk may ultimately lead to reductions in prostate cancer mortality among overweight and obese men.
Acknowledgments
This work supported by the National Institutes of Health Specialized Program of Research Excellence (S.P.O.R.E) grant P50CA89568.
Footnotes
Publisher's Disclaimer: This is a PDF file of an unedited manuscript that has been accepted for publication. As a service to our customers we are providing this early version of the manuscript. The manuscript will undergo copyediting, typesetting, and review of the resulting proof before it is published in its final citable form. Please note that during the production process errors may be discovered which could affect the content, and all legal disclaimers that apply to the journal pertain.
Reference List
- 1.Stamey TA, Yang N, Hay AR, et al. Prostate-specific antigen as a serum marker for adenocarcinoma of the prostate. N Engl J Med. 1987;317(15):909–916. doi: 10.1056/NEJM198710083171501. [DOI] [PubMed] [Google Scholar]
- 2.Hernandez J, Thompson IM. Prostate-specific antigen: a review of the validation of the most commonly used cancer biomarker. Cancer. 2004;101(5):894–904. doi: 10.1002/cncr.20480. [DOI] [PubMed] [Google Scholar]
- 3.Thompson I, Leach RJ, Pollock BH, et al. Prostate cancer and prostate-specific antigen: the more we know, the less we understand. J Natl Cancer Inst. 2003;95(14):1027–1028. doi: 10.1093/jnci/95.14.1027. [DOI] [PubMed] [Google Scholar]
- 4.Thompson IM, Pauler DK, Goodman PJ, et al. Prevalence of prostate cancer among men with a prostate-specific antigen level < or =4.0 ng per milliliter. N Engl J Med. 2004;350(22):2239–2246. doi: 10.1056/NEJMoa031918. [DOI] [PubMed] [Google Scholar]
- 5.Ankerst DP, Thompson IM. Sensitivity and specificity of prostate-specific antigen for prostate cancer detection with high rates of biopsy verification. Arch Ital Urol Androl. 2006;78(4):125–129. [PubMed] [Google Scholar]
- 6.Stamey TA, Caldwell M, McNeal JE, et al. The prostate specific antigen era in the United States is over for prostate cancer: what happened in the last 20 years? J Urol. 2004;172(4 Pt 1):1297–1301. doi: 10.1097/01.ju.0000139993.51181.5d. [DOI] [PubMed] [Google Scholar]
- 7.Freedland SJ, Terris MK, Presti JC, Jr, et al. Obesity and biochemical outcome following radical prostatectomy for organ confined disease with negative surgical margins. J Urol. 2004;172(2):520–524. doi: 10.1097/01.ju.0000135302.58378.ae. [DOI] [PubMed] [Google Scholar]
- 8.Amling CL, Riffenburgh RH, Sun L, et al. Pathologic variables and recurrence rates as related to obesity and race in men with prostate cancer undergoing radical prostatectomy. J Clin Oncol. 2004;22(3):439–445. doi: 10.1200/JCO.2004.03.132. [DOI] [PubMed] [Google Scholar]
- 9.Amling CL, Kane CJ, Riffenburgh RH, et al. Relationship between obesity and race in predicting adverse pathologic variables in patients undergoing radical prostatectomy. Urology. 2001;58(5):723–728. doi: 10.1016/s0090-4295(01)01373-5. [DOI] [PubMed] [Google Scholar]
- 10.Gong Z, Neuhouser ML, Goodman PJ, et al. Obesity, diabetes, and risk of prostate cancer: results from the prostate cancer prevention trial. Cancer Epidemiol Biomarkers Prev. 2006;15(10):1977–1983. doi: 10.1158/1055-9965.EPI-06-0477. [DOI] [PubMed] [Google Scholar]
- 11.Rodriguez C, Freedland SJ, Deka A, et al. Body mass index, weight change, and risk of prostate cancer in the Cancer Prevention Study II Nutrition Cohort. Cancer Epidemiol Biomarkers Prev. 2007;16(1):63–69. doi: 10.1158/1055-9965.EPI-06-0754. [DOI] [PubMed] [Google Scholar]
- 12.Strom SS, Wang X, Pettaway CA, et al. Obesity, weight gain, and risk of biochemical failure among prostate cancer patients following prostatectomy. Clin Cancer Res. 2005;11(19 Pt 1):6889–6894. doi: 10.1158/1078-0432.CCR-04-1977. [DOI] [PubMed] [Google Scholar]
- 13.Wright ME, Chang SC, Schatzkin A, et al. Prospective study of adiposity and weight change in relation to prostate cancer incidence and mortality. Cancer. 2007;109(4):675–684. doi: 10.1002/cncr.22443. [DOI] [PubMed] [Google Scholar]
- 14.Freedland SJ, Platz EA. Obesity and Prostate Cancer: Making Sense out of Apparently Conflicting Data. Epidemiol Rev. 2007 doi: 10.1093/epirev/mxm006. [DOI] [PubMed] [Google Scholar]
- 15.Baillargeon J, Pollock BH, Kristal AR, et al. The association of body mass index and prostate-specific antigen in a population-based study. Cancer. 2005;103(5):1092–1095. doi: 10.1002/cncr.20856. [DOI] [PubMed] [Google Scholar]
- 16.Cooney KA, Strawderman MS, Wojno KJ, et al. Age-specific distribution of serum prostate-specific antigen in a community-based study of African-American men. Urology. 2001;57(1):91–96. doi: 10.1016/s0090-4295(00)00873-6. [DOI] [PubMed] [Google Scholar]
- 17.Heeringa SG, Alcser KH, Doerr K, et al. Potential selection bias in a community-based study of PSA levels in African-American men. J Clin Epidemiol. 2001;54(2):142–148. doi: 10.1016/s0895-4356(00)00270-5. [DOI] [PubMed] [Google Scholar]
- 18.Lean ME, Han TS, Morrison CE. Waist circumference as a measure for indicating need for weight management. BMJ. 1995;311(6998):158–161. doi: 10.1136/bmj.311.6998.158. [DOI] [PMC free article] [PubMed] [Google Scholar]
- 19.Ogden CL, Carroll MD, Curtin LR, et al. Prevalence of overweight and obesity in the United States, 1999–2004. JAMA. 2006;295(13):1549–1555. doi: 10.1001/jama.295.13.1549. [DOI] [PubMed] [Google Scholar]
- 20.National Center for Health Statistics. [Accessed 06/20/2007];1999 http://www.cdc.gov/nchs/products/pubs/pubd/hestats/obese/obse99.htm.
- 21.Colditz GA. Economic costs of obesity and inactivity. Med Sci Sports Exerc. 1999;31(11 Suppl):S663–S667. doi: 10.1097/00005768-199911001-00026. [DOI] [PubMed] [Google Scholar]
- 22.Manson JE, Skerrett PJ, Greenland P, et al. The escalating pandemics of obesity and sedentary lifestyle. A call to action for clinicians. Arch Intern Med. 2004;164(3):249–258. doi: 10.1001/archinte.164.3.249. [DOI] [PubMed] [Google Scholar]
- 23.Davi G, Guagnano MT, Ciabattoni G, et al. Platelet activation in obese women: role of inflammation and oxidant stress. JAMA. 2002;288(16):2008–2014. doi: 10.1001/jama.288.16.2008. [DOI] [PubMed] [Google Scholar]
- 24.Harvie M, Hooper L, Howell AH. Central obesity and breast cancer risk: a systematic review. Obes Rev. 2003;4(3):157–173. doi: 10.1046/j.1467-789x.2003.00108.x. [DOI] [PubMed] [Google Scholar]
- 25.Kaaks R, Lukanova A, Kurzer MS. Obesity, endogenous hormones, and endometrial cancer risk: a synthetic review. Cancer Epidemiol Biomarkers Prev. 2002;11(12):1531–1543. [PubMed] [Google Scholar]
- 26.Lukanova A, Lundin E, Zeleniuch-Jacquotte A, et al. Body mass index, circulating levels of sex-steroid hormones, IGF-I and IGF-binding protein-3: a cross-sectional study in healthy women. Eur J Endocrinol. 2004;150(2):161–171. doi: 10.1530/eje.0.1500161. [DOI] [PubMed] [Google Scholar]
- 27.Sandhu MS, Gibson JM, Heald AH, et al. Association between insulin-like growth factor-I: insulin-like growth factor-binding protein-1 ratio and metabolic and anthropometric factors in men and women. Cancer Epidemiol Biomarkers Prev. 2004;13(1):166–170. doi: 10.1158/1055-9965.epi-130-3. [DOI] [PubMed] [Google Scholar]
- 28.Schottenfeld D, Beebe-Dimmer JL. Advances in Cancer Epidemiology: Understanding Causal Mechanisms and the Evidence for Implementing Interventions. Annual Review of Public Health. 2005;26:37–60. doi: 10.1146/annurev.publhealth.26.021304.144402. [DOI] [PubMed] [Google Scholar]
- 29.Amling CL, Riffenburgh RH, Sun L, et al. Pathologic variables and recurrence rates as related to obesity and race in men with prostate cancer undergoing radical prostatectomy. J Clin Oncol. 2004;22(3):439–445. doi: 10.1200/JCO.2004.03.132. [DOI] [PubMed] [Google Scholar]
- 30.Freedland SJ, Aronson WJ, Kane CJ, et al. Impact of obesity on biochemical control after radical prostatectomy for clinically localized prostate cancer: a report by the Shared Equal Access Regional Cancer Hospital database study group. J Clin Oncol. 2004;22(3):446–453. doi: 10.1200/JCO.2004.04.181. [DOI] [PubMed] [Google Scholar]
- 31.Rodriguez C, Patel AV, Calle EE, et al. Body mass index, height, and prostate cancer mortality in two large cohorts of adult men in the united states. Cancer Epidemiol Biomarkers Prev. 2001;10(4):345–353. [PubMed] [Google Scholar]
- 32.Calle EE, Rodriguez C, Walker-Thurmond K, et al. Overweight, obesity, and mortality from cancer in a prospectively studied cohort of U.S. adults. N Engl J Med. 2003;348(17):1625–1638. doi: 10.1056/NEJMoa021423. [DOI] [PubMed] [Google Scholar]
- 33.Buschemeyer WC, III, Freedland SJ. Obesity and Prostate Cancer: Epidemiology and Clinical Implications. Eur Urol. 2007;52(2):331–343. doi: 10.1016/j.eururo.2007.04.069. [DOI] [PubMed] [Google Scholar]
- 34.Thompson IM, Ankerst DP, Chi C, et al. Assessing prostate cancer risk: results from the Prostate Cancer Prevention Trial. J Natl Cancer Inst. 2006;98(8):529–534. doi: 10.1093/jnci/djj131. [DOI] [PubMed] [Google Scholar]
- 35.Schottenfeld D, Colditz GA. Prostate cancer screening practices and cancer control research (United States) Cancer Causes and Control. 2002;13:1–5. doi: 10.1023/a:1013974602771. [DOI] [PubMed] [Google Scholar]
- 36.Bosch JL, Hop WC, Bangma CH, et al. Prostate specific antigen in a community-based sample of men without prostate cancer: correlations with prostate volume, age, body mass index, and symptoms of prostatism. Prostate. 1995;27(5):241–249. doi: 10.1002/pros.2990270503. [DOI] [PubMed] [Google Scholar]
- 37.Smith DS, Carvalhal GF, Mager DE, et al. Use of lower prostate specific antigen cutoffs for prostate cancer screening in black and white men. J Urol. 1998;160:1734–1738. [PubMed] [Google Scholar]
- 38.Thompson IM, Leach R, Troyer D, et al. Relationship of body mass index and prostate specific antigen in a population-based study. Urol Oncol. 2004;22(2):127–131. doi: 10.1016/S1078-1439(03)00171-6. [DOI] [PubMed] [Google Scholar]
- 39.Kristal AR, Chi C, Tangen CM, et al. Associations of demographic and lifestyle characteristics with prostate-specific antigen (PSA) concentration and rate of PSA increase. Cancer. 2006;106(2):320–328. doi: 10.1002/cncr.21603. [DOI] [PubMed] [Google Scholar]
- 40.Fowke JH, Signorello LB, Chang SS, et al. Effects of obesity and height on prostate-specific antigen (PSA) and percentage of free PSA levels among African-American and Caucasian men. Cancer. 2006;107(10):2361–2367. doi: 10.1002/cncr.22249. [DOI] [PubMed] [Google Scholar]
- 41.Barqawi AB, Golden BK, O’Donnell C, et al. Observed effect of age and body mass index on total and complexed PSA: analysis from a national screening program. Urology. 2005;65(4):708–712. doi: 10.1016/j.urology.2004.10.074. [DOI] [PubMed] [Google Scholar]
- 42.Werny DM, Thompson T, Saraiya M, et al. Obesity is negatively associated with prostate-specific antigen in U.S. men, 2001–2004. Cancer Epidemiol Biomarkers Prev. 2007;16(1):70–76. doi: 10.1158/1055-9965.EPI-06-0588. [DOI] [PubMed] [Google Scholar]
- 43.Ku JH, Kim ME, Lee NK, et al. Influence of age, anthropometry, and hepatic and renal function on serum prostate-specific antigen levels in healthy middle-age men. Urology. 2003;61(1):132–136. doi: 10.1016/s0090-4295(02)02001-0. [DOI] [PubMed] [Google Scholar]
- 44.Ochiai A, Fritsche HA, Babaian RJ. Influence of anthropometric measurements, age, and prostate volume on prostate-specific antigen levels in men with a low risk of prostate cancer. Urology. 2005;66(4):819–823. doi: 10.1016/j.urology.2005.04.040. [DOI] [PubMed] [Google Scholar]
- 45.Fowke JH, Motley SS, Cookson MS, et al. The association between body size, prostate volume and prostate-specific antigen. Prostate Cancer Prostatic Dis. 2007;10(2):137–142. doi: 10.1038/sj.pcan.4500924. [DOI] [PubMed] [Google Scholar]