Abstract
Increasing susceptibility of the elderly to many infectious diseases is highly associated with the loss or delay in the generation of antigen specific CD4+ T cells. For Mycobacterium tuberculosis, where antigen-specific CD4+ T cell derived IFN-γ is essential, such a loss can lead to a significant failure to control infection. The present paper develops a mathematical model of infection with M. tuberculosis in old mice. The model includes an early resistance to infection which is mediated by CD8+ T cells. A subsequent reversal of this phenotype results from the slow generation of CD4+ T cell mediated immunity in old age. The model simulations corroborate experimental data and hence, the model was used to test whether immunity to infection could be improved in old mice, if CD4+ T cell responses were enhanced. Our simulations indicate that boosting antigen presentation and T cell proliferation can decrease the M. tuberculosis burden in the lung.
1 Introduction
Nearly every component of the immune system undergoes age-associated changes. The most significant are thymic atrophy and an increase in the proportions of antigen experienced (memory) cells in the periphery [7]. The accumulation of antigen experienced cells in the periphery can lead to aberrations in cell function that likely have significant biological consequences. Most significant are the changes that occur within the CD4+ T cell compartment. CD4+ T cell function is markedly impaired with a reported decrease in the amount of IL-2 produced in response to antigen [8], [11]. Poor generation of antigen specific CD4+ T cell responses is thought to contribute to increased susceptibility to Mycobacterium tuberculosis infection in mice [13], [14]. Despite such susceptibility, in the mouse model it has also been shown that old mice possess a population of highly activated CD8+ T cells that can secrete IFN-γ in an antigen independent manner [23], [26]. These CD8+ T cells contribute to an early control of M. tuberculosis infection within the lung. This early control is transient, and old mice eventually succumb to infection [13].
Control of an infection with M. tuberculosis requires the generation of IFN-γ secreting antigen specific CD4+ T cells, and activation of infected macrophages that can subsequently limit bacterial growth [5]. In old age, the generation of antigen specific CD4+ T cell mediated immunity is delayed or impaired [14] and it is thought that poor CD4+ T cell mediated immunity contributes to the increased susceptibility of the elderly to develop tuberculosis [2]. Indeed, the elderly make up approximately one fifth of all tuberculosis cases in the US [17]. Tuberculosis in the elderly can occur through reactivation of a previously latent infection or from primary infection [18], [21]. Primary infection occurs when elderly individuals encounter M. tuberculosis for the first time, an event that often occurs in the nursing home environment. Under these circumstances, with waning immunity, the elderly are highly susceptible to developing tuberculosis [18], [21]. This study will model primary tuberculosis in young and old mice, as a model of primary infection in human. The aged murine model has been used extensively and is an accepted model to study the influence of increasing age on immunity. Furthermore, like human, old mice are more susceptible to primary infection with M. tuberculosis [13].
In this paper we develop a mathematical model for control of M. tuberculosis infection in the lungs of young (3 month) and aged (18 month) animals. The model includes the early participation of CD8+ T cells which have been shown to secrete IFN-γ in an antigen independent manner and are associated with an early resistance to infection, leading to an initial reduction in the bacterial load within the lung [26]. IFN-γ is essential for control of M. tuberculosis infection, which has been explicitly demonstrated in mouse models and in human [6], [10]. In old mice however, IFN-γ can be detected within the lung much earlier and in greater amounts than in young mice; is secreted by CD8+ T cells, and is thought to provide an innate function to stimulate macrophage activation, leading to better early control of infection [23]. The model we propose also accounts for the delayed or slower generation of antigen specific CD4+ T cells that has been reported in old mice in response to infection with M. tuberculosis [23], [14]. This delay contributes to the subsequent increased bacterial load seen within the lungs of old mice and is considered to be the primary defect for increased susceptibility to infection with this pathogen.
Mathematical models of M. tuberculosis infection in humans and mice were developed by Wigginton et al. [29] and Sud et al. [19]. Although these models are quite comprehensive, they do not address the effect of increasing age on the development of tuberculosis disease. To focus on the effects of aging, our model includes only the cell populations and cytokines which play the most significant role in the control of an infection with M. tuberculosis [3], [6], [22], [16], [20], and those that significantly change with increasing age [8]. Using these variables, we compared the progression of M. tuberculosis infection in old versus young mice. We demonstrate that our simulations corroborate experimental data and provide a model that can be used as a computational tool to test hypotheses on how the immune system can be manipulated in the elderly to improve the prognosis of infectious diseases.
2 The Mathematical Model
All variables used in the mathematical model are listed in Table 1. In what follows, we give a brief description of the bacterial, macrophage and T cell populations presented in the model.
Table 1.
Model variables and their initial values at day 7 for young and old mice. The choice of the initial values is explained in the last paragraph of Section 3.
| young | old | units | ||
|---|---|---|---|---|
| T4 | density of CD4+ T cells | 2 ×10⁵ | 105 | cell/ml |
| T8 | density of CD8+ T cells | 8 × 10⁴ | 8 × 10⁴ | cell/ml |
| MR | density of resting macrophages | 5 × 10⁵ | 5 × 10⁵ | cell/ml |
| MI | density of infected macrophages | 1800 | 200 | cell/ml |
| MA | density of activated macrophages | 200 | 1800 | cell/ml |
| BI | density of bacteria residing in infected macrophages | 36 000 | 4000 | cell/ml |
| BA | density of bacteria residing in activated macrophages | 1000 | 9000 | cell/ml |
| BE | density of extracellular bacteria | 1000 | 1000 | cell/ml |
| Iγ | concentration of IFN-γ | 5 | 5 | pg/ml |
| I2 | concentration of IL-2 | 10 | 5 | pg/ml |
| I10 | concentration of IL-10 | 100 | 50 | pg/ml |
| I12 | concentration of IL-12 | 50 | 200 | pg/ml |
Macrophages are defined in one of three states: infected, activated or resting. Activated macrophages are capable of controlling mycobacterial growth and presenting antigen to T cells via MHCI and MHCII [5]. A resting macrophage becomes activated by a small number n2 (taken to be 5) of bacteria in the presence of IFN-γ. IFN-γ stimulates the activated macrophage to limit M. tuberculosis growth and the bacterial numbers remain low. For simplicity, our model indicates that T cell derived IFN-γ is sufficient for macrophage activation however we acknowledge that macrophages require additional signals, such as TNF or high bacillary burden, to become activated [5]. A resting macrophage becomes an infected macrophage when it is infected (by n3 bacteria, taken to be 10) in the absence of IFN-γ. A failure to activate the macrophage with IFN-γ leads to increased intracellular growth of M. tuberculosis. An infected macrophage fails to control mycobacterial growth and can burst when it exceeds its maximal carrying capacity of N (taken to be 25) mycobacteria; the average number of mycobacteria in an infected macrophage is denoted by n1 (taken to be 20). We assume that infected macrophages can present antigen via MHCI, but MHCII presentation is inefficient. The number of resting macrophages remains unchanged during the progression of the disease, i.e., when some resting macrophages become activated or infected, new ones come to replace them. We assume that infected macrophages can become activated by IFN-γ.
The bacterial population is divided according to whether they reside within infected or activated macrophages (intracellular), or whether they are located outside the macrophage (extracellular). The number of extracellular bacteria is relatively small for both young and old mice, since extracellular growth of mycobacteria is considered to be negligible. The bacterial growth of bacteria residing within activated macrophages is assumed to be nearly negligible.
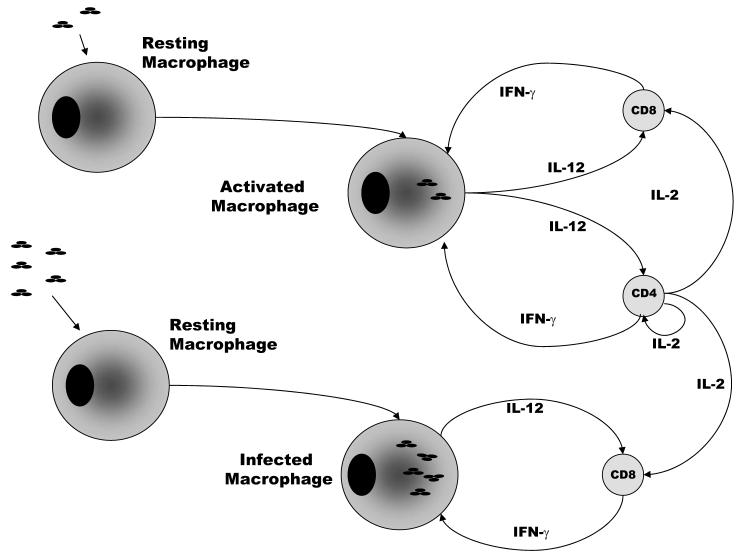
Our model includes CD4+ and CD8+ T cells. For simplicity, we do not include other cells, such as naive T cells as used in [19]. A brief schematic guide to our mathematical model is given in Figure 1. Activated and infected macrophages secrete interleukin 12 (IL-12) which, combined with antigen presentation via MHC, activates CD4+ and CD8+ T cells. In the presence of IL-12 and MHC both CD4+ and CD8+ T cells secrete antigen-specific IFN-γ which activates macrophages. For old mice, IL-12 can activate CD8+ T cells directly. CD4+ T cells secrete IL-2 which further enhances T cell responses. Activated macrophages can secrete interleukin 10 (IL-10) which can deactivate activated macrophages to become infected macrophages.
Figure 1.
Activated and infected macrophages present antigen to T cells via MHC molecules and, in combination with IL-12, stimulate CD4+ and CD8+ T cells to secrete IFN-γ; IFN-γ activates infected macrophages and enables them to control infection.
2.1 The model equations
Bacterial dynamics
The equations for bacterial dynamics are given by Eqs. (1)-(3).
| (1) |
| (2) |
| (3) |
Explanation
Bacteria inside the infected macrophages grow at a maximal rate of αI, reduced by a logistic Hill kinetics with a parameter depending on the maximal carrying capacity of N bacteria in an infected macrophage. A resting macrophage becomes infected at an assumed threshold of n3 bacteria, and hence, it represents a gain term for the intracellular bacteria. The third term on the right-hand side of Eq. (1) accounts for the release of intracellular bacteria due to lysis (burst) of infected macrophages. The fourth and fifth terms represent the exchange between BI and BA due to activation of infected macrophages by IFN-γ and deactivation of activated macrophages by IL-10. In Eq. (2), bacteria inside the activated macrophages grow at a maximal rate of αA and lose n2 bacteria on average at a rate of μMA due to death of their host macrophage. In Eq. (3), extracellular bacteria grow at a rate of αE and are taken up by activated macrophages at a rate of k5. Following an experimental infection with M. tuberculosis, we have previously shown that uptake of bacteria is the same for old and young mice [26].
Macrophage dynamics
The equations describing the rates of changes for macrophage populations are given by Eqs. (4)-(5).
| (4) |
| (5) |
Explanation
In Eq. (4) the first term accounts for infection of resting macrophages; the second term accounts for bursting of infected macrophages; the remaining three terms account for activation of infected macrophages by IFN-γ, deactivation of activated macrophages by IL-10, and the death of infected macrophages. The first two terms in Eq. (5) are exchanges with infected macrophages, and the last term accounts for activation of resting macrophages by extracellular bacteria in the presence of IFN-γ.
Cytokine dynamics
The equations of cytokine dynamics are given by Eqs. (6)-(9).
| (6) |
| (7) |
| (8) |
| (9) |
Explanation
IL-10 and IL-12 are produced by infected and activated macrophages at rates of k7 and k8, respectively, but both processes are inhibited by IL-10. In addition, IL-12 is produced by resting macrophages in response to infection at a rate of k9. In old mice, increased IL-12 is detected in the lung early after infection with M. tuberculosis [26]. IL-2 is secreted by CD4+ T cells and is consumed by activated CD4+ and CD8+ T cells. IL-2 secretion by CD4+ T cells is reportedly decreased in old age [8], [11]. IFN-γ is secreted by CD4+ and CD8+ T cells in the presence of IL-12; this production is time-dependent. In young mice, antigen specific IFN-γ production by CD4+ and CD8+ T cells is detectable 2 weeks after infection, and reaches a maximal level after 3 weeks.
In old mice, CD8+. T cells can secrete IFN-γ in an antigen dependent manner which is dependent on IL-12 [26]. Furthermore, increased IFN-γ is detected within the lungs of old mice early after infection with M. tuberculosis [26]. Therefore, CD8+ T cells derived IFN-γ is reported as early as 2 weeks post infection. Based upon experimental evidence [23], antigen dependent IFN-γ production by CD8+ and CD4+ T cells is not detected until the third week of infection in old mice and IFN-γ production in young mice is somewhat higher than that of old mice.
T cell dynamics
T cell densities evolve by Eqs. (10)-(11).
| (10) |
| (11) |
Explanation
We do not write explicitly the concentration of MHCI, MHCII in Eqs. (10)-(11), since we assume that they are uniformly distributed on the membrane of macrophages and thus depend only on t. Hence, we take the rate of MHCII activation to be a time dependent function λz(t). Similarly, we take the rate of MHCI activation to be a time dependent function λx(t). IL-12 combined with antigen presented in the context of MHCII stimulates CD4+ T cells to proliferate, thereby expanding the CD4+ T cell population. IL-12 combined with MHCI/antigen increases the number of CD8+ T cells.
3 Parameter values
Table 2 lists the model parameters and their explanation. Table 3 gives the parameter values of the differential equations (1)-(11) for young and old mice. The last column gives the reference to experimental data. When no such data are available, we estimated the parameters and made adjustments to align with experimental results reported in [23], [26], [27], [28], [9]. Our numerical simulations start at day 7 of infection; they will be discussed in the next section.
Table 2.
Model parameters and their explanation.
| αI | growth rate of BI |
| αE | growth rate of BE |
| αA | growth rate of BA |
| k1 | rate of infection of resting macrophages |
| k2 | burst rate of infected macrophages |
| k3 | activation rate of infected macrophages |
| k4 | deactivation rate of activated macrophages |
| k5 | take up of BE by activated macrophages |
| k6 | rate of activation of resting macrophages |
| k7 | IL-10 production rate by infected macrophages |
| k8 | IL-12 production rate by activated macrophages |
| k9 | IL-12 production rate by resting macrophages |
| k10 | IL-2 production rate by T4 |
| k11 | loss of IL-2 due to proliferation of T4 |
| k12 | loss of IL-2 due to proliferation of T8 |
| k13 | rate of proliferation of T4 by IL-2 |
| k14 | rate of proliferation of T8 by IL-2 |
| c1 | saturation for infection of resting macrophages |
| c2 | saturation for activation of infected macrophages |
| c3 | IFN-γ inhibition for deactivation of activated macrophages |
| c4 | saturation for deactivation of activated macrophages |
| c5 | TB saturation for activation of resting macrophages |
| c6 | IFN-γ saturation for activation of resting macrophages |
| c7 | saturation for IL-10 inhibition by IL-10 |
| c8 | saturation for IL-12 inhibition by IL-10 |
| c9 | saturation for IL-12 production by resting macrophages |
| c10 | saturation for T cell proliferation by IL-2 |
| c11 | saturation for IFN-γ production by T cells and IL-12 |
| N | maximal carrying capacity of an infected macrophage |
| n1 | average number of BI in an infected macrophage |
| n2 | average number of BA in an activated macrophage |
| n3 | threshold at which a resting macrophage becomes infected |
| μMA | death rate of activated macrophages |
| μMI | death rate of infected macrophages |
| μ10 | decay rate of IL-10 |
| μ12 | decay rate of IL-12 |
| μ2 | decay rate of IL-2 |
| μγ | decay rate of IFN-γ |
| μT4 | death rate of T4 |
| μT8 | death rate of T8 |
| *λu | rate of IFN-γ production by T4 |
| *λy | rate of IFN-γ production by T8 |
| *λz | rate of MHCII activation |
| *λx | rate of MHCI activation |
Table 3.
Parameter values for young and old mice. The abbreviation u. o. stands for unpublished observations.
| coeffcient | young | old | source |
|---|---|---|---|
| αI | 0.5 day−1 | 0.5 day−1 | [13] |
| αE | 0 day−1 | 0 day−1 | [13] |
| αA | 0 day−1 | 0 day−1 | this work |
| k1 | 0.4 day−1 | 0.4 day−1 | this work |
| k2 | 0.81139 day−1 | 0.81139 day−1 | this work |
| k3 | 0.023415 day−1 | 0.025440 day−1 | [26] |
| k4 | 0.28876 day−1 | 0.61707 day−1 | [13] |
| k5 | 8.1301 ×10⁻⁵ ml/cell day | 8.1301 ×10⁻⁵ ml/cell day | this work |
| k6 | 0.077068 day−1 | 0.13539 day−1 | [26] |
| k7 | 0.50610 pg/ml cell | 0.55044 pg/ml cell | this work |
| k8 | 0.28503 pg/cell day | 0.53162 pg/cell day | this work |
| k9 | 5 × 10⁻⁴ pg/cell day | 0.001 pg/cell day | [26] |
| k10 | 2.1873 ×10⁻⁴ pg/cell day | 1.7301 ×10⁻⁴ pg/cell day | [4] |
| k11 | 1.6383 ×10⁻⁴ pg/cell day | 1.4788 ×10⁻⁴ pg/cell day | this work |
| k12 | 1.6383 ×10⁻⁵ pg/cell day | 1.413 ×10⁻⁵ pg/cell day | this work |
| k13 | 0.1638 ml/pg day | 0.14789 ml/pg day | [8] |
| k14 | 0.01638 ml/pg day | 0.01413 ml/pg day | [8] |
| c1 | 106 cell/ml | 106 cell/ml | [13] |
| c2 | 50 pg/ml | 50 pg/ml | this work |
| c3 | 3 | 3 | this work |
| c4 | 1 pg/ml | 1 pg/ml | [13] |
| c5 | 105 cell/ml | 105 cell/ml | [13] |
| c6 | 20 pg/ml | 20 pg/ml | this work |
| c7 | 5000 pg/ml | 5000 pg/ml | this work |
| c8 | 200 pg/ml | 200 pg/ml | this work |
| c9 | 5000 cell/ml | 5000 cell/ml | [13] |
| c10 | 50 pg/ml | 50 pg/ml | this work |
| c11 | 50 cell/ml | 50 cell/ml | this work |
| MR | 5 ×10⁵ cell/ml | 5 ×10⁵ cell/ml | u. o. |
| N | 25 | 25 | u. o. & [13] |
| n1 | 20 | 20 | u. o. |
| n2 | 5 | 5 | u. o. |
| n3 | 10 | 10 | u. o. |
| μMA | 0.015 day−1 | 0.015 day−1 | u. o. |
| μMI | 0.2 day−1 | 0.2 day−1 | u. o. |
| μ10 | 7.23 day−1 | 7.23 day−1 | [13] |
| μ12 | 1.188 day−1 | 1.188 day−1 | [13] |
| μ2 | 1.188 day−1 | 1.188 day−1 | u. o. |
| μγ | 3 day−1 | 3 day−1 | [13] |
| μT4 | 0.33 day−1 | 0.33 day−1 | [13] |
| μT8 | 0.33 day−1 | 0.33 day−1 | [13] |
| *λu | 1.24 ×10⁻⁴ pg/cell day | 1.24 ×10⁻⁴ pg/cell day | [29] & this work |
| *λy | 1.24 ×10⁻⁵ pg/cell day | 1.24 ×10⁻⁴ pg/cell day | this work |
| *λz | 0.010532 ml/pg day | 0.010532 pg/cell day | this work |
| *λx | 0.005266 ml/pg day | 0.0022854 pg/cell day | this work |
The death rates of macrophages (μMI, μMA) are based on the assumption that the life span of infected macrophages is 7 days, and 90 days for activated macrophages. Bacteria inside infected macrophages are assumed to divide every 24 hours. The parameters in the last four rows of Table 3 are labelled with a ‘star’ to indicate that these are the base values for the time-dependent coefficients λu(t), λy(t), λz(t), λx(t), namely, their values after 3 weeks of infection.
Some of the parameters listed in Table 3 differ for young and old mice. These differences are based on experimental evidence as cited, extrapolated from experimental evidence from non-infectious studies, or unpublished observations. The percentage difference between the parameters for old and young mice is based upon experimental data (when available) or extrapolated for the best fit (range 10%-130%).
Activation of resting macrophages by IFN-γ in response to infection is larger for old mice (k3,o > k3,y). This increase is based upon the early and increased production of IFN-γ and IL-12 and in the lungs of old mice in response to infection (ref. [26]), and unpublished observations demonstrating that macrophages from the lungs of old mice secrete more IL-12 upon infection with M. tuberculosis in vitro (data not shown).
The production rate of IL-10 by infected macrophages and the production rate of IL-12 by activated macrophages is larger for old mice (k7,o > k7,y and k8,o > k8,y). The production rate of IL-12 by resting macrophages in response to infection is larger for old mice (k9,o > k9,y)( [26] and unpublished observations).
The production rate of IL-2 by CD4+ T cells is larger for young mice (k10,o < k10,y)([4]). Deficiencies in IL-2 production in old age have been well documented in the literature [8], [11] and reduced IL-2 production has been observed in M. tuberculosis infected old mice (unpublished observations).
IL-2 is lost as it is consumed by activated CD4+ and CD8+ T cells and this loss is larger for young mice (k11,o < k11,y), due to the increased number of activated T cells present within the lung. In addition, CD+ and CD8+ T cell numbers are enhanced by IL-2, and this gain is larger for young mice (k13,o < k13,y and k14,o < k14,y) ([8]).
The rate of IFN-γ production by CD8+ T cells is λy(t) and the rate of IFN-γ production by CD4+ T cells is λu(t). The profile of λy(t) and λu(t) for young and old mice is shown in Figure 2. CD8+ T cell derived IFN-γ is initially greater in old mice, as demonstrated experimentally [26]. However, antigen independent secretion of IFN-γ is transient and subsequently dissipates. At this time, young mice have generated antigen specific CD8+ T cells that can secrete IFN-γ. In contrast, the generation of antigen specific CD8+ T cells is delayed in old age ([14] and unpublished observations). Therefore, at the end of week 2 of infection in old mice, the production of IFN-γ falls off significantly, with a slight overshoot.
Figure 2.
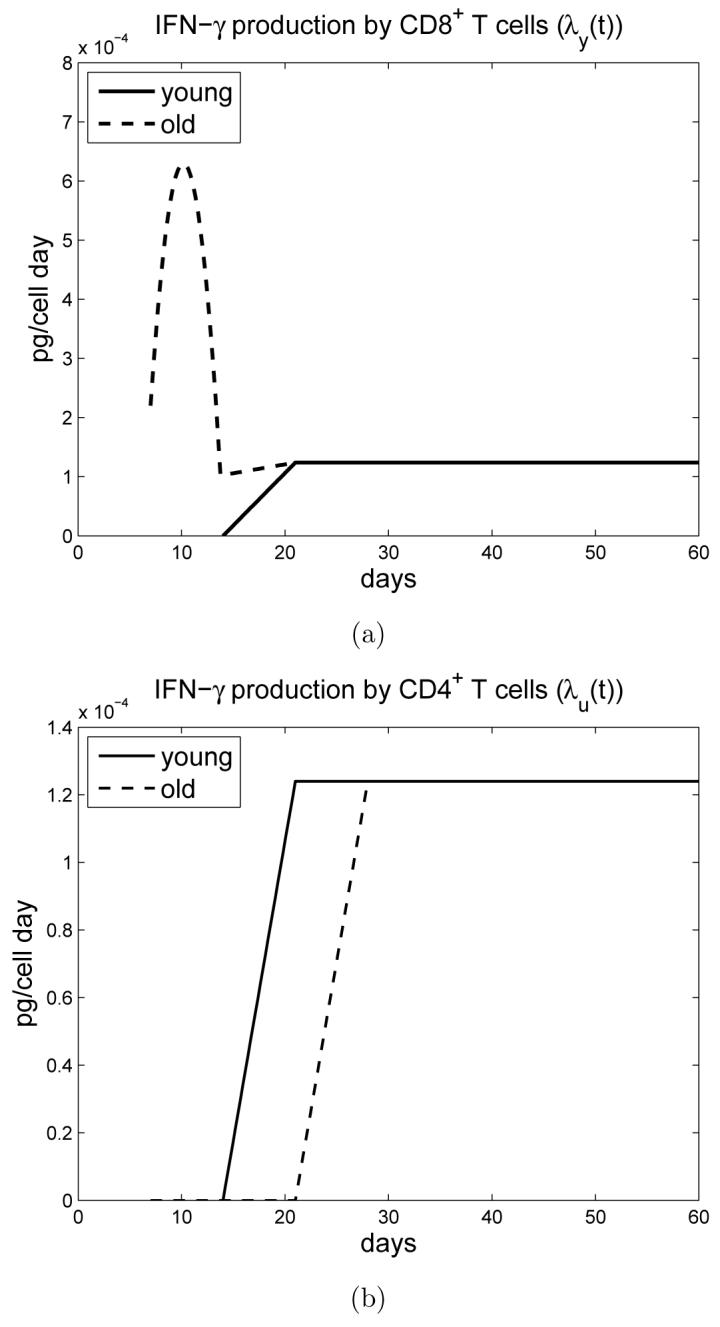
a) Time-dependent IFN-γ production rate λy(t) by CD8+ T cells for young and old mice. b) Time-dependent IFN-γ production rate λu(t) by CD4+ T cells for young and old mice.
The rate of IFN-γ production by CD4+ T cells is λu(t). For old mice, CD4+ T cells start producing antigen specific IFN-γ at day 21 and, for young mice, at day 14, reflecting the delay in generation of antigen specific immunity in old mice [23]. The rate for IFN-γ production in young mice stabilizes after day 21, whereas for old mice, there is an additional one week delay. These data have been verified experimentally [23].
Macrophages within the lung can present antigen throughout infection, however the generation of IFN-γ, and expansion of T cells, is dependent on antigen specific T cells being present within the lung. Here we link the antigen specific response to MHC. Hence, we take the time-dependent MHC activation rates λz(t) and λx(t) to be zero before day 14 (or day 21 in case of λz(t) for old mice) and constant otherwise; see Figure 2.
The bacterial load within the lungs of young and old mice is initially different. Early during infection old mice have more IFN-γ and IL-12 within the lung which leads to enhanced macrophage activation. Activation of macrophages for old mice is greater during the first 10-14 days. Hence, initially the number of activated macrophages is larger and the number of infected macrophages is lower for old mice. As described above, cytokine production (IL-12 and IFN-γ) in aged mice is elevated, with the exception of IL-2. This early activation results in an early reduction of the bacteria load in the lung compared to young mice. Hence, we take the total number of bacteria at day 7 to be lower for old mice.
4 Simulation Results
In this section we describe simulation results based on our model and compare these results with experimental measurements. The simulation results did not change qualitatively if the average numbers of bacteria (n1, n2 and n3) inside the macrophages were either increased by up to 100% or decreased by 50%.
Figure 3 simulates the bacterial load for both young and old mice. Because old mice have an early burst of IFN-γ /IL-12 in response to infection, leading to macrophage activation, the bacterial load is initially smaller for old mice. After 21 days, however, this reverses and the bacterial load for old mice becomes larger. This cross-over is accounted for by the delayed generation of antigen specific CD4+ and CD8+ T cell responses in old mice and continued growth of M. tuberculosis in the lung. Both loads stabilize after 45 days and, due to the delayed antigen specific responses, the bacterial load for old mice remains twice as high as for young mice. The extracellular bacteria are approximately 5% of the total load (not shown here). The simulation results agree with experimental measurements in [23], [26], [4].
Figure 3.
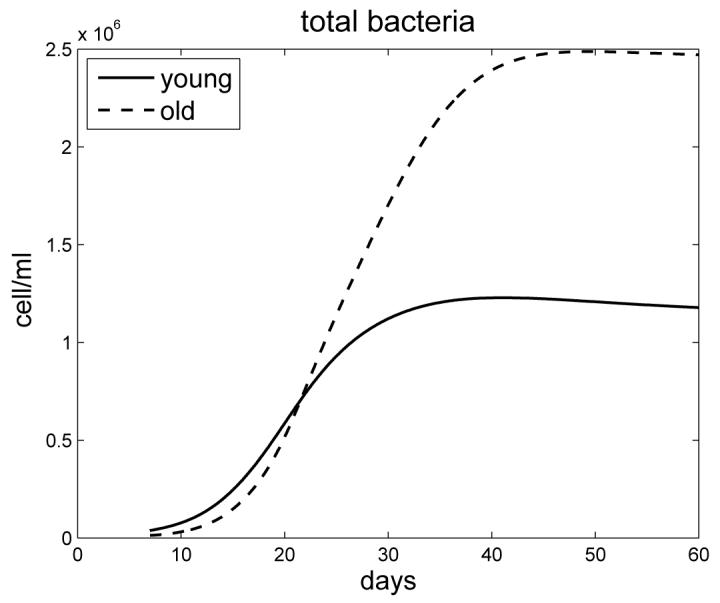
The bacterial load for young and old mice
Figure 4 simulates the profile of infected and activated macrophages for young and old mice. Initially there are more activated macrophages in the lungs of old mice (in response to enhanced IFN-γ). However this later becomes reversed as antigen specific responses are generated in young mice, resulting in more activated macrophages in the lungs of young mice up to day 30 of infection; thereafter the number of macrophages in the lungs of old mice again becomes increased. Both densities stabilize after 40 days of infection. The density profiles of infected macrophages for young and old mice intersect in a similar manner to the profiles of the bacterial load. Experimental data is unavailable for these profiles, however based upon the equations and bacterial load described above we can predict that old mice will accumulate more macrophages within the lung than young mice as infection progresses.
Figure 4.
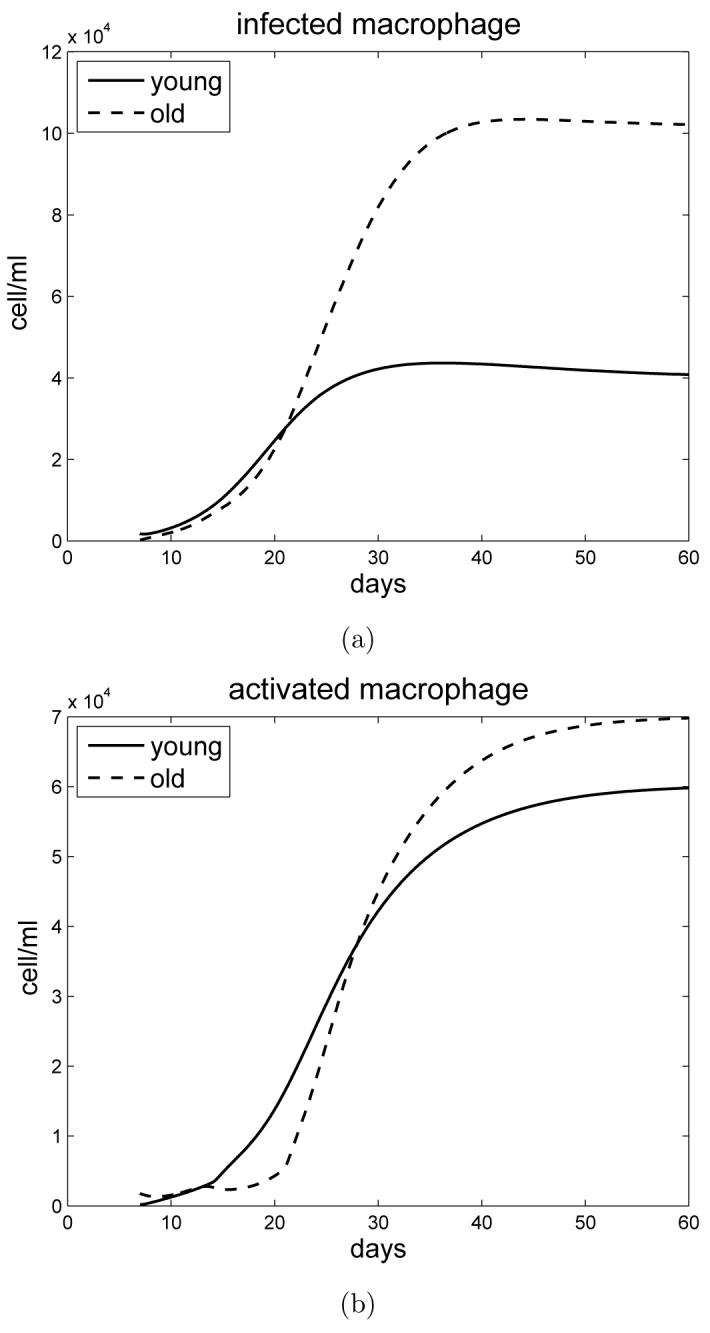
a) Simulation of infected macrophages in young and old mice. b) Simulation of activated macrophages in young and old mice.
Figure 5 shows the concentration of IFN-γ for young and old mice. Old mice initially have more IFN-γ within the lungs, attributed to enhanced CD8+ T cell activity, which models experimental observations in [23] and [26]. This early response creates a ’bump’ in the graph. Note that this early activity by CD8+ T cells does not correlate to an increase in cells numbers for this subset. Responsiveness is independent of CD8+ T cell proliferation and considered to be enhanced activity of a resident activated cell population within the lungs of old mice [26]. This early response is transient, after which the source of IFN-γ is antigen specific CD4+ and CD8+ T cells. The delay in generation of antigen specific immunity in old mice leads to a cross-over between young and old mice at approximately 30-40 days, which is in line with experimental observations [23] and [26].
Figure 5.
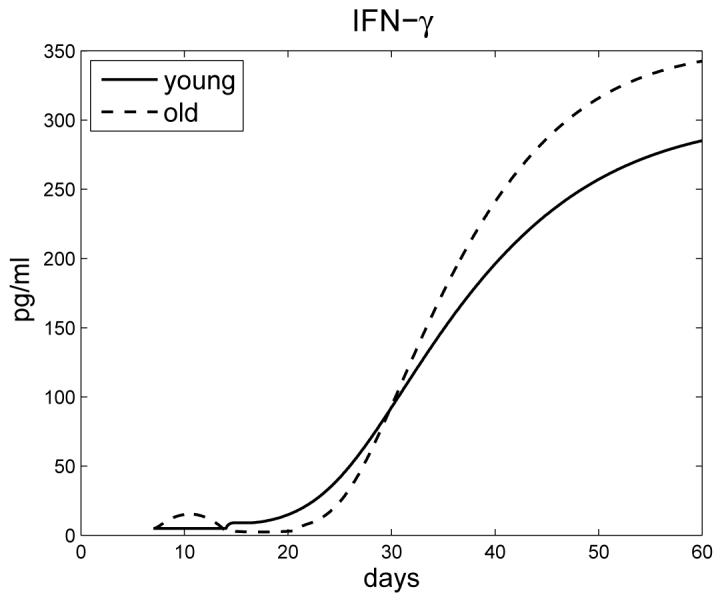
Concentration of IFN-γ in young and old mice.
Figure 6 shows IL-12 levels, with a significant early increase in IL-12 production by old mice compared to young, which has been observed experimentally in [26].
Figure 6.
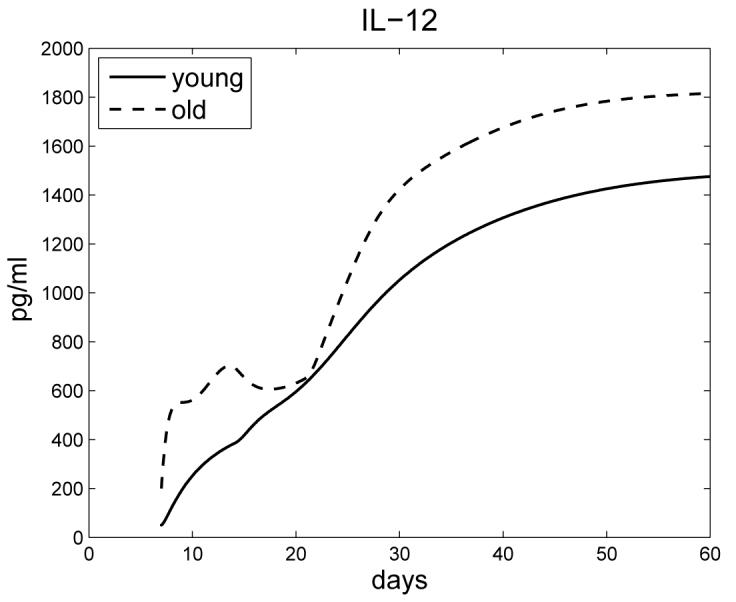
Concentration of IL-12 in young and old mice.
Figure 7 shows that the IL-2 concentration in old mice is less than in young mice; this has been experimentally verified in [4], in conjunction with data in [8].
Figure 7.
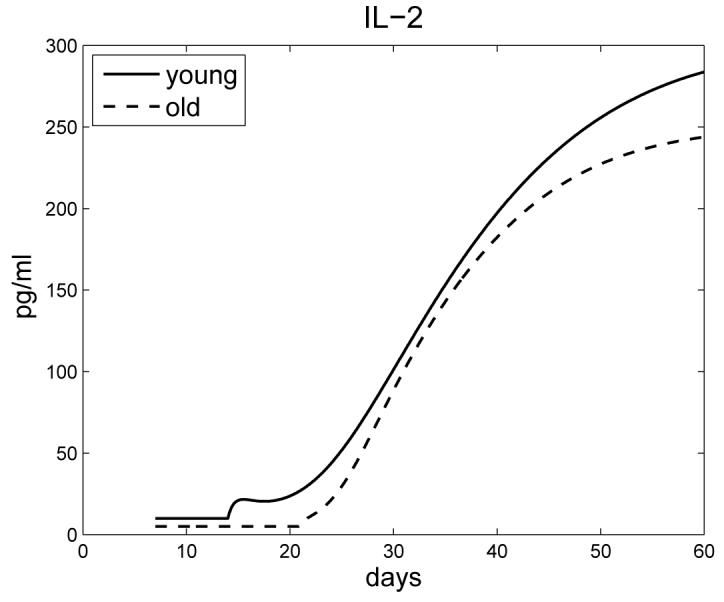
The profile of IL-2 for young and old mice.
Figure 8 shows the densities of T cells for young and old mice. Both profiles stabilize around day 60. Based upon experimental data [23], the density of CD8+ T cells for old mice is always less than for young mice. However, for CD4+ T cells there is a crossover: old mice initially have fewer CD4+ T cells during the first 28-40 days of infection. This is a consequence of delayed/defective generation of antigen specific immunity specifically within the CD4+ T cell subset ([23], [13] and unpublished observations). This agrees with measurements given in [24], [23], and [26].
Figure 8.
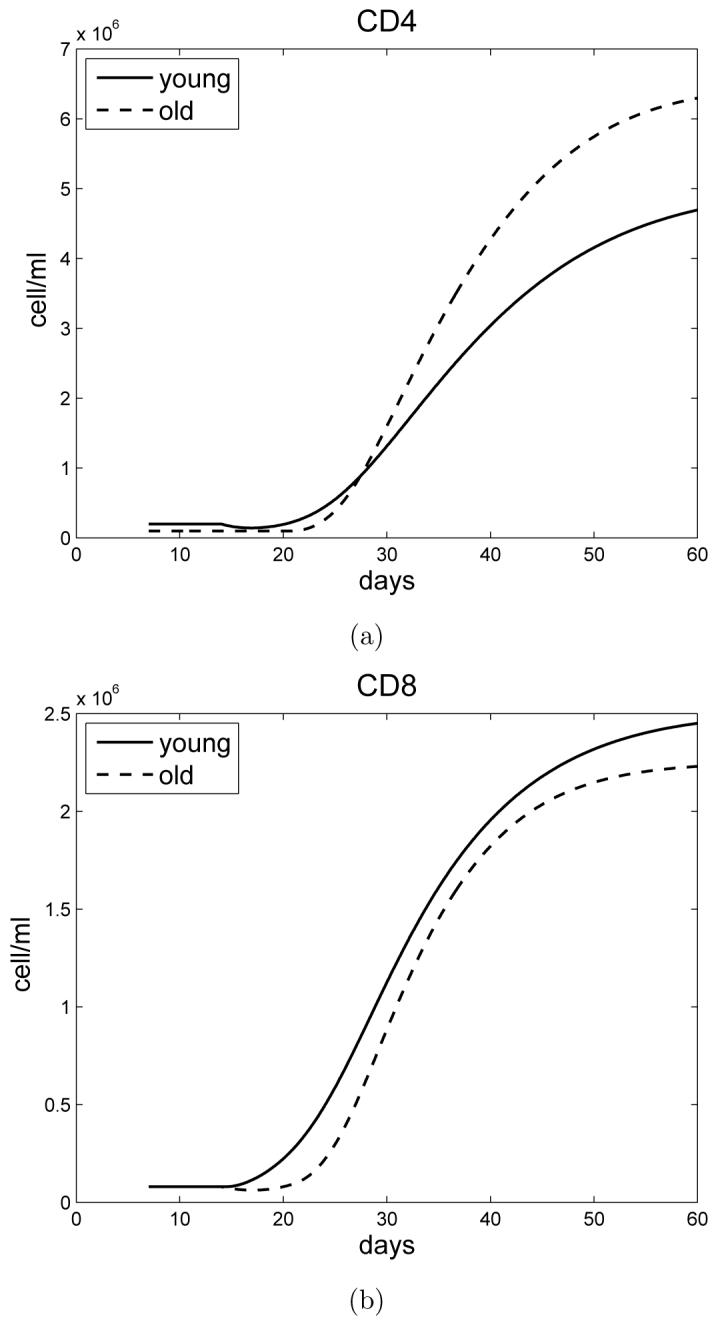
a) The densities of CD4+ T cells in young and old mice. b) The densities of CD8+ T cells in young and old mice.
The profile of IL-10 (not shown here) has the same features as in Figure 3, namely, initially it is lower in old mice, but eventually increases to levels above that seen in young mice.
5 Simulation Experiments
The model that we have developed corroborated experimental data. We therefore used our model to determine whether immunity against M. tuberculosis infection in old mice could be enhanced if CD4+ T cell numbers/function were increased. In our first experiment, we increased IL-2 driven proliferation and determined the bacterial load within the lung. Increasing k13 by 25%, 50% and 70% resulted in a reduction of the bacterial load within the lungs of old mice of 3%, 9%, and 24% respectively (Figure 9 a)). For young mice this reduction was more considerable. Increasing k13 by 20%, 40% and 46% resulted in a reduction of the bacterial load by 5%, 19%, and 38% respectively (data not shown).
Figure 9.
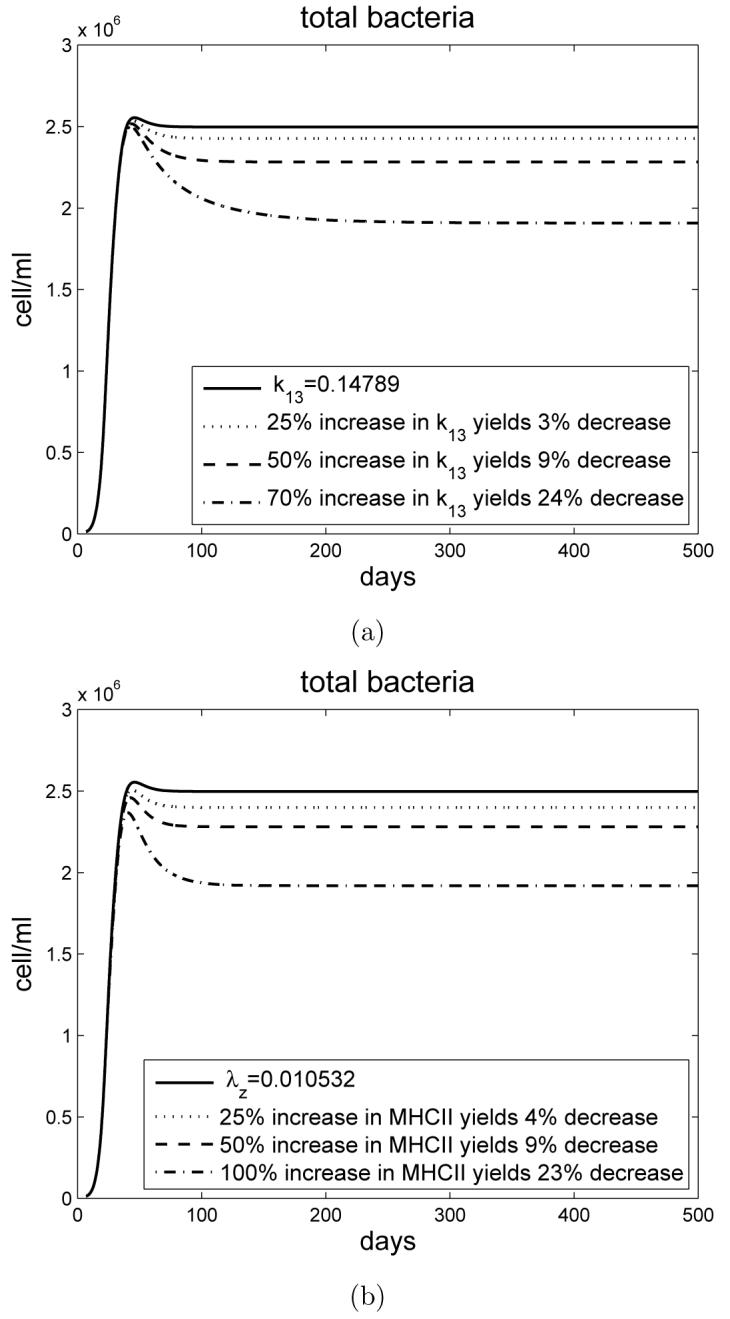
a) Simulation experiment for old mice with varying the rate of proliferation of CD4+ T cells by IL-2. The bacterial load decreases as the rate of k13 activation is increased. b) Simulation experiment for old mice with varying the rate of MHCII activation. The bacterial load decreases as the rate of MHCII activation is increased.
The second experiment determined the effect of increasing the activation status of CD4+ T cells for old mice by increasing the rate λz of MHCII activation. Increasing λz by 25%, 50% and 100% resulted in a reduction of the bacterial load by 4%, 9% and 23% respectively (Figure 9 b)). Similarly to the above, increasing the activation rate of CD4+ T cells in young mice led to a more profound effect. Increasing λz by 20%, 40% and 70% resulted in a reduction of the bacterial load by 6%, 13%, and 42% respectively (data not shown).
Our simulations therefore demonstrate that protective immunity can be enhanced in old mice by increasing the activation status or proliferation of CD4+ T cells within the lung, leading to improved antigen specific T cell IFN-γ production and macrophage activation. In contrast to young mice however, the decrease in bacterial load within the lungs of old mice was moderate suggesting that other age-associated defects contribute to failing immunity in old age.
6 Conclusions
The elderly are more susceptible to many infectious diseases, including tuberculosis [2], [17], [18], [21], [25]. Increasing susceptibility is highly associated with the loss or delay in the generation of antigen specific CD4+ T cell mediated immunity [8], [11]. For tuberculosis, where antigen specific CD4+ T cell derived IFN-γ is essential [5], such a loss can lead to a significant delay or failure to control infection. The murine model has been an essential tool for the determination of immune function during infection with M. tuberculosis. Infection is initiated when M. tuberculosis bacillus enters resting macrophages within the lung, stimulating macrophages to secrete IL-12 and present antigen to CD4+ and CD8+ T cells in the context of MHC molecules [5]. Specific interactions between macrophages and T cells leads to the secretion of IFN-γ by T cells which activate macrophages to control or kill M. tuberculosis [5]. This mechanism prevents mycobacterial replication and each activated macrophage contains a small number of mycobacteria. A failure to adequately activate macrophages leads to infected macrophages that harbor replicating mycobacteria which can eventually burst and release M. tuberculosis into the extracellular environment [5]. In young mice, antigen specific T cell secretion of IFN-γ is required to activate macrophages. IFN-γ can be derived from CD4+ or CD8+ T cells; however CD4+ T cell responses always dominate. The generation of antigen specific T cells in young mice requires 2-3 weeks to be detected within the lung after which T cell IFN-γ production stabilizes in parallel to the bacterial load [5]. In contrast, old mice fail to generate antigen specific T cell responses within the lung until 3-4 weeks after infection, which results in an increased bacterial load within the lung at this time [23], [4]. This altered response is a result of age associated changes in T cell function [8], [11] leading to a delay in or suboptimal generation of immunity. Changes in T cell function with increasing age are partly a result of thymic atrophy, leading to reduced output of naive T cells in addition to an increase in homeostatic (or antigen) driven expansion of T cells with an effector/memory phenotype [7].
Interestingly, old mice possess a resident population of CD8+ T cells within the lung that can respond independent of antigen and secrete IFN-γ early after infection [26]. IFN-γ secreting CD8+ T cells reside within a population of activated (CD44hi) cells that are likely to be specific for a previously encountered antigen and respond during M. tuberculosis infection in a bystander fashion [1], [12]. Antigen independent IFN-γ secretion activates macrophages and facilitates early control of infection (initially more activated versus infected macrophages). This response is transient, and the requirement for antigen specific CD4+ T cell IFN-γ is absolute (leading to more infected versus activated macrophages and a higher bacterial burden later). This early innate immune response, in combination with a delayed generation of acquired immunity, leads to a cross-over in the lung bacterial loads. Early infection is associated with fewer bacteria in the lungs of old mice, whereas the delayed generation of acquired immunity results in an eventual increase in the bacterial load compared to young mice [26], as shown in the simulations. The simulations predict that, compared to young mice, old mice will have increased numbers of infected macrophages, CD4+ T cells, and IL-12 within the lung as infection progresses. These predictions can now be validated experimentally using the aged mouse model. The model therefore predicts that old mice succumb to tuberculosis because of overwhelming pulmonary inflammation and cellular involvement (not simply increased bacterial load). Unpublished observations in the laboratory support these predictions. Furthermore, our simulations demonstrate improving the local interaction of CD4+ T cells with antigen presenting cells, or increasing the availability of IL-2 within the lung, has a positive outcome on the course of infection. These findings could have significant consequences on how therapeutic vaccines or therapies are used in the elderly.
Acknowledgement
The project described was supported by the National Science Foundation upon agreement O112050, and, Grant Number R01AG-021097 from the National Institute On Aging. The content is solely the responsibility of the authors and does not necessarily represent the official view of the National Institute On Aging or the National Institute of Health.
Footnotes
Publisher's Disclaimer: This is a PDF file of an unedited manuscript that has been accepted for publication. As a service to our customers we are providing this early version of the manuscript. The manuscript will undergo copyediting, typesetting, and review of the resulting proof before it is published in its final citable form. Please note that during the production process errors may be discovered which could affect the content, and all legal disclaimers that apply to the journal pertain.
References
- 1.Berg RE, Crossley E, et al. Memory CD8+ T cells provide innate immune protection against Listeria monocytogenes in the absence of cognate antigen. J. Exp. Med. 2003;198(10):1583–93. doi: 10.1084/jem.20031051. [DOI] [PMC free article] [PubMed] [Google Scholar]
- 2.Centers for Disease Control and Prevention . Reported tuberculosis in the United States. Atlanta, GA: 2005. [Google Scholar]
- 3.Cooper AM, Magram J, Ferrante J, Orme IM. Interleukin 12 (IL-12) is crucial to the development of protective immunity in mice intravenously infected with Mycobacterium tuberculosis. J. Exp. Med. 1997;186(1):39–45. doi: 10.1084/jem.186.1.39. [DOI] [PMC free article] [PubMed] [Google Scholar]
- 4.Cooper AM, Callahan JE, Griffin JP, Roberts AD, Orme IM. Old mice are able to control low-dose aerogenic infections with Mycobacterium tuberculosis. Infect. Immun. 1995;63(9):3259–65. doi: 10.1128/iai.63.9.3259-3265.1995. [DOI] [PMC free article] [PubMed] [Google Scholar]
- 5.Flynn JL, Chan J. Immunology of tuberculosis. Annu. Rev. Immunol. 2001;19:93–129. doi: 10.1146/annurev.immunol.19.1.93. [DOI] [PubMed] [Google Scholar]
- 6.Flynn JL, Chan J, Triebold KJ, Dalton DK, Stewart TA, Bloom BR. An essential role for interferon gamma in resistance to Mycobacterium tuberculosis infection. J. Exp. Med. 1993;178(6):2249–54. doi: 10.1084/jem.178.6.2249. [DOI] [PMC free article] [PubMed] [Google Scholar]
- 7.Globerson A, Effros RB. Ageing of lympocytes and lymphocytes in the aged. Immunology Today. 2000;21(10):215–220. doi: 10.1016/s0167-5699(00)01714-x. [DOI] [PubMed] [Google Scholar]
- 8.Haynes L, Linton PJ, Eaton SM, Tonkonogy SL, Swain SL. Interleukin 2, but not other common gamma chain-binding cytokines, can reverse the defect in generation of CD4 effector T cells from naive T cells of aged mice. J. Exp. Med. 1999;190(7):1013–24. doi: 10.1084/jem.190.7.1013. [DOI] [PMC free article] [PubMed] [Google Scholar]
- 9.Junqueira-Kipnis AP, Turner J, Gonzalez-Juarrero M, Turner OC, Orme IM. Stable T-cell population expressing an effector cell surface phenotype in the lungs of mice chronically infected with Mycobacterium tuberculosis. Infection and Immunology. 2004;72(1):570–575. doi: 10.1128/IAI.72.1.570-575.2004. [DOI] [PMC free article] [PubMed] [Google Scholar]
- 10.Levin M, Newport MJ, et al. Familial disseminated atypical mycobacterial infection in childhood: a human mycobacterial susceptibility gene? Lancet. 1995;345(8942):79–83. doi: 10.1016/s0140-6736(95)90059-4. [DOI] [PubMed] [Google Scholar]
- 11.Linton PJ, Haynes L, Tsui L, Zhang X, Swain S. From naive to effector–alterations with aging. Immunol Rev. 1997;160:9–18. doi: 10.1111/j.1600-065x.1997.tb01023.x. [DOI] [PubMed] [Google Scholar]
- 12.Lertmemongkolchai G, Cai G, et al. Bystander activation of CD8+ T cells contributes to the rapid production of IFN-gamma in response to bacterial pathogens. J. Immunol. 2001;166(2):1097–105. doi: 10.4049/jimmunol.166.2.1097. [DOI] [PubMed] [Google Scholar]
- 13.Orme IM. Aging and immunity to tuberculosis: increased susceptibility of old mice reflects a decreased capacity to generate mediator T lymphocytes. J. Immunol. 1987;138(12):4414–8. [PubMed] [Google Scholar]
- 14.Orme IM, Griffin JP, Roberts AD, Ernst DN. Evidence for a defective accumulation of protective T cells in old mice infected with Mycobacterium tuberculosis. Cell Immunol. 1993;147(1):222–9. doi: 10.1006/cimm.1993.1062. [DOI] [PubMed] [Google Scholar]
- 15.Orme IM. The kinetics of emergence and loss of mediator T lymphocytes acquired in response to infection with Mycobacterium tuberculosis. J. Immunol. 1987;138(1):293–8. [PubMed] [Google Scholar]
- 16.van Pinxteren LA, Cassidy JP, Smedegaard BH, Agger EM, Andersen P. Control of latent Mycobacterium tuberculosis infection is dependent on CD8 T cells. Eur. J. Immunol. 2000;30(12):3689–98. doi: 10.1002/1521-4141(200012)30:12<3689::AID-IMMU3689>3.0.CO;2-4. [DOI] [PubMed] [Google Scholar]
- 17.Rajagopalan S. Tuberculosis and aging: a global health problem. Clin. Infect. Dis. 2001;33(7):1034–9. doi: 10.1086/322671. [DOI] [PubMed] [Google Scholar]
- 18.Rajagopalan S, Yoshikawa TT. Tuberculosis in long-term-care facilities. Infect. Control. Hosp Epidemiol. 2000;21(9):611–5. doi: 10.1086/501816. [DOI] [PubMed] [Google Scholar]
- 19.Sud D, Bigbee C, Flynn JL, Kirschner DE. Contribution of CD8+ T cells to control of Mycobacterium tuberculosis infection. The Journal of Immunology. 2006;176:4296–4314. doi: 10.4049/jimmunol.176.7.4296. [DOI] [PubMed] [Google Scholar]
- 20.Serbina NV, Flynn JL. Early emergence of CD8(+) T cells primed for production of type 1 cytokines in the lungs of Mycobacterium tuberculosis-infected mice. Infect. Immun. 1999;67(8):3980–8. doi: 10.1128/iai.67.8.3980-3988.1999. [DOI] [PMC free article] [PubMed] [Google Scholar]
- 21.Schultz M, Hernandez JM, et al. Onset of tuberculosis disease: new converters in long-term care settings. Am. J. Alzheimers Dis. Other. Demen. 2001;16(5):313–8. doi: 10.1177/153331750101600507. [DOI] [PMC free article] [PubMed] [Google Scholar]
- 22.Turner J, Gonzalez-Juarrero M, Ellis DL, Basaraba RJ, Kipnis A, Orme IM, Cooper AM. In vivo IL-10 production reactivates chronic pulmonary tuberculosis in C57BL/6 mice. J. Immunol. 2002;169(11):6343–51. doi: 10.4049/jimmunol.169.11.6343. [DOI] [PubMed] [Google Scholar]
- 23.Turner J, Frank AA, Orme IM. Old mice express a transient early resistance to pulmonary tuberculosis that is mediated by CD8 T cells. Infect. Immun. 2002;70(8):4628–37. doi: 10.1128/IAI.70.8.4628-4637.2002. [DOI] [PMC free article] [PubMed] [Google Scholar]
- 24.Turner J, Orme IM. The expression of early resistance to an infection with Mycobacterium tuberculosis by old mice is dependent on IFN type II (IFN-γ) but not IFN type I. Mech. Ageing Dev. 2004;125(1):1–9. doi: 10.1016/j.mad.2003.09.002. [DOI] [PubMed] [Google Scholar]
- 25.Thrupp L, Bradley S, et al. Tuberculosis prevention and control in long-term-care facilities for older adults. Infect. Control Hosp. Epidemiol. 2004;25(12):1097–108. doi: 10.1086/502350. [DOI] [PubMed] [Google Scholar]
- 26.Vesosky B, Flaherty DK, Turner J. Th1 cytokines facilitate CD8-T-cell-mediated early resistance to infection with Mycobacterium tuberculosis in old mice. Infection and Immunity. 2006;74(6):3314–3324. doi: 10.1128/IAI.01475-05. [DOI] [PMC free article] [PubMed] [Google Scholar]
- 27.Vesosky B, Flaherty DK, Rottinghaus EK, Bemaer GL, Turner J. Age dependent increase in early resistance of mice to Mycobacterium tuberculosis is associated with an increase in CD8 T cells that are capable of antigen independent IFN-γ production. Experimental Gerontology. 2006;41(11):1185–1194. doi: 10.1016/j.exger.2006.08.006. [DOI] [PubMed] [Google Scholar]
- 28.Vesosky B, Turner J. The influence of age on immunity to infection with Mycobacterium tuberculosis. Immunological Reviews. 2005;205:229–243. doi: 10.1111/j.0105-2896.2005.00257.x. [DOI] [PubMed] [Google Scholar]
- 29.Wigginton JE, Kirschner DE. A model to predict a cell-meadiated immune regulatory mechanism during human infection with Mycobacterium tuberculosis. The Journal of Immunology. 2001;166:1951–1967. doi: 10.4049/jimmunol.166.3.1951. [DOI] [PubMed] [Google Scholar]


