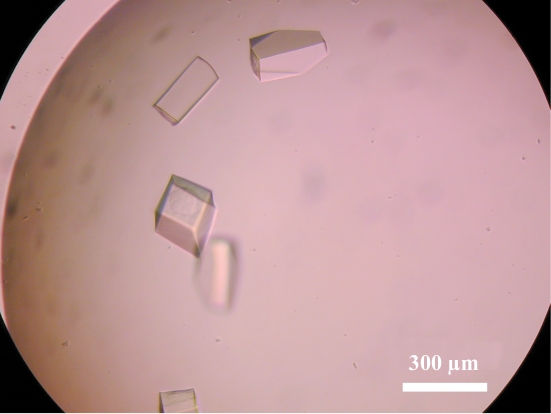
The N- and C-terminal fragments of alanyl-tRNA synthetase from the archaeon A. fulgidus have been crystallized.
Keywords: AlaRS, tRNa, alanine, editing, dimerization, Archaeoglobus fulgidus
Abstract
In order to analyze the alanyl-tRNA synthetase from the archaeon Archaeoglobus fulgidus, the N-terminal fragment lacking the dimerization domain and the C-terminal dimerization-domain fragment were each overexpressed in Escherichia coli, purified and crystallized. A 3.7 Å resolution data set was collected for the N-terminal fragment. The crystal belongs to the tetragonal space group P41 or P43, with unit-cell parameters a = b = 101.15, c = 124.24 Å. For the C-terminal fragment, a SeMet MAD data set was collected to 3.2 Å resolution. The crystal belongs to the orthorhombic space group P2221, with unit-cell parameters a = 124.15, b = 131.91, c = 138.68 Å.
1. Introduction
Aminoacyl-tRNA synthetases (aaRSs) specifically attach each cognate amino acid to the 3′-end of its cognate tRNA. For accurate protein synthesis, a high specificity of the aaRS for both the amino acid and tRNA is required. The aminoacylation reaction takes place in two steps catalyzed by the same active site: the synthesis of an aminoacyladenylate as an activated intermediate from the amino acid and ATP (1) and the transfer of the aminoacyl moiety to the 3′-terminus of the cognate tRNA to yield the aminoacyl-tRNA (aa-tRNA) (2) (Fersht & Kaethner, 1976 ▶).
AlaRS + Ala + ATP  AlaRS(Ala-AMP) + AMP + PPi (1) AlaRS(Ala-AMP) + AMP + PPi (1)
|
AlaRS(Ala-AMP) + tRNAAla Ala-tRNAAla + AMP + AlaRS (2) Ala-tRNAAla + AMP + AlaRS (2)
|
Alanyl-tRNA synthetase (AlaRS) consists of four parts: an N-terminal aminoacylation active-site domain, a tRNA-recognition module, an editing domain and a C-terminal oligomerization domain. The synthetic active site of AlaRS misrecognizes noncognate glycine and serine as well as recognizing the cognate alanine and produces Gly-tRNAAla and Ser-tRNAAla (Beebe et al., 2003 ▶; Swairjo & Schimmel, 2005 ▶). The editing domain hydrolyzes the incorrect products Gly-tRNAAla and Ser-tRNAAla and thus contributes to accurate aminoacylation (Beebe et al., 2003 ▶). tRNAAla has a characteristic G3–U70 wobble base pair in the acceptor stem. The G3–U70 base pair is used as a major identity determinant for recognition by AlaRS (Hou & Schimmel, 1988 ▶).
Crystal structures of the N-terminal fragment of the bacterial Aquifex aeolicus AlaRS, comprising the aminoacylation active-site domain and the tRNA-recognition module, have been determined in the apo form and in complex with amino acids (Swairjo et al., 2004 ▶; Swairjo & Schimmel, 2005 ▶). The structures revealed how the aminoacylation active site recognizes alanine, glycine and serine. The free-standing trans-editing enzyme AlaX shares sequence homology with the AlaRS editing domain. Crystal structures of Pyrococcus horikoshii AlaX-S have been determined in the apo form and in complex with serine (Sokabe et al., 2005 ▶; Ishijima et al., 2006 ▶). However, AlaX-S only hydrolyzes Ser-tRNAAla, not Gly-tRNAAla, unlike AlaRS, and the residues that recognize the bound serine are not conserved in AlaRS (Sokabe et al., 2005 ▶). The crystal structure of Pyrococcus horikoshii AlaX-M, which hydrolyzes both Ser-tRNAAla and Gly-tRNAAla, has been determined in its apo form (Fukunaga & Yokoyama, 2007 ▶). However, because of the lack of the substrate-bound structure, its dual-specificity recognition mechanism is still unclear. Thus, the mechanisms by which AlaRS precisely recognizes tRNAAla in the aminoacylation and editing reactions and the AlaRS editing domain recognizes both Gly-tRNAAla and Ser-tRNAAla without recognizing Ala-tRNAAla remain unknown. The spatial relationship between the N-terminal fragment and the editing domain is also unknown. This particular relationship is crucial for the translocation of the aminoacylated 3′-end of tRNA between the aminoacylation site and the editing site. In addition, the role and the manner of the oligomerization by the C-terminal oligomerization domain are unclear.
In order to clarify these mechanisms, in the present research we have carried out the crystallization and preliminary X-ray crystallographic analysis of AlaRS from the archaeon Archaeoglobus fulgidus. We have crystallized and collected the X-ray diffraction data sets of (i) A. fulgidus AlaRS lacking the C-terminal oligomerization domain and (ii) the A. fulgidus AlaRS C-terminal oligomerization domain.
2. Methods and results
2.1. Purification of in vitro transcribed A. fulgidus tRNAAla
A. fulgidus has three tRNAAla isoacceptors (tRNAAla1, tRNAAla2 and tRNAAla3; Fig. 1 ▶). The anticodon sequences of tRNAAla1, tRNAAla2 and tRNAAla3 are UGC, CGC and GGC, respectively. The three A. fulgidus tRNAAla isoacceptors were separately transcribed in vitro with T7 RNA polymerase and were purified by phenol/chloroform treatment. They were further purified by anion-exchange chromatography with a ResourceQ column using 20 mM Tris–HCl buffer pH 8.0 containing 8 mM MgCl2 and 280 mM NaCl as a starting buffer, with a linear gradient of 280–1000 mM NaCl. The tRNAAla-containing fractions were pooled, precipitated with ethanol and dried. The tRNAAla isoacceptors were dissolved in 20 mM Tris–HCl buffer pH 8.0 containing 10 mM MgCl2.
Figure 1.
Sequences of the three tRNAAla isoacceptors from A. fulgidus. Anticodons are boxed in black.
2.2. Overexpression and purification of the A. fulgidus AlaRS proteins
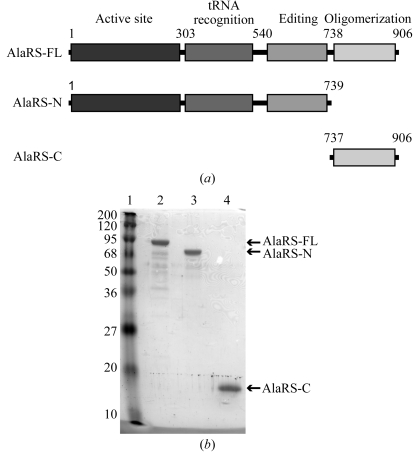
We have prepared three A. fulgidus AlaRS proteins: the full-length AlaRS (AlaRS-FL), the N-terminal fragment lacking the C-terminal oligomerization domain (AlaRS-N) and the C-terminal oligomerization domain of AlaRS (AlaRS-C) (Fig. 2 ▶ a). AlaRS-FL is composed of 906 amino-acid residues, with a molecular weight of 102.5 kDa. AlaRS-N comprises 739 amino-acid residues (1–739), with a molecular weight of 83.6 kDa. AlaRS-C includes 169 amino-acid residues (737–906) and an initiating methionine, with a molecular weight of 19.3 kDa. The gene fragments were inserted into the NdeI and SalI sites of pET26b (Novagen). The recombinant AlaRS proteins were overexpressed in Escherichia coli strain BL21 CodonPlus RIL (DE3) (Stratagene) at 310 K. Expression of the proteins was induced by adding 1 mM IPTG when the OD600 value reached 0.6–0.8. After induction, the E. coli cultures were incubated for an additional 4 h at 310 K and were harvested by centrifugation.
Figure 2.
(a) Domain organization of A. fulgidus AlaRS-FL, AlaRS-N and AlaRS-C. (b) SDS–PAGE analysis of the purified proteins. Lane 1, molecular-weight markers (kDa). Lane 2, AlaRS-FL. Lane 3, AlaRS-N. Lane 4, AlaRS-C.
AlaRS-FL and AlaRS-N were purified using the same procedure. The cells were suspended in 50 mM Tris–HCl buffer pH 8.0 containing 5 mM MgCl2, 500 mM NaCl, 10 mM dithiothreitol (DTT) and 0.5 mM phenylmethylsulfonyl fluoride (PMSF) and were then disrupted by sonication on ice. After centrifugation at 20 000g for 30 min at 277 K, the supernatants were incubated at 353 K for 30 min to denature the E. coli proteins. After centrifugation at 20 000g for 30 min at 277 K, the supernatants were dialyzed against 20 mM Tris–HCl buffer pH 8.0 containing 2 mM MgCl2, 60 mM NaCl and 1 mM DTT (buffer A) and were then loaded onto a Q-Sepharose FF column (GE Healthcare). The enzymes were eluted with a linear gradient of 60–600 mM NaCl. The fractions were dialyzed against buffer A and were applied onto a UnoQ column (Bio-Rad). The proteins were eluted with a linear gradient of 60–600 mM NaCl. The enzymes were dialyzed against 10 mM Tris–HCl buffer pH 8.0 containing 5 mM MgCl2, 200 µM zinc acetate and 5 mM β-mercaptoethanol (buffer B) and were finally concentrated to about 8 mg ml−1 using an Amicon Ultra filter (Millipore).
For purification of selenomethionine-labelled AlaRS-C, the transformed methionine-auxotrophic E. coli strain B834 CodonPlus RIL (DE3) was grown in minimal medium in which the methionine was substituted by selenomethionine. The labelled AlaRS-C protein was purified in a similar manner to AlaRS-FL and AlaRS-N, except that a Resource PHE column (GE Healthcare) was used instead of the UnoQ column. Ammonium sulfate (3.5 M) was added to the Q-Sepharose FF column fractions to a final concentration of 1.4 M. The sample was applied onto a Resource PHE column equilibrated with 50 mM Tris–HCl buffer pH 8.0 containing 5 mM MgCl2, 1 mM DTT and 1.4 M ammonium sulfate. The sample was eluted with a linear gradient of 1.4–0 M ammonium sulfate. The fractions containing the selenomethionine-labelled AlaRS-C were dialyzed against buffer B and concentrated to a final concentration of about 8 mg ml−1 with an Amicon Ultra filter. The columns and buffers used in purification chromatography are summarized in Table 1 ▶.
Table 1. Protein-purification procedures.
| Protein | AlaRS-FL | AlaRS-N | AlaRS-C |
|---|---|---|---|
| First column | Q-Sepharose FF | Q-Sepharose FF | Q-Sepharose FF |
| Buffer A | 20 mM Tris–HCl buffer pH 8.0, 2 mM MgCl2, 60 mM NaCl, 1 mM DTT | 20 mM Tris–HCl buffer pH 8.0, 2 mM MgCl2, 60 mM NaCl, 1 mM DTT | 20 mM Tris–HCl buffer pH 8.0, 2 mM MgCl2, 60 mM NaCl, 1 mM DTT |
| Buffer B | 20 mM Tris–HCl buffer pH 8.0, 2 mM MgCl2, 600 mM NaCl, 1 mM DTT | 20 mM Tris–HCl buffer pH 8.0, 2 mM MgCl2, 600 mM NaCl, 1 mM DTT | 20 mM Tris–HCl buffer pH 8.0, 2 mM MgCl2, 600 mM NaCl, 1 mM DTT |
| Second column | UnoQ | UnoQ | ResourcePHE |
| Buffer A | 20 mM Tris–HCl buffer pH 8.0, 2 mM MgCl2, 60 mM NaCl, 1 mM DTT | 20 mM Tris–HCl buffer pH 8.0, 2 mM MgCl2, 60 mM NaCl, 1 mM DTT | 50 mM Tris–HCl buffer pH 8.0, 5 mM MgCl2, 1 mM DTT, 1.4 M ammonium sulfate |
| Buffer B | 20 mM Tris–HCl buffer pH 8.0, 2 mM MgCl2, 600 mM NaCl, 1 mM DTT | 20 mM Tris–HCl buffer pH 8.0, 2 mM MgCl2, 600 mM NaCl, 1 mM DTT | 50 mM Tris–HCl buffer pH 8.0, 5 mM MgCl2, 1 mM DTT |
The final purities of the proteins were monitored by SDS–PAGE (Fig. 2 ▶ b). UV spectroscopy indicated that the purified sample did not contain nucleic acid contaminants (data not shown). The yields of the purified proteins obtained from 1 l of cell culture were about 2, 2 and 10 mg for AlaRS-FL, AlaRS-N and AlaRS-C, respectively. The protein samples were stored at 193 K until use.
2.3. Enzyme assay
Gel-filtration analyses revealed that both AlaRS-FL and AlaRS-C form homodimers, while AlaRS-N forms a monomer (data not shown).
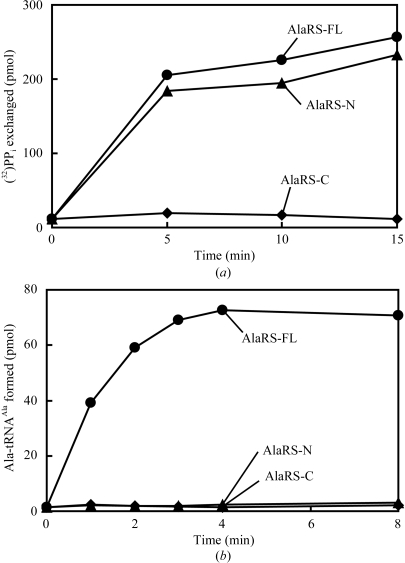
Amino-acid-dependent PPi–ATP isotopic exchange reactions were carried out at 338 K in 60 mM Tris–HCl buffer pH 7.5 containing 10 mM MgCl2, 2 mM alanine, 4 mM ATP, 4 mM (32P)-sodium pyrophosphate (1.65 Ci mmol−1) and 40 nM AlaRS protein. Aliquots were removed at specific time points and the amount of (32P)-ATP synthesized was measured as described by Calendar & Berg (1966 ▶). The amount of (32P)-ATP reflects the amount of Ala-AMP produced by the AlaRS enzymes. AlaRS-FL and AlaRS-N produced similar amounts of (32P)-ATP (Fig. 3 ▶ a). AlaRS-C, which was used as a negative control, did not produce (32P)-ATP.
Figure 3.
Enzyme assays of the AlaRS proteins. (a) Ala-AMP formation measured by the PPi–ATP isotopic exchange reaction. (b) Ala-tRNAAla formation.
Ala-tRNAAla-formation reactions were carried out at 338 K in 60 mM Tris–HCl buffer pH 7.5 containing 10 mM MgCl2, 3 mM ATP, 20 µM (14C)-alanine (33 cpm pmol−1), 40 nM AlaRS protein and 5 µM tRNAAla1. Aliquots were removed at specific time points and the radioactivity of the (14C)-Ala-tRNAAla thus formed was quantitated as described by Fukunaga & Yokoyama (2005 ▶ a). AlaRS-FL efficiently produced Ala-tRNAAla, while neither AlaRS-N nor AlaRS-C formed a detectable amount of Ala-tRNAAla (Fig. 3 ▶ b). Similar results were obtained with tRNAAla3 (data not shown).
These results revealed that the Ala-AMP-formation activity of AlaRS-N is normal, while its alanyl-moiety transfer activity to tRNAAla is severely reduced. The reduced activity may be attributable to possible weakness of the tRNAAla binding to AlaRS-N, as AlaRS-N cannot form a dimer.
2.4. Crystallization of the AlaRS-FL–tRNAAla complex
In this study, all crystallization trials were performed using the hanging-drop vapour-diffusion method by mixing 1 µl sample solution and 1 µl reservoir solution and equilibrating the mixed sample against 500 µl reservoir solution in a 24-well plate at 293 K. Initial crystallization screening was performed with Crystal Screen, Crystal Screen 2, Crystal Screen Lite, Natrix, MembFac, SaltRX and PEG/Ion Screen (Hampton Research), Wizard I and II (Emerald Biosystems) and JB Screen Classic (Jena Biosciences). The crystallization conditions were optimized by changing the concentrations of precipitant and salt, by changing the buffer and pH, and by the addition of an additive screen or detergent screen (Hampton Research).
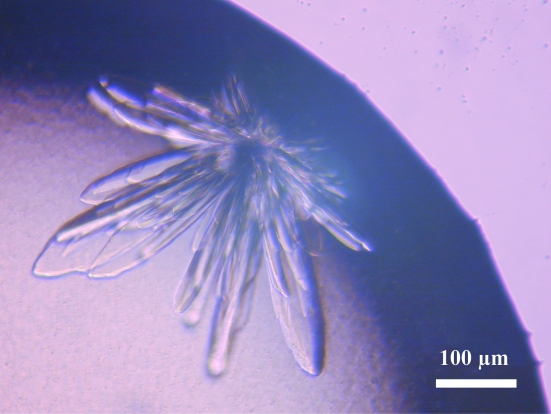
Crystals of AlaRS-FL were not obtained. For the crystallization of the AlaRS-FL–tRNAAla complex, tRNAAla was heated at 353 K for 5 min and was gradually cooled to room temperature for refolding. A 100 mM AMPPNP (a nonhydrolyzable analogue of ATP) solution was added to AlaRS-FL to a final concentration of 1 mM. AlaRS-FL and tRNAAla were mixed in a molecular ratio of 1:1.1, with a final AlaRS concentration of 6 mg ml−1. Combinations of AlaRS-FL and each of the tRNAAla isoacceptors were assessed for cocrystallization. Polymorphic crystals were obtained when tRNAAla1 was used with Crystal Screen 2 condition No. 1 (10% polyethylene glycol 6000 and 2.0 M NaCl). The optimized condition was 100 mM Tris–HCl buffer pH 8.0, 10% polyethylene glycol 6000 and 1.6 M NaCl (Fig. 4 ▶). No crystals were obtained when sample containing only either AlaRS-FL or tRNAAla1 was used for crystallization with the same reservoir solution. To determine whether the crystals were actually of the AlaRS-FL–tRNAAla complex, they were harvested, washed well, dissolved and examined by SDS–PAGE and urea–PAGE. The results showed that the crystals contained both AlaRS-FL and tRNAAla1 (data not shown), suggesting that these were AlaRS-FL–tRNAAla1 complex crystals, as in the case of our leucyl-tRNA synthetase–tRNALeu complex crystals (Fukunaga et al., 2005 ▶; Fukunaga & Yokoyama, 2005 ▶ b). We are now attempting to refine the crystallization conditions in order to obtain single crystals.
Figure 4.
Crystals of the A. fulgidus AlaRS-FL–tRNAAla1 complex.
2.5. Crystallization and X-ray data collection of AlaRS-ΔC
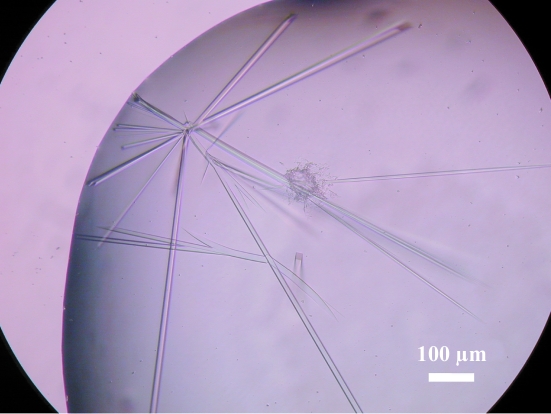
Initial crystals of AlaRS-N were obtained with JB Screen 5 condition No. 17 (100 mM imidazole–HCl pH 8.0 and 14% PEG 10 000). Crystals suitable for X-ray analysis were obtained with the optimized crystallization condition 100 mM imidazole–HCl pH 8.0, 14% PEG 10 000 and 0.22 mM FOS-choline (Fig. 5 ▶). For cryoprotection, the crystals were soaked in reservoir solution containing 25% glycerol. X-ray diffraction data sets were collected using cryocooled (100 K) crystals at BL41XU, SPring-8, Harima, Japan. The crystals diffracted X-rays to 3.7 Å. The data were indexed and scaled with HKL-2000 (Otwinowski & Minor, 1997 ▶). The data-collection statistics are summarized in Table 2 ▶. The crystals belong to the tetragonal space group P41 or P43, with unit-cell parameters a = b = 101.15, c = 124.24 Å. The asymmetric unit contains one molecule of AlaRS-N, with a corresponding crystal volume per protein weight of 3.8 Å3 Da−1 and a solvent content of 67.7%. We are currently attempting to solve the structure of A. fulgidus AlaRS-N by the MAD method using selenomethionine-labelled AlaRS-N and by molecular-replacement procedures using the structures of the N-terminal fragment of A. aquifex AlaRS (PDB code 1riq; Swairjo et al., 2004 ▶) and P. horikoshii AlaX-M (PDB code 2e1b; Fukunaga & Yokoyama, 2007 ▶) as models. The amino-acid sequence of P. horikoshii AlaX-M has 33% identity and 51% similarity to that of the editing domain of A. fulgidus AlaRS. The amino-acid sequence of the N-terminal fragment of A. aquifex AlaRS has 26% identity and 43% similarity to that of the aminoacylation active-site domain and the tRNA-recognition module of A. fulgidus AlaRS.
Figure 5.
Crystals of A. fulgidus AlaRS-N.
Table 2. Data-collection statistics for AlaRS-N.
Values in parentheses are for the highest resolution shell.
| Space group | P41 or P43 |
| Unit-cell parameters | a = 101.15, b = 101.15, c = 124.24 |
| Wavelength (Å) | 1.000 |
| Resolution range (Å) | 50.0–3.7 (3.83–3.7) |
| Measured reflections | 52915 |
| Unique reflections | 12817 |
| Completeness (%) | 95.2 (91.7) |
| Mean I/σ(I) | 14.0 (2.0) |
| Rmerge† (%) | 6.8 (33.2) |
R
merge = 
 .
.
2.6. Crystallization and X-ray data collection of AlaRS-C
Initial crystals of AlaRS-C were obtained with Crystal Screen 2 condition No. 5 (2.0 M ammonium sulfate and 5% 2-propanol). Selenomethionine-labelled crystals suitable for X-ray analysis were obtained with the optimized condition 1.6 M ammonium sulfate and 7.5% 1,6-hexanediol (Fig. 6 ▶). For cryoprotection, the crystals were soaked in reservoir solution containing 22% glycerol. X-ray diffraction data sets were collected using cryocooled (100 K) crystals at BL41XU of SPring-8. The crystals diffracted X-rays to 3.2 Å. The data were indexed and scaled with HKL-2000. The data-collection statistics are summarized in Table 3 ▶. The crystals belong to the orthorhombic space group P2221, with unit-cell parameters a = 124.15, b = 131.91, c = 138.68 Å. The number of molecules in the asymmetric unit was expected to be either six, eight, ten or 12, with corresponding crystal volume per protein weights of 4.9, 3.7, 3.0 and 2.5 Å3 Da−1 and solvent contents of 75.0, 66.6, 58.3 and 50.0%, respectively, assuming that AlaRS-C forms a dimer in the crystal. We are currently attempting to solve the structure of A. fulgidus AlaRS-C by the selenomethionine MAD method.
Figure 6.
Crystals of selenomethionine-labelled A. fulgidus AlaRS-C.
Table 3. Data-collection statistics for the selenomethionine-labelled AlaRS-C.
Values in parentheses are for the highest resolution shell.
| Peak | Edge | High remote | Low remote | |
|---|---|---|---|---|
| Space group | P2221 | |||
| Unit-cell parameters (Å) | a = 124.15, b = 131.91, c = 138.68 | |||
| Wavelength (Å) | 0.9793 | 0.9796 | 0.9643 | 0.9953 |
| Resolution range (Å) | 50–3.2 (3.31–3.2) | 50–3.4 (3.52–3.4) | 50–3.5 (3.63–3.5) | 50–3.5 (3.63–3.5) |
| Measured reflections | 371244 | 167946 | 145964 | 152430 |
| Unique reflections | 37913 | 31232 | 28666 | 28753 |
| Completeness (%) | 99.0 (94.1) | 98.0 (92.0) | 96.9 (84.3) | 97.4 (88.4) |
| Mean I/σ(I) | 21.1 (2.4) | 19.2 (2.6) | 14.9 (2.1) | 16.1 (2.3) |
| Rmerge† (%) | 10.1 (38.6) | 8.0 (36.0) | 9.5 (36.5) | 8.4 (34.3) |
R
merge = 
 .
.
Acknowledgments
We thank Drs S. Sekine, T. Ito (University of Tokyo), T. Yanagisawa, A. Shimada, T. Sengoku, R. Ishii (RIKEN), M. Kawamoto, N. Shimizu and H. Sakai (JASRI) for their help in data collection at SPring-8. This work was supported by Grants-in-Aid for Scientific Research in Priority Areas from the Ministry of Education, Culture, Sports, Science and Technology (MEXT) of Japan, the RIKEN Structural Genomics/Proteomics Initiative (RSGI) of the National Project on Protein Structural and Functional Analyses, MEXT. RF was supported by Research Fellowships from the Japan Society for the Promotion of Science for Young Scientists.
References
- Beebe, K., Ribas De Pouplana, L. & Schimmel, P. (2003). EMBO J.22, 668–675. [DOI] [PMC free article] [PubMed] [Google Scholar]
- Calendar, R. & Berg, P. (1966). Biochemistry, 5, 1681–1690. [DOI] [PubMed] [Google Scholar]
- Fersht, A. R. & Kaethner, M. M. (1976). Biochemistry, 15, 3342–3346. [DOI] [PubMed] [Google Scholar]
- Fukunaga, R., Ishitani, R., Nureki, O. & Yokoyama, S. (2005). Acta Cryst. F61, 30–32. [DOI] [PMC free article] [PubMed] [Google Scholar]
- Fukunaga, R. & Yokoyama, S. (2005a). J. Mol. Biol.346, 57–71. [DOI] [PubMed] [Google Scholar]
- Fukunaga, R. & Yokoyama, S. (2005b). Nature Struct. Mol. Biol.12, 915–922. [DOI] [PubMed]
- Fukunaga, R. & Yokoyama, S. (2007). Acta Cryst. D63, 390–400. [DOI] [PubMed] [Google Scholar]
- Hou, Y. M. & Schimmel, P. (1988). Nature (London), 333, 140–145. [DOI] [PubMed] [Google Scholar]
- Ishijima, J., Uchida, Y., Kuroishi, C., Tuzuki, C., Takahashi, N., Okazaki, N., Yutani, K. & Miyano, M. (2006). Proteins, 62, 1133–1137. [DOI] [PubMed] [Google Scholar]
- Otwinowski, Z. & Minor, W. (1997). Methods Enzymol.276, 307–326. [DOI] [PubMed]
- Sokabe, M., Okada, A., Yao, M., Nakashima, T. & Tanaka, I. (2005). Proc. Natl Acad. Sci. USA, 102, 11669–11674. [DOI] [PMC free article] [PubMed] [Google Scholar]
- Swairjo, M. A., Otero, F. J., Yang, X. L., Lovato, M. A., Skene, R. J., McRee, D. E., Ribas de Pouplana, L. & Schimmel, P. (2004). Mol. Cell, 13, 829–841. [DOI] [PubMed] [Google Scholar]
- Swairjo, M. A. & Schimmel, P. R. (2005). Proc. Natl Acad. Sci. USA, 102, 988–993. [DOI] [PMC free article] [PubMed] [Google Scholar]


