Abstract
Eukaryotic cells respond to changes in environmental oxygen supply by increasing transcription and subsequent translation of gene products required for adaptation to low oxygen. In fission yeast, the ortholog of mammalian sterol regulatory element binding protein (SREBP), called Sre1, activates low-oxygen gene expression and is essential for anaerobic growth. Previous studies in multiple organisms indicate that SREBP transcription factors function as positive regulators of gene expression by increasing transcription. Here, we describe a unique mechanism by which activation of Sre1-dependent transcription downregulates protein expression under low oxygen. Paradoxically, Sre1 inhibits expression of tco1+ gene product by activating its transcription. Under low oxygen, Sre1 directs transcription of tco1+ from an alternate, upstream promoter and inhibits expression of the normoxic tco1+ transcript. The resulting low-oxygen transcript contains an additional 751 nt in the 5′ untranslated region that is predicted to form a stable, complex secondary structure. Interestingly, polysome profile experiments revealed that this new longer transcript is translationally silent, leading to a decrease in Tco1 protein expression under low oxygen. Together, these results describe a new mechanism for oxygen-dependent control of gene expression and provide an example of negative regulation of protein expression by an SREBP homolog.
INTRODUCTION
To survive in diverse environments, organisms have developed mechanisms to allow growth under conditions of limiting nutrients. For many organisms including fungi, oxygen is a critical nutrient and cells have evolved ways in which to adapt to a hypoxic environment. Changes in gene transcription and regulation of mRNA translation play a critical role in the response to hypoxia. In mammals, the hypoxia inducible factor (HIF) family of transcription factors are the principal regulators of hypoxic transcription (1). In addition, hypoxia regulates gene expression by suppressing protein synthesis through the inhibition of translation initiation (2,3). Both of these mechanisms combine to mediate an adaptive response to limiting oxygen supply in mammalian cells.
In the fission yeast Schizosaccharomyces pombe, the transcriptional response to limiting oxygen is mediated by the membrane-bound transcription factor Sre1, the yeast homolog of the mammalian sterol regulatory element binding protein (SREBP) which regulates cellular cholesterol homeostasis (4). Sre1 (900 aa) contains two transmembrane segments and is inserted into the ER membrane in a hairpin orientation with the N- and C-termini in the cytosol (5). The N-terminus of Sre1 is a basic helix–loop–helix, leucine zipper transcription factor that binds to a DNA sequence called a Sre1 regulatory element (SRE) to activate transcription of adjacent genes (6). Under atmospheric oxygen conditions, Sre1 is inactive and remains sequestered in the ER membrane. Under low oxygen, Sre1 exits the ER and is proteolytically cleaved in a post-ER compartment to release the N-terminal transcription factor (Sre1N), which enters the nucleus and activates gene expression. Genome-wide mRNA expression analysis revealed that under low oxygen Sre1 is primarily a transcriptional activator. Sre1 induces expression of 115 genes and controls expression of 68% of genes upregulated >2-fold under low oxygen (6). Sre1 target genes include oxygen-dependent enzymes in lipid and heme biosynthesis as well as other gene products expected to be required for hypoxic growth. Consistent with these results, sre1+ is essential for growth under low oxygen conditions (5). Unlike mammals, regulation of translation by oxygen has not been reported in fission yeast.
To date, Sre1 and SREBPs are believed to function by upregulating protein expression through increased gene transcription (4,7). In this study, we describe a unique mechanism for oxygen-dependent regulation of translation that requires Sre1. Unexpectedly, Sre1 inhibits protein expression by upregulating transcription of the target gene, tco1+. Under low oxygen, Sre1 directs transcription of tco1+ from an alternate, upstream promoter that results in a transcript with a longer 5′ untranslated region (UTR). Interestingly, this longer low-oxygen transcript is translationally silent, leading to a decrease in Tco1 protein expression under low oxygen. Collectively, these findings outline a new mechanism for oxygen-dependent control of translation and provide an example of negative regulation of protein expression by an SREBP homolog.
MATERIALS AND METHODS
Strains, plasmids and standard procedures
Schizosaccharomyces pombe wild-type KGY425 (h−, his3-D1, leu1-32, ura4-D18, ade6-M210) and sre1Δ strains have been described previously (5,8). Materials, media and standard procedures including northern blotting, western blotting, chromatin immunoprecipitation and electrophoretic mobility shift assay have been described previously (5,6,9). Yeast deleted for tco1+/SPAC17G6.02c were generated by homologous recombination using standard techniques by replacing the tco1+ open reading frame with the kanamycin resistance gene (10). The tco1LΔ strain was created by replacing −1790 nt to −1250 nt upstream of tco1+ ORF with ura4+. A sre1N plasmid overexpressing sre1+ (1–1320 nt) from the thiamine repressible, nmt promoter was generated by inserting a PCR product into the SalI–BamHI sites of REP3× (11). The sre1N plasmid codes for Sre1(aa 1–440). Supplementary Table 1 contains sequences of oligonucleotides used.
Mapping the ends of tco1+ mRNA
cDNA was generated using Superscript II (Invitrogen) and an oligo dT primer from DNAse-treated RNA extracted from wild-type cells grown +/− oxygen for 6 h. 5′ and 3′ transcript ends were amplified using Gene Racer kit (Invitrogen). The 5′ and 3′ Rapid Amplification of cDNA Ends (RACE) products were cloned into TOPO-TA vector (Invitrogen) and sequenced. The tco1L 5′RACE product was sequenced by primer walking in three reactions. Five independent clones were sequenced for both culture conditions and the longest sequence shown by at least two clones was used.
Tco1 antiserum
An N-terminal GST-fusion to Tco1 (aa 263–324) in pGEX4T1 was expressed in Escherichia coli using standard techniques. Recombinant fusion protein was purified using glutathione-agarose beads (Sigma), dialyzed to remove excess glutathione, and used as antigen to generate antiserum (Covance).
Polysome profiling
Polysomes were isolated as described previously with minor modifications (12,13). Wild-type cells were grown in rich medium in the presence or absence of oxygen for 8 h, treated with 0.1 mg/ml cycloheximide and immediately placed on ice. Cells were centrifuged, washed in ice-cold lysis buffer (20 mM Tris–HCl pH 8.0, 140 mM KCl, 1.5 mM MgCl2, 0.5 mM DTT, 0.1 mg/ml cycloheximide and 1 mg/ml heparin) and lysed with glass beads in 1 ml lysis buffer by vortexing eight times for 30 s with incubation on ice for 30 s between pulses. Following addition of 100 µl each of 10% Triton X-100 and 10% sodium deoxycholate, lysates were incubated on ice for 5 min with an additional vortex pulse of 30 s. Lysates were cleared and 25 A260nm units were layered onto a 11-ml 10–50% (w/v) sucrose gradient (containing 20 mM Tris–HCl pH 8.0, 140 mM KCl, 5 mM MgCl2, 0.5 mM DTT, 0.1 mg/ml cycloheximide, 0.5 mg/ml heparin) and centrifuged at 35 000 r.p.m. in a SW41 rotor for 170 min at 4°C. Fractions (∼950 μl) were collected using an ISCO collection system and adjusted to 0.05% SDS. Following addition of yeast tRNA (20 µg/ml) (Invitrogen) and luciferase RNA control (0.1 μg/ml) (Promega) to each fraction, RNA was precipitated overnight and purified using RNeasy mini columns (Qiagen). cDNA was synthesized from RNA using SuperScript First-Strand Synthesis System (Invitrogen). The cDNA was diluted and amplified using gene-specific oligos by quantitative PCR (Bio-Rad) using Sybr-Green (ABgene). The Ct values for the gene of interest were used to determine the normalized value for each fraction using the formula [2⁁(Ctluciferase–Cttarget gene)]. The relative RNA amount was calculated by dividing the amount in each fraction by the total signal in all fractions.
Model for RNA structure
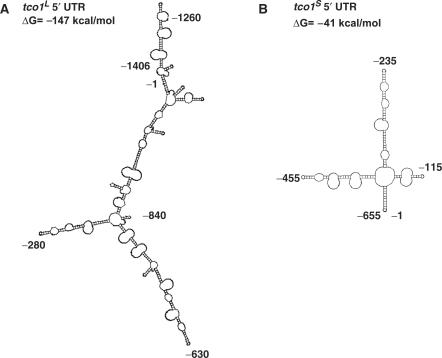
The predicted secondary structures for tco1L (−1406 to −1 nt) and tco1S (−655 to −1 nt) 5′UTR was determined using the GeneBee RNA secondary structure prediction software (www.genebee.msu.su/services/rna2_full.html) (14). Default settings were used to derive the models shown in Figure 6.
Figure 6.
Predicted secondary structures for the 5′UTRs of tco1L and tco1S. The secondary structure for the 5′UTR sequence of the anaerobic tco1L (A) and aerobic tco1S (B) transcripts, as predicted by the GeneBee RNA secondary structure prediction software (www.genebee.msu.su/services/rna2_full.html) (14). The Gibbs energy of formation for each folded RNA is shown. Nucleotide positions are given relative to the Tco1 AUG initiation codon.
RESULTS
Transcriptional profiling experiments of oxygen-dependent gene expression in S. pombe identified Sre1 target genes that were upregulated under low oxygen (6). These target genes functioned in diverse metabolic pathways such as the synthesis of heme, ergosterol, ubiquinone and sphingolipids. Additional expression profiling experiments identified an uncategorized Sre1 target gene SPAC17G6.02c, which was upregulated under low oxygen. SPAC17G6.02c codes for a 324-aa RTA1-like protein that is predicted to contain seven transmembrane domains. The Saccharomyces cerevisiae genome codes for four homologs of SPAC17G6.02c: RSB1, RTA1, RTM1 and an uncharacterized gene YER185W. Previous studies demonstrate that these S. cerevisiae genes are involved in efflux of different cytotoxic compounds, such as sphingoid long-chain bases by Rsb1p (15), 7-amino-cholesterol by Rta1p (16) and an unknown toxic substance in molasses by Rtm1p (17). Due to the potential function of SPAC17G6.02c in oxygen-regulated lipid transport, we characterized this gene further and based on our results we named it tco1+ for translation controlled by oxygen.
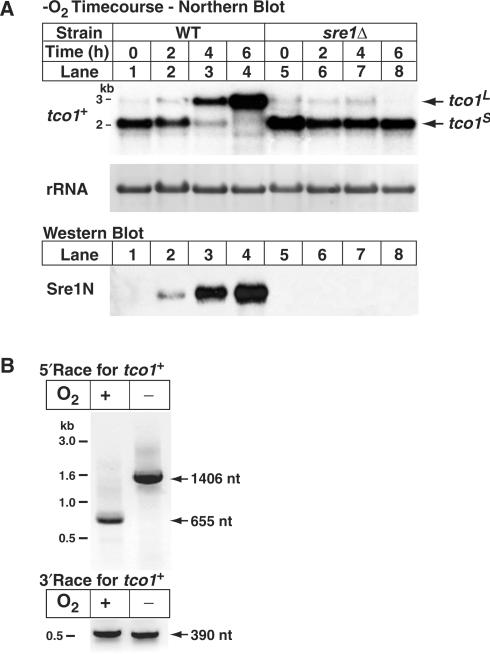
To confirm that tco1+ is upregulated under low oxygen by Sre1, we performed northern analysis using a strand-specific probe on RNA isolated from cells grown in the presence or absence of oxygen for increasing time (Figure 1A). To our surprise, while the levels of tco1+ transcript increased under low oxygen, the size of the tco1+ mRNA also increased from ∼2 to ∼3 kb (Figure 1A, lanes 1–4). After 6 h of low oxygen growth, cells expressed the long tco1+ transcript (tco1L) and not the short tco1+ transcript (tco1S). Importantly, both the upregulation of tco1+ and the increase in transcript size required Sre1 (Figure 1A, lanes 5–8). Consistent with this, the switch between tco1S and tco1L transcripts correlated with the proteolytic activation of Sre1 and the increase of cleaved Sre1N under low oxygen (Figure 1A, lower panel).
Figure 1.
Low oxygen synthesis of tco1L requires Sre1. (A) Wild-type and sre1Δ cells were cultured in the absence of oxygen for increasing time. Upper panel: total RNA (10 µg) was subjected to northern analysis using a tco1+ probe. 25S ribosomal RNA was imaged as loading control (29). Lower panel: cell extracts (40 µg) were analyzed by immunoblotting using antibodies to detect the nuclear form of Sre1 (Sre1N). tco1L and tco1S denote the long and short mRNAs for tco1+, respectively. (B) Wild-type cells were grown +/− oxygen for 10 h. Total RNA was harvested and used for 5′ and 3′RACE followed by PCR amplification. Agarose gels resolving the PCR products are shown. The nucleotide lengths of the 5′ and 3′UTRs are given at the right.
The increase in tco1+ transcript length could result from differential splicing or changes in the length of the mRNA UTRs. Given that tco1+ contains no predicted introns, we used RACE to determine the sequences of the 5′ and 3′UTRs for each transcript. In the presence of oxygen, the tco1S 5′UTR was 655 nt and in the absence of oxygen the tco1L 5′UTR was 1406 nt (Figure 1B, top panel). The 3′RACE revealed that the 3′UTR was 390 nt in both the tco1L and tco1S transcripts (Figure 1B, bottom panel). In addition, the coding sequences of tco1L and tco1S were the same length as determined by RT–PCR. These data indicate that tco1L and tco1S differ in size due to the presence of an additional 751 nt in the 5′UTR of tco1L.
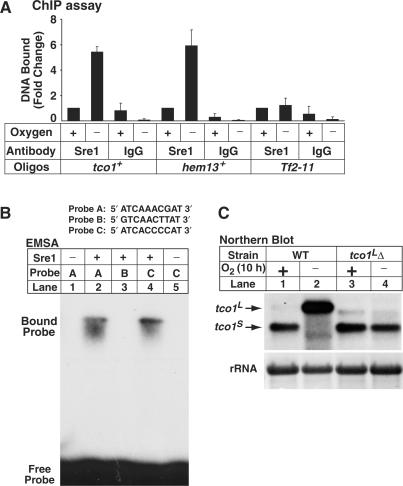
Thus far, the data are consistent with a model in which under low oxygen Sre1 directs transcription of tco1L from an anaerobic promoter upstream of the aerobic promoter that produces tco1S. To test whether Sre1 binds to the tco1+ promoter in vivo under low oxygen, we performed a chromatin immunoprecipitation experiment. Using primers positioned 100-bp upstream of the start of the tco1L transcript to detect DNA binding, Sre1 bound specifically to the tco1+ promoter and binding was increased 5-fold under low oxygen (Figure 2A). Sre1 displayed oxygen-dependent binding to the promoter of hem13+, a gene required for heme biosynthesis, but not the Tf2-11 retrotransposon as expected from previous results (6,9). Next, we scanned the genomic sequence 500-bp upstream of the tco1L 5′UTR for sequences that matched the SRE consensus sequence determined previously (6). Two potential SREs were identified (Figure 2B, Probes A and B) and we assayed these sequences for their ability to bind the DNA-binding domain of Sre1 in vitro in an electrophoretic mobility shift assay (Figure 2B). Sre1 bound to Probe A located −1527 to −1518 nt upstream of the tco1+ ORF as well as the positive control Probe C, a SRE from the promoter of sre1+ (Figure 2B, lanes 2 and 4) (6). Sre1 did not bind the other candidate SRE, Probe B located at −1651 to −1642 nt (Figure 2B, lane 3). Together, these in vitro and in vivo binding experiments suggest that under anaerobic conditions, Sre1N binds to a SRE upstream of tco1+, leading to the synthesis of tco1L.
Figure 2.
Sre1 binds to the tco1+ promoter. (A) Wild-type yeast were grown +/− oxygen for 6 h and subjected to chromatin immunoprecipitation using anti-Sre1 IgG or rabbit IgG. Bound DNA was normalized to wild-type + oxygen for each primer pair. The DNA bound values for the immunoprecipitation with anti-Sre1 under aerobic conditions were 0.005 (tco1+), 0.012 (hem13+) and 0.0012 (Tf2–11). Error bars denote one standard deviation among three experimental replicates. (B) Sre1 DNA-binding domain (aa 256–366) was incubated with indicated 32P-labeled DNA probes and subjected to electrophoretic mobility shift assay. Probes A and B represent sequences upstream of tco1+ ORF, −1527 to −1518 nt and −1651 to −1642 nt, respectively. Probe C is the Sre1 binding sequence from the sre1+ promoter and has been described previously (6). (C) Wild-type and tco1LΔ cells were cultured +/− oxygen for 10 h. Upper panel: total RNA (10 µg) was subjected to northern analysis using a tco1+ probe. 25S ribosomal RNA was imaged as loading control.
The low oxygen increase in tco1L transcript is accompanied by a decrease in tco1S transcript. To investigate if synthesis of tco1L is required for decreased levels of tco1S, we deleted sequences upstream of tco1S predicted to contain the transcriptional start site and regulatory elements for tco1L. In this strain designated tco1LΔ, tco1L transcript was not expressed under low oxygen and tco1S transcript was still present after 10 h of growth under low oxygen (Figure 2C). These results indicate that tco1L transcription is required to inhibit tco1S synthesis and that Sre1 does not directly block tco1S expression.
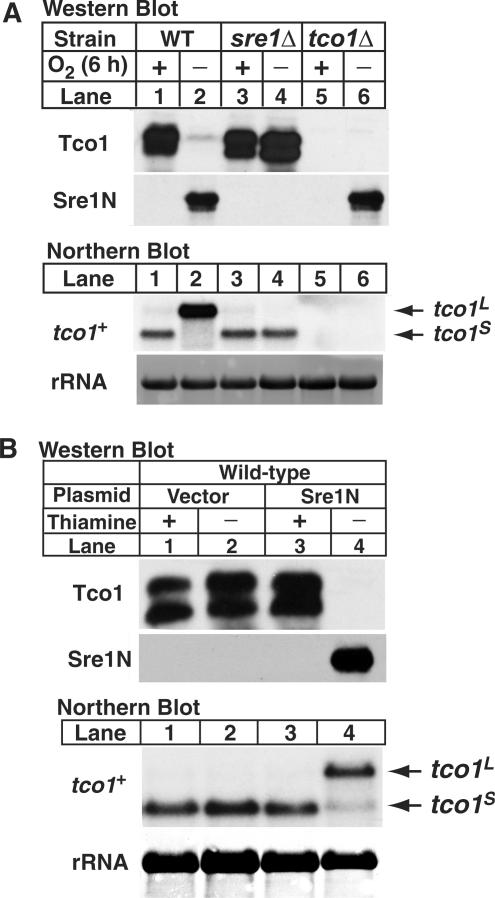
Sequence analysis predicted that both the tco1L and tco1S transcripts code for the same protein. To examine the translation products of these two transcripts, we raised antibodies to the C-terminus of Tco1, which is a predicted membrane protein. Microsomes were prepared from wild-type, sre1Δ and tco1Δ cells grown in presence or absence of oxygen for 6 h and these membranes were analyzed by immunoblotting for Tco1 (Figure 3A, upper panels). Antibodies specifically recognized Tco1 as a doublet migrating ∼30 kDa (Figure 3A, compare lanes 1 and 5). Interestingly, when wild-type cells were cultured under low oxygen to induce the tco1L transcript, levels of Tco1 protein were dramatically reduced (Figure 3A, lanes 1 and 2). In contrast, no decrease in Tco1 was observed under low oxygen in sre1Δ cells which expressed tco1S (Figure 3A, lanes 3 and 4). As expected, Sre1N levels were highly upregulated under low oxygen in wild-type and tco1Δ cells (Figure 3A, lower panel). These results indicate that under low oxygen Tco1 protein expression is inhibited by a mechanism that requires Sre1.
Figure 3.
Sre1 inhibits Tco1 protein expression. (A) Wild-type, sre1Δ, and tco1Δ cells were cultured for 6 h +/− oxygen. Upper panels: membrane protein samples (40 µg) were analyzed using antibodies raised against the C-terminus of Tco1 or cell lysates (40 µg) were analyzed by immunoblotting for nuclear Sre1. Lower panels: total RNA (10 µg) was subjected to northern analysis using a tco1+ probe. 25S rRNA was imaged as loading control. tco1L and tco1S denote the long and short mRNAs for tco1+, respectively. (B) Wild-type cells expressing sre1N from a plasmid under control of the thiamine repressible, nmt promoter were cultured in minimal medium in the presence (repressed) or absence (induced) of thiamine (5 µg/ml) for 24 h. Cells were diluted, cultured under the same conditions for 24 h and harvested in exponential phase. Upper panels: membrane proteins (36 µg) and cell lysates (40 µg) were immunoblotted using anti-Tco1 and anti-Sre1, respectively. Lower panels: total RNA (10 µg) was subjected to northern analysis using a tco1+ probe. 25S rRNA was imaged as loading control. tco1L and tco1S denote the long and short mRNAs for tco1+, respectively.
To test whether inhibition of Tco1 synthesis requires both activation of Sre1 and low oxygen, we overexpressed Sre1N in the presence of oxygen in wild-type cells. Cells carrying either empty vector or a plasmid expressing Sre1N from a thiamine repressible promoter were grown in the presence or absence of thiamine (18). Overexpression of Sre1N induced tco1L and inhibited expression of Tco1 even in the presence of oxygen (Figure 3B, lanes 3 and 4). Cells carrying the empty vector synthesized tco1S and showed aerobic levels of Tco1 (Figure 3B, lanes 1 and 2). These data indicate that activation of Sre1 is sufficient to induce expression of tco1L and inhibit Tco1 expression.
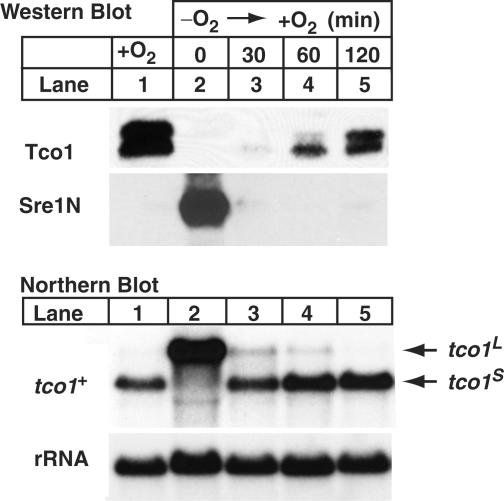
Next, we tested whether the inhibition of Tco1 expression by Sre1 is reversible. Sre1N has a short half-life of 5–10 min, and cleavage of Sre1 is rapidly inhibited upon shifting cells to the presence of oxygen (B.H. and P.E., unpublished data). Thus, Sre1N levels decrease rapidly after reintroducing oxygen to an anaerobic culture. For this experiment, we grew wild-type cells in the absence of oxygen for 10 h to induce tco1L and inhibit Tco1 expression (Figure 4, lane 2). Cells were then harvested at different times following a shift to aerobic conditions. As expected, Sre1N and tco1L accumulated under low oxygen (Figure 4, lanes 1 and 2). After shifting to aerobic conditions for 30 min, Sre1N disappeared and there was a corresponding switch from the tco1L to the tco1S transcript. Tco1 protein was detectable at 30 min and continued to increase to 120 min (Figure 4, lanes 2–5). These data indicate that the Sre1-dependent inhibition of Tco1 expression is reversible and provide further evidence that expression of the tco1L transcript leads to decreased Tco1 protein. In addition, these results suggest that the tco1L transcript has a short half-life since it disappeared 30 min after inhibiting Sre1 proteolytic activation.
Figure 4.
Low oxygen inhibition of Tco1 expression is reversible. Wild-type cells were grown in the presence of oxygen (lane 1) or in the absence of oxygen for 10 h and then shifted to aerobic conditions for the indicated times (lanes 2–5). Upper panels: membrane proteins (40 µg) and cell lysates (40 µg) were immunoblotted using anti-Tco1 and anti-Sre1, respectively. Lower panels: total RNA (10 µg) was subjected to northern analysis using a tco1+ probe. 25S rRNA was imaged as loading control. tco1L and tco1S denote the long and short mRNAs for tco1+, respectively.
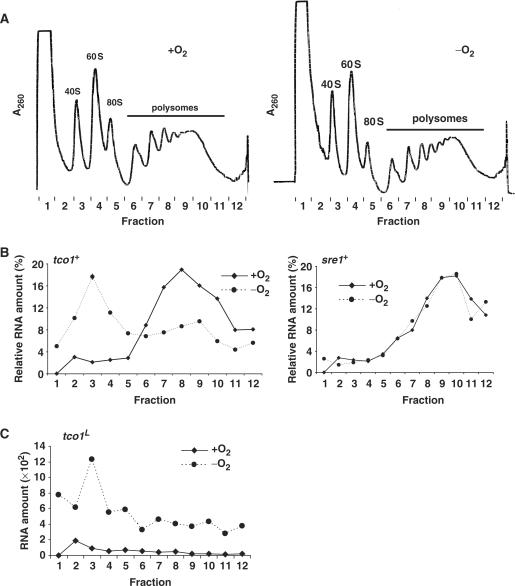
This oxygen-dependent regulation of Tco1 by Sre1 could result from the differential translation of tco1S and tco1L transcripts. To investigate this directly, we performed a polysome profiling experiment. Wild-type yeast were grown in the presence or absence of oxygen for 8 h to generate cells expressing either the tco1S or tco1L transcript, respectively. Cell lysates were fractionated on a sucrose gradient to separate ribosome-associated RNA from free RNA. Overall, there was no significant difference in the two polysome profiles, suggesting that translation efficiency was similar in the presence and absence of oxygen for 8 h (Figure 5A). To examine the translation status of tco1+ mRNAs, we isolated RNA from each fraction and quantified individual mRNAs by RT–PCR. First, we used oligos to the coding region of tco1+ to monitor the association of tco1+ mRNA with ribosomes (Figure 5B, left panel). In the presence of oxygen, tco1S mRNA associated with polysomes in Fractions 6–12 (Figure 5B, left, solid line). In the absence of oxygen, tco1L mRNA cofractionated with unassembled ribosomal subunits in Fractions 2–4 (Figure 5B, left, dotted line). In contrast, the sre1+ transcript fractionated with polysomes in both the presence and absence of oxygen, indicating that the gradient fractionation and mRNA isolation were identical under the two conditions (Figure 5B, right panel).
Figure 5.
tco1L transcript fails to associate with ribosomes. (A) Polysome profiles of wild-type cells cultured +/− oxygen for 8 h. Cell lysates were fractionated on a sucrose density gradient and absorbance at 260 nm was continuously measured for each fraction to detect RNA. Positions of the 40S and 60S ribosomal subunits, 80S monosomes and polysomes are indicated. (B) The amount of individual RNAs in each fraction was determined by real-time RT–PCR and the percentage of total RNA on the gradient is plotted for each fraction. The tco1+ (left panel) and sre1+ (right panel) transcripts were quantified using oligos in the tco1+ and sre1+ ORFs. The solid line denotes + oxygen sample and the dotted line denotes –oxygen sample. (C) The absolute amount of tco1L in each fraction is plotted after normalization with the extraction standard. The solid line denotes + oxygen sample and the dotted line denotes –oxygen sample.
To examine the association of tco1L mRNA with ribosomes directly, we detected this transcript using primers directed to its unique 5′UTR. As expected, cells grown in the absence of oxygen had elevated levels of tco1L compared to cells grown in the presence of oxygen (Figure 5C). In the absence of oxygen, tco1L fractionated with unassembled ribosomal subunits (Figure 5C, dotted line). To test whether the failure of tco1L to associate with ribosomes was dependent on the absence of oxygen, we determined the translation status of the small amount of tco1L mRNA that is synthesized in the presence of oxygen (Figure 5C, solid line). Even in the presence of oxygen, tco1L fractionated at the top of the gradient in Fractions 2 and 3. Collectively, these data indicate that tco1S is primarily associated with polysomes and therefore efficiently translated, while tco1L fails to associate with ribosomes and is poorly translated. In addition, this property of tco1L is independent of oxygen and thus likely results from sequence differences between the two mRNA transcripts.
RNA secondary structure can affect translation efficiency (19). In particular, stable stem-and-loop structures in the 5′UTR can inhibit translation initiation (20). To investigate whether the structure of the tco1+ mRNAs could contribute to their differential association with ribosomes, we used RNA structure programs to predict the secondary structure of the tco1L and tco1S 5′UTRs. Two different RNA structure programs (M-fold and GeneBee) predicted that the tco1L 5′UTR folds to form a highly structured, stable RNA (Figure 6). In contrast, the tco1S 5′UTR was predicted to contain less secondary structure with a higher Gibbs energy of formation. The models predicted by GeneBee are shown in Figure 6. These data suggest that the tco1L 5′UTR may assume a complex secondary structure that prevents efficient translation of the tco1+ ORF.
DISCUSSION
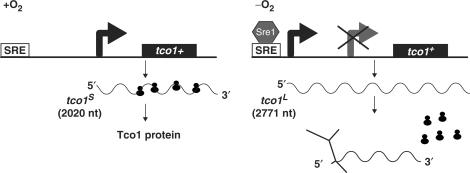
In this study, we describe a unique mechanism for translational control by oxygen via the low oxygen transcription factor Sre1. Genome-wide expression analysis identified tco1+ as a Sre1 target gene of unknown function. Here, our characterization revealed that tco1+ mRNA is upregulated under low oxygen by Sre1 (Figure 1A). Counterintuitively, this increased gene expression leads to decreased Tco1 protein due to the Sre1-dependent synthesis of a poorly translated, alternative transcript, tco1L. Our data are summarized by a model for regulation of tco1+ expression outlined in Figure 7. In the presence of oxygen, Sre1 is inactive and cells synthesize a 2020-nt mRNA tco1S that is efficiently translated into Tco1 protein. In the absence of oxygen, Sre1 is proteolytically activated leading to an increase in Sre1N which binds to the tco1+ promoter and directs expression of the 2771-nt mRNA tco1L from an alternative, upstream promoter. At the same time, expression of tco1S is blocked. The tco1L transcript associates inefficiently with ribosomes, leading to an inhibition of Tco1 protein expression.
Figure 7.
Model for regulation of Tco1 expression by oxygen. In presence of oxygen, the tco1S transcript is synthesized and translated into Tco1 protein. Synthesis of tco1S does not require Sre1. In the absence of oxygen, Sre1 is activated and binds to a SRE present upstream of tco1+, initiating transcription of tco1L from an alternative promoter. The 5′UTR of the tco1L transcript forms a secondary structure that prevents association with ribosomes. The nucleotide length of each transcript is given.
Polysome profiling experiments demonstrated that tco1S, but not tco1L, is efficiently translated (Figure 5). These two transcripts differ only in the length of their 5′UTRs. The 5′UTR of tco1L contains an additional 751 nt and is predicted to assume a more complex and stable secondary structure than the tco1S 5′UTR (Figure 6). Inasmuch as RNA secondary structure is known to affect translation initiation and efficiency, the structure of tco1L 5′UTR could directly inhibit Tco1 translation (19–21). Alternatively, the tco1L 5′UTR contains 14 AUG initiation codons compared to three in tco1S. The 5′UTRs of tco1L and tco1S code for seven ORFs (ranging from 3 to 97 aa in length) and three ORFs (8 –19 aa in length), respectively. Upstream ORFs (uORFs) can regulate translation of downstream ORFs by preventing reinitiation of ribosomes after translation termination (22). In this way, uORFs present in the tco1L 5′UTR could prevent translation of Tco1. Consistent with this possibility, 35–40% of tco1L mRNA was found to be associated with polysomes in fractions 6–12 (Figure 5B). Examples exist in S. cerevisiae and humans in which transcription from an alternative promoter leads to a different 5′UTR and less efficient translation, but the mechanisms involved in this regulation are unknown (23,24). Future experiments will determine the functional contribution of these two mechanisms to the inhibition of Tco1 translation.
One question that arises from these observations is why do cells make the tco1L transcript if it is not translated? One possible explanation is that inhibition of tco1S synthesis requires active transcription from the upstream tco1L promoter through a mechanism such as transcriptional interference or promoter competition (25,26). The regulated transcription of SER3 in S. cerevisiae is a well-characterized example of transcriptional interference in which the upstream, noncoding SRG1 transcript inhibits transcription from the SER3 promoter (27). In addition, the alcohol dehydrogenase gene in Drosophila melanogaster is regulated by two closely linked promoters during larval development. During late larval stages, there is a switch in promoter usage, wherein the distal promoter represses transcription from the proximal promoter by transcriptional interference (28). Here, transcription from the tco1L promoter inhibits transcription of tco1S (Figure 2C), but both transcripts code for the same protein product. In an alternative model, active transcription from the tco1L promoter could maintain an open chromatin state in order to allow rapid synthesis of tco1S and Tco1 upon the reintroduction of oxygen and loss of Sre1N. A similar idea has been proposed to explain the production of translationally silent transcripts in response to mating pheromone in S. cerevisiae (23).
Finally, while our experiments do not directly address the physiological function of Tco1, we find that expression of Tco1 decreases under low oxygen due to a block in translation. tco1+ is a nonessential gene and we have failed to detect any phenotypes associated with the loss or overexpression of Tco1 under anaerobic or other standard laboratory conditions. By homology to the characterized S. cerevisiae transporters Rta1p, Rsb1p and Rtm1p, we speculate that Tco1 may export a toxic compound(s) from cells under aerobic conditions, but that this substrate is either absent or no longer toxic under anaerobic conditions. Future experiments will address the physiological basis for this unique mechanism for inhibition of Tco1 translation under low oxygen.
SUPPLEMENTARY DATA
Supplementary Data are available at NAR Online.
ACKNOWLEDGEMENTS
Predoctoral fellowship from the American Heart Association (0615376U to B.H.); National Institutes of Health (HL077588). P.E. is a recipient of a Burroughs Wellcome Fund Career Award in the Biomedical Sciences. We thank Clara Bien, Ben Jilek, and Anuradha Gokhale for their excellent technical assistance and advice. In addition, we are grateful to Emerson Stewart for supplying recombinant Sre1 protein and members of the Espenshade for reviewing the manuscript. Funding to pay the Open Access publication charges for this article was provided by National Institutes of Health.
Conflict of interest statement. None declared.
REFERENCES
- 1.Semenza GL. Life with oxygen. Science. 2007;318:62–64. doi: 10.1126/science.1147949. [DOI] [PubMed] [Google Scholar]
- 2.Liu L, Simon MC. Regulation of transcription and translation by hypoxia. Cancer Biol. Ther. 2004;3:492–497. doi: 10.4161/cbt.3.6.1010. [DOI] [PubMed] [Google Scholar]
- 3.van den Beucken T, Koritzinsky M, Wouters BG. Translational control of gene expression during hypoxia. Cancer Biol. Ther. 2006;5:749–755. doi: 10.4161/cbt.5.7.2972. [DOI] [PubMed] [Google Scholar]
- 4.Espenshade PJ, Hughes AL. Regulation of sterol synthesis in eukaryotes. Annu. Rev. Genet. 2007;41:401–427. doi: 10.1146/annurev.genet.41.110306.130315. [DOI] [PubMed] [Google Scholar]
- 5.Hughes AL, Todd BL, Espenshade PJ. SREBP pathway responds to sterols and functions as an oxygen sensor in fission yeast. Cell. 2005;120:831–842. doi: 10.1016/j.cell.2005.01.012. [DOI] [PubMed] [Google Scholar]
- 6.Todd BL, Stewart EV, Burg JS, Hughes AL, Espenshade PJ. Sterol regulatory element binding protein is a principal regulator of anaerobic gene expression in fission yeast. Mol. Cell. Biol. 2006;26:2817–2831. doi: 10.1128/MCB.26.7.2817-2831.2006. [DOI] [PMC free article] [PubMed] [Google Scholar]
- 7.Goldstein JL, DeBose-Boyd RA, Brown MS. Protein sensors for membrane sterols. Cell. 2006;124:35–46. doi: 10.1016/j.cell.2005.12.022. [DOI] [PubMed] [Google Scholar]
- 8.Burke JD, Gould KL. Molecular cloning and characterization of the Schizosaccharomyces pombe his3 gene for use as a selectable marker. Mol. Gen. Genet. 1994;242:169–176. doi: 10.1007/BF00391010. [DOI] [PubMed] [Google Scholar]
- 9.Sehgal A, Lee CY, Espenshade PJ. SREBP controls oxygen-dependent mobilization of retrotransposons in fission yeast. PLoS. Genet. 2007;3:1389–1396. doi: 10.1371/journal.pgen.0030131. [DOI] [PMC free article] [PubMed] [Google Scholar]
- 10.Bahler J, Wu JQ, Longtine MS, Shah NG, McKenzie A., III, Steever AB, Wach A, Philippsen P, Pringle JR. Heterologous modules for efficient and versatile PCR-based gene targeting in Schizosaccharomyces pombe. Yeast. 1998;14:943–951. doi: 10.1002/(SICI)1097-0061(199807)14:10<943::AID-YEA292>3.0.CO;2-Y. [DOI] [PubMed] [Google Scholar]
- 11.Forsburg SL. Comparison of Schizosaccharomyces pombe expression systems. Nucleic Acids Res. 1993;21:2955–2956. doi: 10.1093/nar/21.12.2955. [DOI] [PMC free article] [PubMed] [Google Scholar]
- 12.Arava Y. Isolation of polysomal RNA for microarray analysis. Methods Mol. Biol. 2003;224:79–87. doi: 10.1385/1-59259-364-X:79. [DOI] [PubMed] [Google Scholar]
- 13.MacKay VL, Li X, Flory MR, Turcott E, Law GL, Serikawa KA, Xu XL, Lee H, Goodlett DR, Aebersold R, et al. Gene expression analyzed by high-resolution state array analysis and quantitative proteomics: response of yeast to mating pheromone. Mol. Cell Proteomics. 2004;3:478–489. doi: 10.1074/mcp.M300129-MCP200. [DOI] [PubMed] [Google Scholar]
- 14.Brodskii LI, Ivanov VV, Kalaidzidis I, Leontovich AM, Nikolaev VK, Feranchuk SI, Drachev VA. GeneBee-NET: An Internet based server for biopolymer structure analysis. Biokhimiia. 1995;60:1221–1230. [PubMed] [Google Scholar]
- 15.Ogawa C, Kihara A, Gokoh M, Igarashi Y. Identification and characterization of a novel human sphingosine-1-phosphate phosphohydrolase, hSPP2. J. Biol. Chem. 2003;278:1268–1272. doi: 10.1074/jbc.M209514200. [DOI] [PubMed] [Google Scholar]
- 16.Soustre I, Letourneux Y, Karst F. Characterization of the Saccharomyces cerevisiae RTA1 gene involved in 7-aminocholesterol resistance. Curr. Genet. 1996;30:121–125. doi: 10.1007/s002940050110. [DOI] [PubMed] [Google Scholar]
- 17.Ness F, Aigle M. RTM1: a member of a new family of telomeric repeated genes in yeast. Genetics. 1995;140:945–956. doi: 10.1093/genetics/140.3.945. [DOI] [PMC free article] [PubMed] [Google Scholar]
- 18.Maundrell K. nmt1 of fission yeast. A highly transcribed gene completely repressed by thiamine. J. Biol. Chem. 1990;265:10857–10864. [PubMed] [Google Scholar]
- 19.Kozak M. Regulation of translation via mRNA structure in prokaryotes and eukaryotes. Gene. 2005;361:13–37. doi: 10.1016/j.gene.2005.06.037. [DOI] [PubMed] [Google Scholar]
- 20.Kozak M. Influences of mRNA secondary structure on initiation by eukaryotic ribosomes. Proc. Natl Acad. Sci. USA. 1986;83:2850–2854. doi: 10.1073/pnas.83.9.2850. [DOI] [PMC free article] [PubMed] [Google Scholar]
- 21.Brenet F, Dussault N, Delfino C, Boudouresque F, Chinot O, Martin PM, Ouafik LH. Identification of secondary structure in the 5′-untranslated region of the human adrenomedullin mRNA with implications for the regulation of mRNA translation. Oncogene. 2006;25:6510–6519. doi: 10.1038/sj.onc.1209672. [DOI] [PubMed] [Google Scholar]
- 22.Vilela C, McCarthy JE. Regulation of fungal gene expression via short open reading frames in the mRNA 5′untranslated region. Mol. Microbiol. 2003;49:859–867. doi: 10.1046/j.1365-2958.2003.03622.x. [DOI] [PubMed] [Google Scholar]
- 23.Law GL, Bickel KS, MacKay VL, Morris DR. The undertranslated transcriptome reveals widespread translational silencing by alternative 5′ transcript leaders. Genome Biol. 2005;6:R111. doi: 10.1186/gb-2005-6-13-r111. [DOI] [PMC free article] [PubMed] [Google Scholar]
- 24.Wang Y, Newton DC, Robb GB, Kau CL, Miller TL, Cheung AH, Hall AV, VanDamme S, Wilcox JN, Marsden PA. RNA diversity has profound effects on the translation of neuronal nitric oxide synthase. Proc. Natl Acad. Sci. USA. 1999;96:12150–12155. doi: 10.1073/pnas.96.21.12150. [DOI] [PMC free article] [PubMed] [Google Scholar]
- 25.Shearwin KE, Callen BP, Egan JB. Transcriptional interference–a crash course. Trends Genet. 2005;21:339–345. doi: 10.1016/j.tig.2005.04.009. [DOI] [PMC free article] [PubMed] [Google Scholar]
- 26.Mazo A, Hodgson JW, Petruk S, Sedkov Y, Brock HW. Transcriptional interference: an unexpected layer of complexity in gene regulation. J. Cell Sci. 2007;120:2755–2761. doi: 10.1242/jcs.007633. [DOI] [PubMed] [Google Scholar]
- 27.Martens JA, Laprade L, Winston F. Intergenic transcription is required to repress the Saccharomyces cerevisiae SER3 gene. Nature. 2004;429:571–574. doi: 10.1038/nature02538. [DOI] [PubMed] [Google Scholar]
- 28.Corbin V, Maniatis T. Role of transcriptional interference in the Drosophila melanogaster Adh promoter switch. Nature. 1989;337:279–282. doi: 10.1038/337279a0. [DOI] [PubMed] [Google Scholar]
- 29.Lapeyre B, Michot B, Feliu J, Bachellerie JP. Nucleotide sequence of the Schizosaccharomyces pombe 25S ribosomal RNA and its phylogenetic implications. Nucleic Acids Res. 1993;21:3322. doi: 10.1093/nar/21.14.3322. [DOI] [PMC free article] [PubMed] [Google Scholar]


