

Abstract
A major obstacle to creating precisely expressed transgenes lies in the epigenetic effects of the host chromatin that surrounds them. Here we present a strategy to overcome this problem, employing a Gal4-inducible luciferase assay to systematically quantify position effects of host chromatin and the ability of insulators to counteract these effects at phiC31 integration loci randomly distributed throughout the Drosophila genome. We identify loci that can be exploited to deliver precise doses of transgene expression to specific tissues. Moreover, we uncover a previously unrecognized property of the gypsy retrovirus insulator to boost gene expression to levels severalfold greater than at most or possibly all un-insulated loci, in every tissue tested. These findings provide the first opportunity to create a battery of transgenes that can be reliably expressed at high levels in virtually any tissue by integration at a single locus, and conversely, to engineer a controlled phenotypic allelic series by exploiting several loci. The generality of our approach makes it adaptable to other model systems to identify and modify loci for optimal transgene expression.
The ability to introduce wild type and modified genes into animal genomes has led to fundamental insights in developmental biology and gene regulation1,2. However, one parameter that has not been well controlled for in most transgenic experiments is the effects of surrounding host chromatin on transgene expression. These effects, collectively referred to as ‘position effects’, determine whether basal expression of the transgene is tight or leaky and whether induced expression of the transgene is sufficiently high to produce detectable phenotypes3-7. In most transgenic experiments, such as those based on the pronuclear or embryonic injection of linear DNAs in the mouse8 and P elements in Drosophila9, transgenes randomly integrate into the genome, with only a fraction fortuitously landing into loci with favorable position effects. By not controlling for position effects, these strategies necessitate that several transgenic lines be created and tested in order to find one that expresses the transgene optimally—at the right times, places and levels.
One possible remedy to the position-effect problem is to flank transgenes with insulators, stretches of DNA that have been shown to block the effects of neighboring enhancers and silencers as well as encroaching heterochromatin10. Indeed, this strategy has been shown to decrease variability in the expression of randomly integrated transgenes in flies, mice and frogs. Well-known examples of protective insulators include the cHS4 element from the chick β-globin locus11-13, the scs and scs’ sequences from the Drosophila HSP70 locus14 and the su(Hw) binding element from the gypsy retrovirus15. However, although insulators can decrease variability in some contexts, it remains unclear whether they permit optimal transgene regulation and high levels of expression12,14,16,17. Moreover, insulators do not seem to have robust activity at all loci, thereby limiting their utility12,15. Thus, although insulators can protect against some position effects, variability in their effectiveness has precluded their wide-spread use in constructing transgenic animals.
Another potential solution to the position effect problem is to use targeted integration to place transgenes into loci that allow them to be optimally expressed. However, no systematic efforts have been made to identify loci that permit optimal transgene expression. In the mouse, where homologous recombination can direct transgenes to any locus, the most popular site for targeted integration has been ROSA26, a locus found by protein trapping to drive ubiquitous expression of integrated transgenes18. However, expression studies and functional assays demonstrate that targeting transgenes to ROSA26 does not result in sufficiently high levels of transgene expression in every tissue19. Thus the differential activation of this well-characterized locus limits its usefulness to a subset of tissues.
In Drosophila, homologous recombination is technically demanding20 and not standard practice. However, an alternative approach, exploiting phiC31 site-specific integration, has recently emerged as a promising method of targeting transgenes to specific loci21. The phiC31 integrase mediates recombination between the bacterial and phage attachment sites, attB and attP, and has been shown to efficiently integrate attB-containing plasmids into attP ‘landing sites’ that have been previously inserted in the genome22. To date, over 100 attP landing-site loci have been randomly integrated into the Drosophila genome22-25. Some of these landing sites have been modified to allow for recombinase-mediated cassette exchange23 and the unambiguous detection of integrated transgenes25, whereas other shave been shown to be amenable to the integration of large 100-kb DNA constructs24. However, it remains unclear whether position effects at any of these attP sites permit optimal transgene expression.
Here we set out to measure position effects across a set of attP loci, in order to determine which, if any, would be ideal for the precisely controlled expression of transgenes over developmental time and space. Our results show that position effects vary so greatly from tissue to tissue that an attP landing site that permits optimal gene expression in one tissue may not be inferred to have the same effect in another. This finding implies that there may not be a single locus in the Drosophila genome, or in any genome, that permits optimal gene expression in all tissues. However, we show that the constraining properties of position effects can be overcome by a previously unrecognized property of the gypsy insulator to boost gene expression to levels severalfold greater than that from un-insulated loci. Our results provide the first opportunity in Drosophila to create a battery of transgenes at a single locus that can be reliably expressed at high levels in most and possibly every tissue. Moreover, our approach to systematically quantify position effects and insulator activity can be applied to other model systems to identify and engineer optimal loci for the construction of transgenic animals.
RESULTS
Global basal and inducible activity at attP landing sites
An optimally regulated transgene is one that is silent, or nearly silent, under basal conditions and strongly induced under activating conditions. To identify attP landing sites with these properties, we generated a set of attP landing sites randomly distributed across the genome (Table 1 and Supplementary Table 1 and Supplementary Fig. 1 online). We then integrated a Gal4-regulated26 UAS::luciferase reporter (Fig. 1a,b) into 20 of these sites, including the originally published attP1 and attP2 sites22, to allow us to quantify transcriptional activity from each locus. We selected luciferase rather than conventional in vivo reporters for Drosophila, such as lacZ and GFP, because luminometry is much more quantitative than either absorption spectroscopy or fluorometry27. To measure luciferase expression, we developed a high-throughput assay that measures luciferase activity in whole-animal extracts normalized to total protein.
Table 1.
attP docking sites characterized with the UAS::luciferase reportera
| Site | Chr. | Cytology | Location relative to nearest genes |
|---|---|---|---|
| attP1b | 2R | 56C1 | Intergenic: flanked by sbbcand IM23 |
| attP2b | 3L | 68A4 | Intergenic: flanked by CG6310 and MocsI |
| attP3 | X | 19C4 | Intergenic: flanked by CG1631 and CG15462 |
| attP4 | X | 12C6 | Intragenic: inside the 5′ UTR of Clic |
| attP10 | 3 | 85D7/92B1 | TEd |
| attP14 | 2L | 36A10 | Intragenic: inside an intron of grp |
| attP16 | 2R | 53C4 | Intergenic: flanked by CG15711 and CG33960 |
| attP18 | X | 6C12 | Intragenic: inside the 5′ UTR of CG14438 |
| attP22 | 2R | 45D8 | Intergenic: flanked by ced-6e and CG13952 |
| attP23 | 2R | 60C7 | Intragenic: inside an intron of bs |
| attP24f | 2R | 42C1 | Intergenic: flanked by Or42A and Tsp42A |
| 2R | 58C1 | Intergenic: flanked by CG34205 and a | |
| attP29 | 2L | 21E2 | Intragenic: inside the 5′ UTR of drongo |
| attP30 | 2L | 29C3 | Intragenic: inside an intron on Akap200 |
| attP32 | 2R | 49D6 | Intergenic: flanked by CG17574 and bic |
| attP33 | 2R | 50B6 | Intergenic: flanked by CG12464 and fas |
| attP40 | 2L | 25C7 | Intergenic: flanked by CG14035 and Msp-300 |
| attP52 | 3R | 89B11 | Intragenic: inside the 5′ UTR/intron of gishg |
| attP64 | 3R | 89B9 | Intragenic: inside the 5′ UTR/intron of tarag |
| attP83 | CyO | 39D3 | Intergenic: flanked by nrv3 and His1h |
| attP88 | 3L | 64A12 | Intragenic: inside a coding exon of CG1265 |
| attP112 | 3L | 68C13 | Intragenic: inside an intron of MobI |
| attP154 | 3R | 97D2 | Intergenic: flanked by CG14247 and Tl |
Based on release 5.1 of the D. melanogaster genome.
See reference 22.
Based on accession AF247562.
Transposable Element, RT1-alpha; attP10 maps genetically to chromosome 3, butby iPCR it is unclear if it is in the RT1-alpha element at 85D7 or 92B1.
The 5′ end of ced-6 is based on RE47146.
PCR results indicate that the UAS-luciferase reporter integrated at 42C1 but not 58C1.
On the basis of alternative splicing, the attP docking site is located in the 5′ UTR of some transcripts and in the intron of others.
On wild-type chromosome 2, position 39D3 is flanked by nrv3 and His1; we did not determine if this gene order holds on CyO.
Figure 1.
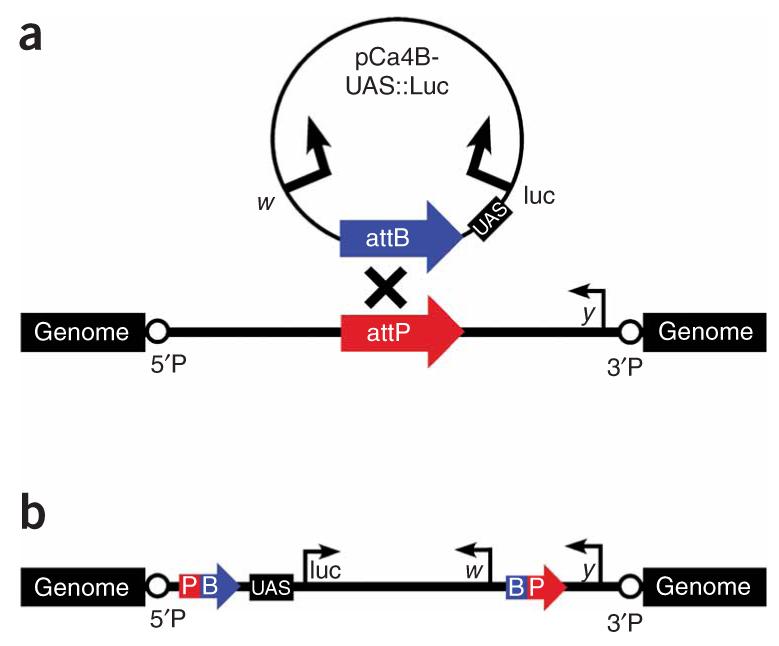
The UAS::luciferase reporter before and after integration at attP docking sites. (a) A schematic of the UAS::luciferase reporter plasmid and an attP docking site before integration showing the relative orientations of the marker genes w and y and the 5′P and 3′P P-element ends flanking the attP landing site. (b) Site-specific integration between the attB and attP sequences results in hybrid attP-attB sites encompassing the entire integrated pCa4B-UAS::luc plasmid, with the 5′ regulatory region of the UAS::luciferase reporter positioned close to flanking genomic DNA.
Because of the quantitative and sensitive nature of our assay, we were able to detect above-background levels of luciferase activity in the absence of Gal4 induction at all 20 loci (Fig. 2a). This observation suggests that UAS::transgenes may never be completely silent. As most loci permit only relatively low levels of activity, the basal activity at most sites is likely to be biologically inert and is consistent with the observation in yeast that Pol II transcription is noisy throughout the genome28. However, of the 20 attP landing sites we examined, four showed basal expression levels that were at least 20-fold greater than the most tightly regulated loci with low basal activity. This finding suggests that about 20% of all transgenes incorporated by P elements, such as the attP sites in this study, will likely show relatively high levels of basal expression that in some cases may have deleterious consequences.
Figure 2.
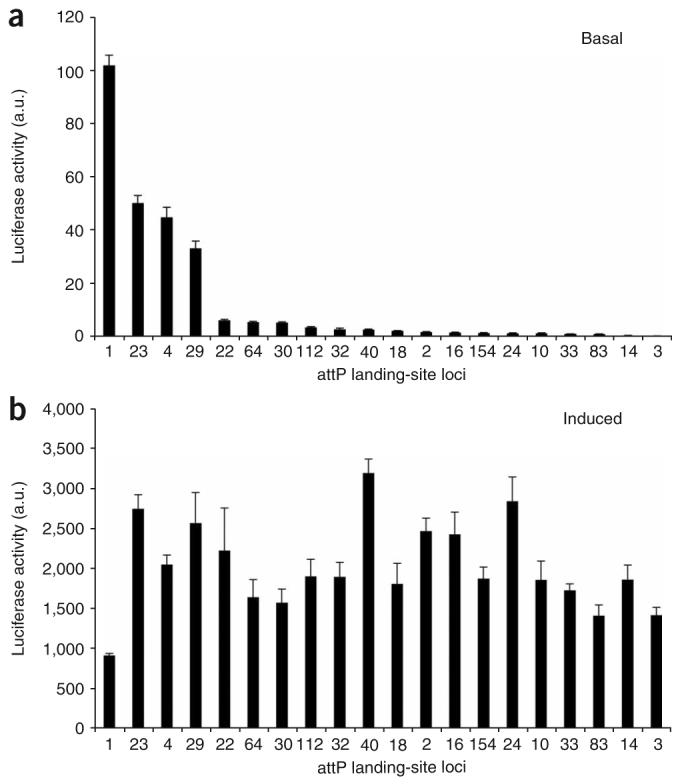
Levels of basal and inducible expression at attP landing sites are uncorrelated. Levels of luciferase activity were measured from five pools of three L3 female larvae each, with up to one outlier removed per genotype. Luciferase activity was normalized to total protein. Each bar represents the mean, and the error bars represent the s.d. (a) Basal activity was measured from heterozygous UAS::luciferase transgenic animals in the absence of a Gal4 driver. (b) Induced activity was measured from compound heterozygotes carrying one copy of the UAS::luciferase transgene and one copy of the ubiquitously expressed Act5C::Gal4 driver. The same trends were observed in biological replicates using both single L3 larvae and pools of larvae. Luciferase values normalized to total protein are shown as arbitrary units (a.u.).
The converse problem to transcriptional noise is transcriptional repression. Indeed, the most common problem encountered in transgenic studies is the inability to induce expression of transgenes at sufficiently high levels. To determine which of the attP landing site loci allow for the highest levels of induced expression, we next examined luciferase activity in larvae ubiquitously expressing the Gal4 transcriptional activator (Fig. 2b). Notably, we found that most of the landing-site loci permit similar absolute levels of luciferase induction, with no correlation evident between levels of basal and induced activity (Fig. 2a,b). Thus levels of basal expression are not reliable predictors of inducibility. Two of the three most highly expressed loci—attP40 and attP24—showed low levels of basal expression, indicating that they may fit the criteria of allowing both tight regulation and optimal induction.
Tissue-specific induction at attP landing sites
As measurements of ubiquitous gene activity represent luciferase activities averaged over all tissues, it remained unclear whether attP40 and attP24 would permit optimal expression in every tissue or instead only in a subset of tissues. To begin to resolve this question, we examined luciferase activity in three larval tissues: muscle (Fig. 3a), fat body (Fig. 3b) and the nervous system (Fig. 3c). For each tissue, we compared luciferase activity from five attP landing sites representing the spectrum of observed basal and inducible activity (Fig. 2), and calculated the fold activity relative to expression from attP3, the least inducible of the loci with low basal activity.
Figure 3.

Position effects are tissue dependent. Luciferase activity was measured from five pools of compound heterozygous female larvae, as in Figure 2, in three tissues: (a) in muscle using the dMEF2::Gal4 driver, (b) in fat body using the Cg::Gal4 driver and (c) in the nervous system using the Nrv2::Gal4 driver. Patterns of Gal4 expression in muscle, fat body and the nervous system were visualized in L3 larvae carrying the respective Gal4 driver and UAS::eGFP, shown to the left of each graph. Each bar represents the fold of luciferase activity induced at the specified attP landing site relative to luciferase activity induced from the attP3 site. The same trends were observed in biological replicates.
Of note, we found discordance between ubiquitous inducibility and tissue-specific induction (Fig. 3). Indeed, relative inducibility at each locus was observed to vary greatly as a function of tissue type. For example, the differences in inducibility varied by as much as 20-fold in muscle and fivefold in fat body, but not even twofold in neurons. These dramatic differences reflect not only varying degrees of inducibility at the attP3 locus (which seems to be severely repressed in muscle), but also differences among all the loci. For example, maximal luciferase activity is attained from attP2 in muscle (Fig. 3a) but from attP40 in fat body (Fig. 3b).
Because the amount of Gal4 transcriptional activator delivered to the cells of each tissue is likely to be different from one tissue to the next, it is possible that the amount of Gal4 present in a specific tissue influences the relative inducibility among loci in that tissue. However, when we used two muscle-specific Gal4 drivers that differed by over 100-fold in their ability to induce luciferase, we observed the same relative differences in inducibility among the loci in muscle (Supplementary Fig. 2 online). This indicates that the tissue-specific differences we observed in the inducibility of different loci are not due to differences in the amount of Gal4 in each tissue. Rather, these differences in inducibility likely reflect a dynamic property of chromatin to adopt different tissue-specific conformations that influence the accessibility of DNA to transcriptional activators in each tissue.
Together, these results demonstrate that ubiquitous gene activity cannot be used as a proxy for inducibility in specific tissues. Moreover, maximal inducibility in one tissue does not guarantee maximal inducibility in another tissue. Thus, the standard practice in Drosophila of generalizing transgene inducibility on the basis of expression in a single tissue—most commonly using the eye and more recently the wing disc25—is of limited use in assessing how well a transgene will be expressed in other tissues. Our results demonstrate instead that transgene activity must be empirically determined for each tissue.
Exploiting position effects to create an allelic series
Given that the position effects measured at many loci varied by only twofold, we set out to determine whether these differences were biologically important. Toward this end, we took advantage of a hairpin construct against the Notch gene that was previously shown to produce quantifiable wing phenotypes29. We integrated this UAS::Notch RNAi construct into three attP landing sites with low basal activity—attP3, attP2 and attP40—that each differ in their ability to drive luciferase in the wing disc (Fig. 4a). As predicted, induction of the Notch hairpin in wing discs resulted in a phenotypic allelic series (Fig. 4b) that directly correlated with our luciferase measurements. The allelic series ranged from no mutant phenotype when induced from attP3, to a predominantly vein-thickening phenotype from attP2, and to a severe vein-thickening defect often coupled with wing notches from attP40 (Fig. 4c), consistent with the luciferase measurements showing that attP3 < attP2 < attP40. These results demonstrate that even the twofold differences observed in luciferase induction represent biologically relevant differences in expression that can be exploited to produce a spectrum of phenotypic outcomes.
Figure 4.
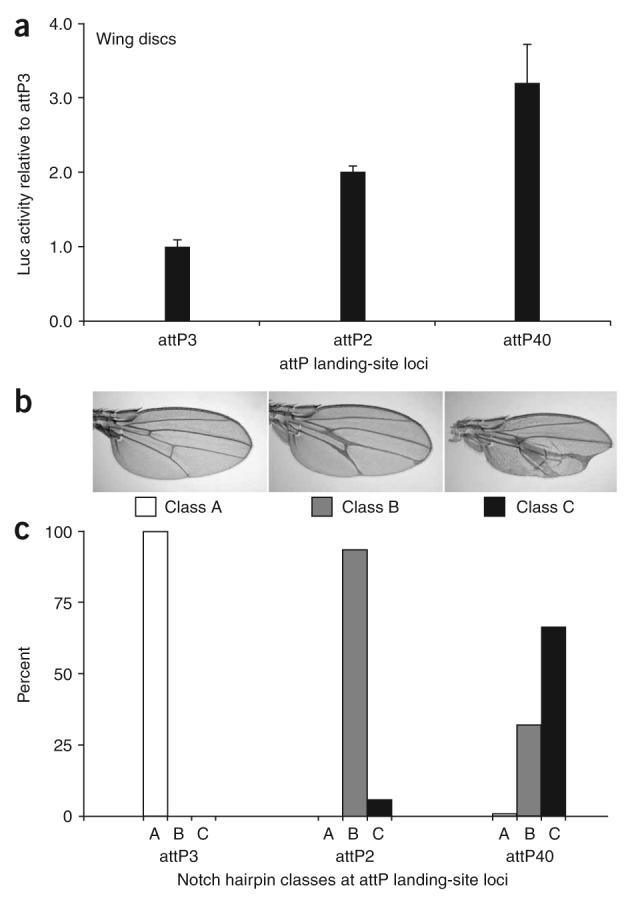
Exploiting position effects to create an allelic series. (a) Luciferase activity was measured from six pools of three wing discs each, isolated from compound heterozygous females containing one copy of UAS::luciferase and one copy of the en::Gal4 driver. (b) Three classes of wing phenotypes were observed and imaged in compound heterozygous animals containing the en::Gal4 driver and the UAS::Notch RNAi hairpin. Class A appears wild type, class B shows moderately thickened veins that sometimes form deltas close to the wing margin, and class C shows severely thickened veins coupled with notches of the wing margin. (c) The proportion of wing phenotypes in each class is shown for compound heterozygotes containing one copy of en::Gal4 and one copy of UAS::NotchRNAi at the respective landing site shown. Over 200 adults were scored for each genotype.
The gypsy insulator enables greatly increased expression
Although the above results show that tissue-specific position effects can be used to deliver precise doses of a transgene to specific tissues, they also imply that there may not be a single locus that permits optimal expression in all tissues. This presents a major limitation to using site-specific integration, because it implies that each locus must be selected on a case-by-case basis. We therefore decided to test whether flanking transgenes with an insulator could eliminate tissue-specific differences in position effects. We chose to focus on the gypsy insulator, because previous studies have shown that it can block the effects of over 20 different cis-regulatory elements30 as well as protect the w gene from position effects in the eye15. Indeed, we found that flanking UAS::luciferase transgenes with the gypsy insulator equalizes expression within several tissues, even between loci that showed the largest differences in basal and induced activity (Fig. 5).
Figure 5.

The gypsy insulator increases Gal4-inducible gene expression in larval and adult tissues. (a) Uninsulated (left) and insulated (right) UAS::luciferase transgene expression was induced in larval muscle with the dMEF2::Gal4 driver and measured as in Figure 2. The transgenes are diagrammed with UAS::luciferase represented by an arrow, the gypsy insulator represented by flanking ovals and the Gal4 driver indicated as a gray circle. (b) Uninsulated luciferase expression was induced in larval muscle with the same driver as in a and measured across 20 attP loci. For each locus, six individual L3 females were measured, with up to one outlier removed per genotype. Dark gray bars represent the fold of luciferase activity induced at the specified attP landing site relative to luciferase activity induced from attP3. Error bars, s.d. The three bars on the right represent projections of relative luciferase activity from gypsy-insulated transgenes at attP1 (white), attP2 (light gray) and attP3 (black) based on the relative increases at each locus as observed in a. (c) Uninsulated (left) and insulated (right) UAS::luciferase transgene expression was induced in larval fat body with the Cg::Gal4 driver, the larval imaginal discs with the ap::Gal4 driver, and ubiquitously in larvae with the da::Gal4 driver and measured as in Figure 2. (d,e) Uninsulated (left) and insulated (right) UAS::luciferase transgene expression was induced in adult muscle with dMEF2::Gal4 (d) and in adult fat body with CG::Gal4 (e) and measured in pools of three adult females as in Figure 2.
However, to our surprise, we found that the gypsy insulator equalizes activity among different loci by increasing the induced activity at each locus severalfold, to levels that are greater than observed from any of the 20 un-insulated attP sites.
For example, in muscle, the gypsy insulator equalized the 20-fold difference in inducibility between attP2 and attP3 by increasing expression at attP2 ∼3-fold and expression at attP3 ∼60-fold (Fig. 5a). These augmented levels of induced luciferase activity are higher than observed from any of the 20 loci induced in muscle without insulators (Fig. 5b). This property of the gypsy insulator seems to be general, as it promoted similar increases in gene expression in every tissue tested, including the larval fat body and imaginal discs as well as the larva as a whole (Fig. 5c). Moreover, this boosting activity was also observed in the adult muscle and fat body (Fig. 5d,e) as well as in adults and larvae induced with a hybrid Gal4-VP16 transcriptional activator (Supplementary Fig. 3 online). As insulators are known to block both the repressive and activating influences of surrounding enhancers, silencers and chromatin, the pervasive boosting effects that we observed suggest that on balance, transgenes in Drosophila are under repressive influences. It thus seems that the gypsy insulator, in abrogating widespread repression, allows transgenes to be expressed at levels that are several-fold greater than would be possible without insulators.
Of note, however, although the insulator works in every tissue tested, it does not work equally well at every locus tested. For example, the effects of the gypsy insulator at a third locus, attP1, did not produce equally high levels of induced activity in larval or adult muscles (Fig. 5a,b,d) thereby demonstrating that although the gypsy insulator can alleviate repression at diverse loci, it cannot do so equally well at all loci. Nevertheless, the absolute levels of induction at attP1 were substantially higher when insulated than when not insulated (Fig. 5a-e). These results demonstrate, for the first time to our knowledge, that the gypsy insulator can be used to create transgenes that can be reliably expressed at high levels in virtually every tissue; but to be fully effective, insulated transgenes must be targeted to fully permissive loci, such as attP2 or attP3.
As the gypsy insulator seems to protect transgene induction from the repressive effects of surrounding chromatin, we next examined how it would influence basal activity. We found that the presence of the gypsy insulator in adults protected against ectopic activation at the attP1 locus and did not increase basal activity at attP2 and attP3 (Fig. 6a). However, in larvae, the insulator had a substantial boosting effect on the basal activity at attP2 and attP3, and as explained below, at attP1 as well (Fig. 6b). Consistent with previous reports showing that gypsy-flanked lacZ and GFP reporters are ectopically expressed in the salivary gland17,31, we found that virtually all of the basal expression from insulated transgenes at attP2 and attP3 and over 50% from attP1 was localized to the salivary glands (Fig. 6c). This correlation suggests that the gypsy insulator may have a second function as a salivary gland enhancer31, thereby limiting its use as a general booster of gene expression. However, as every experiment in which this correlation has been reported is based on constructs using the HSP70 core promoter—which itself has been shown to contain sequences necessary for salivary gland expression32—it is possible that the gypsy insulator is not a salivary gland enhancer but instead protects or synergizes with the salivary gland enhancer in the HSP70 promoter.
Figure 6.

The gypsy insulator increases expression of an endogenous salivary gland enhancer in the HSP70 promoter. (a,b) Basal activity was measured as in Figure 2 in adults (a) and larvae (b) containing either the uninsulated (left) or insulated (right) UAS::luciferase transgene in the absence of a Gal4 driver. (c) Luciferase activity was measured in dissected individual L3 females homozygous for either the uninsulated UAS::luciferase or gypsy-insulated UAS::luciferase, as diagrammed by the above cartoons in which the insulator is depicted with flanking ovals. Each bar represents the average measurements from three to eight individual dissected larvae, showing the proportion of luciferase activity from the salivary gland (black bars) relative to the activity from the remainder of the body (gray bars). (d-i) Ectopic salivary gland activity is not detected in gypsy-flanked constructs driven by the eve promoter. Three constructs were tested as depicted by the above cartoons, showing the eve promoter as a blue arrow, the intervening cis-regulatory DNA as a black box and the gypsy insulator as flanking ovals. Xgal staining shows that each cis-regulatory DNA directed expression in a unique pattern in the larval foregut (top panels), which serves as a positive control for the staining, but none of the constructs showed activity in the salivary glands (lower panels). The enhancers in the constructs were the 214-bp Ady enhancer (d,g), the 498-bp brk enhancer (e,h), and the 350-bp vnd enhancer (f,i)—each linked to the eve promoter and flanked by gypsy insulators.
Thus, to determine whether the gypsy insulator itself acts as a salivary gland enhancer, we took advantage of previously published transgenes33,34 built with the gypsy insulator flanking a lacZ reporter under the control of the widely used eve minimal promoter35. The eve promoter, like the HSP70 promoter, contains a strong TATA box and is commonly used as a generic promoter for tests of enhancer activity. We reasoned that if the gypsy insulator is indeed a salivary gland enhancer, then just as it has been shown to promote salivary gland expression when flanking multiple types of non-salivary gland enhancers (ranging in size from 700 bp to 1.2 kb)17, it should promote salivary gland expression when flanking constructs with similarly sized non-salivary gland enhancers linked to the eve promoter. However, we did not observe any salivary gland expression in any of the eve promoter constructs, indicating that gypsy is not an inherent salivary gland enhancer (Fig. 6d-i). Similarly, we did not find any salivary gland activity from a transgenic construct made with the gypsy insulator flanking a GFP reporter linked to the endogenous 560-bp Espl-m4 promoter region36 (data not shown). These findings argue that the gypsy insulator itself does not direct salivary gland activity in our constructs but instead protects against repression of a weak salivary gland enhancer associated with the HSP70 promoter. Taken together, these results demonstrate that the gypsy insulator can be used to reliably produce highly expressed transgenes in a variety of tissues; however, to be effective, gypsy-flanked transgenes must be targeted to specific loci such as attP2 and attP3 to achieve the highest levels of induction and used in conjunction with neutral core promoters to ensure tight basal regulation.
DISCUSSION
Site-specific integration offers several advantages over random integration, such as the ability to direct transgenes to benign locations in order to avoid insertional mutagenesis. However, site-specific integration has taken a backseat to random integration, because of uncertainties about which loci to target for optimal transgene expression. To overcome this limitation, we employed a Gal4-inducible luciferase assay to systematically quantify position effects and the ability of the gypsy insulator to alter these effects at 20 site-specific integration sites in the Drosophila genome. With this approach, we identified several sites with optimal properties: low basal activity, yet the capacity for high levels of inducible expression. Moreover, the sensitive nature of our assay allowed us to rank each site according to its distinct level of inducible output, a feature that, as we demonstrate, can be exploited to deliver precise doses of transgene expression to specific tissues. Conversely, we show that consistently high levels of expression—above what we observed from any locus without insulators—can be achieved by flanking transgenes with the gypsy retrovirus insulator. On the basis of our findings and strategy, site-specific integration is now poised to supplant random integration for the creation of precisely expressed transgenes.
Our strategy of targeting transgenes to well-characterized loci offers several advantages in addition to avoiding insertional mutagenesis. For example, our system makes it possible to manipulate the amount of transgene expression delivered to specific tissues. As a case in point we show that sites with sequential twofold differences in luciferase activity can be used to create a controlled phenotypic allelic series. This demonstrates that the sensitive nature of our luciferase assay distinguishes biologically relevant differences in gene expression output. These differences can be exploited in cases where transgene dose is important, such as in gene rescue experiments, tests of gene structure/function, and in ectopic expression studies aimed at dissecting gene regulatory networks.
Another advantage of our system is that it provides a mechanism to ensure that transgenes are expressed at consistently high, and possibly ‘maximal’ levels in all tissues. For example, we found that when the gypsy insulator flanks transgenes at permissive loci such as attP2 and attP3, transgene expression is boosted to levels that are greater than those we observed from any of the 20 attP loci in the absence of insulators. This finding is significant, because no single site in the absence of the insulator seems to be optimal for expression in all tissues. For example, the optimal site in larval muscle is attP2, but in the larval fat body, it is attP40. These results imply that there may not be an attP landing site in Drosophila, or a locus in any genome, that on its own permits reliably high transgene expression in every tissue. Consistent with this possibility, even genes that are expressed ubiquitously do not seem to be expressed at uniformly high levels, including the Act5C, da, and tub Gal4 drivers in Drosophila (data not shown) and ROSA26 in the mouse18. Thus, our finding that the gypsy insulator promotes consistently high levels of transgene expression in all tissues tested provides the first opportunity to create transgenes from a single locus that can be robustly expressed in most or possibly all tissues.
The ability to create optimally expressed transgenes from a single locus will be especially important for large-scale projects, because it is not feasible to create libraries of effective transgenes by random integration. For example, in the genome-scale Drosophila RNAi library37, it is estimated that close to 40% of the lines—created by random integration—fail to be expressed at sufficient levels to yield a knockdown phenotype. To achieve full-genome coverage of effective RNAi transgenes by random integration would require the creation of tens of thousands of additional lines. But this is untenable, as maintaining the library—which currently has only one to two lines per construct—already exceeds available resources38. Combining use of the gypsy insulator with site-specific integration would ensure that each transgene is optimally expressed, thereby obviating the requirement to make multiple lines for each construct. Thus, by using our approach, an effective full-genome library would not have to exceed the number of genes in the genome.
Large-scale projects in other model systems, such as the mouse, would also benefit from the ability to create optimally expressed transgenes from a single locus. For example, in a promising proof-of-principle experiment demonstrating inducible transgenic RNAi in the mouse39, only two of nine lines were expressed at sufficiently high levels to create a knockdown phenotype. Thus, the problem of position effects presents a substantial obstacle to producing large-scale RNAi transgenics in the mouse. As the gypsy insulator shares mechanistic features with vertebrate CTCF insulators10, it would be interesting to test if these insulators could likewise promote maximal gene expression in the mouse. Moreover, there are several additional insulators from Drosophila and vertebrates that can be tested for the ability to maximize gene expression.
Here, we took an empirical approach to characterize position effects and insulator activity. Eventually, it may be possible to replace empirical tests with bioinformatics to predict position effects on the basis of surrounding sequences, transcriptional landscapes and chromatin marks. One promising resource for this endeavor is FlyAtlas40, a catalog of gene expression profiles obtained from individual tissues of Drosophila larvae and adults. For example, of the five loci that we tested for inducibility in the fat body, we found that only the one with the highest inducbility, attP40, is neighbored by a highly expressed fat-body gene—MSP-300, located about 9 kb away (Supplementary Table 1 and Supplementary Fig. 1). Although attP40 has relatively low basal expression and is thus not directly activated by MSP-300 enhancers, it is likely that transcription of MSP-300 in the fat body alters the local surrounding chromatin, making it more permissive for transcriptional activation in that tissue. Tissue-specific microarray data may thus be useful as a starting point to predict loci that will be highly inducible in specific tissues. Microarray data will not, however, be able to predict all aspects of position effects, because loci associated with genes that are poorly expressed in a particular tissue still display differential inducibility. For example, attP1 and attP2 are flanked by genes that are expressed at equivalently low levels in the fat body, yet they still show twofold differences in inducibility in that tissue.
Our results demonstrate that although bioinformatic approaches to predict position effects are promising, it remains necessary to empirically quantify position effects over developmental time and space when selecting loci for transgene experiments. In the short term this strategy will identify optimal loci for transgene expression, as we have shown in the fly, and in the longer term, it may contribute to a biological understanding of the phenomenology of position effects.
METHODS
Generation and mapping of AttP docking-site lines
AttP landing sites were generated by P-element injection9 and P-element hopping41 of the pCARY plasmid22. AttP lines generated by P-element injection (1,2,3,18,20,22,23 and 40) were provided by the Nusse and Calos laboratories. AttP docking sites were mapped by inverse PCR42. We determined the cytological position of each insert by BLAST alignments of iPCR sequences (Supplementary Data online) to release 5.1 of the Drosophila genome.
Plasmid constructs
We created pCa4B, a pCaSpeR4-based43 cloning vector with an attB site, by cloning a SpeI and NotI digested 375-bp PCR fragment containing the attB sequence into a pCaSpeR4 vector cut with SpeI and NotI. The 375-bp fragment containing the attB sequence was PCR amplified from pUASTB22 using primers listed in Supplementary Table 2 online, MM#7 and MM#8. We created pCa4B-UAS::luc and pCa4B-UAS::NotchRNAi by digesting pUAST-luciferase (gift of J. Bai) and pUAST-NotchRNAi29 with BamHI and cloning each respective fragment into the BamHI site of pCa4B. A gypsy-insulated version of pCa4B called pCa4B2G (pCa4B with 2 Gypsy insulators) was created by PCR amplifying the 341-bp gypsy insulator from a single y2 fly44,45 with primers MM#91 and MM#92 (see Supplementary Table 2), digesting the product with SpeI and XbaI and ligating the fragment in sequential steps into the SpeI and XbaI sites of pCa4B. The two gypsy insulators in pCa4B2G are in the same orientation and are separated by the cloning sites SpeI, BamHI and XbaI. pCa4B2G-UAS::luc was created by digesting pUAST-luciferase with BamHI (as above) and ligating the resulting [UAS::luciferase-polyA] fragment into the BamHI site of pCa4B2G. Each of the UAS::luciferase and UAS::NotchRNAi constructs were cloned in the same orientation relative to the attB sequence in pCa4B and pCa4B2G.
Site-specific integration of attB plasmids into attP landing sites
Site-specific integration was carried out by co-injection with phiC31-integrase RNA as previously described22. Integration into attP landing sites was verified by using primers MM#49 and MM#50 (Supplementary Table 2) to amplify a 620-bp fragment between the y gene marker in the attP docking site and the proximal integrated attB sequence (Fig. 1b).
Fly maintenance and stocks
Flies were maintained under standard conditions at 25 °C. The following Gal4 drivers were used: Act5C::Gal4 (y[1] w[*]; P{w[+mC]=Act5C-GAL4}25FO1/CyO, y[+]), ap::Gal4 (y[1] w[1118]; P{w[+mW.hs]=GawB}ap[md544]/CyO) and Cg::Gal4 (w[1118]; P{w[+mC]=Cg-GAL4.A}2), from the Bloomington Stock Center, dMEF2::Gal4 (homozygous on the third chromosome; ref. 46), Nrv2::Gal4 (homozygous on the second chromosome; ref. 47), en::Gal4 (homozygous on the second chromosome; ref. 48).
Luciferase assays
Luciferase was measured using the Promega Steady-Glo Luciferase Assay Kit. Three wandering L3 female larvae were collected in 200 μl of Promega Glo Lysis Buffer for each sample. Samples were collected over a series of days and stored at -80 °C until five independent samples were collected for each genotype. Samples were defrosted at room temperature, put on ice, and homogenized using Kontes pestles, Eppendorf tubes, and a cordless motor. Homogenized samples were incubated at room temperature for 10 min and then centrifuged for 5 min to pellet the larval remains. We transferred 150 μl of supernatant to a 96-well master plate on ice. A multi-channel pipette was used to transfer 20 μl of each sample to a white-walled 96-well plate (Costar) at room temperature. We added 20 μl of Promega Luciferase Reagent to each well and incubated the plates in the dark for 10 min. An additional plate was prepared with serial dilutions of a larval homogenate (prepared from compound heterozgotes containing insulated UAS::luciferase driven by the Cg::Gal4 driver) to calculate the linear range. Luminescence was measured on a Molecular Devices Analyst GT plate reader. This protocol was also used to measure luciferase activity in pools of three adult females, aged 3-4 d at 25 °C. To measure homogenates obtained from single L3 larvae and wing discs, we followed the above protocol, using smaller volumes of buffer (100 μl and50 μl, respectively) to homogenize the samples, from which smaller volumes of extract were obtained (90 μl and 50 μl, respectively).
Protein measurements
Total protein was measured using the Pierce BCA Protein Assay Kit. We aliquoted 10 μl from each master plate (described above) into clear-bottomed 96-well plates (Costar) at room temperature. We added 90 μl of BCA Working Reagent to each well and incubated the resulting mixes at 37 °C for 30 min. The plates were incubated at 22 °C (room temperature) for 10 min to allow the reactions to stabilize. Absorbance was measured on a Molecular Devices Analyst GT plate reader at 540 nm. Three replica plates were averaged for each sample. The standard curve was produced with BSA dilutions in Promega Glo Lysis Buffer.
X-gal staining and whole mount preparations
Standard protocols were followed to dissect, fix and stain L3 larval tissues, and to mount adult wings for brightfield microscopy49. L3 larvae and tissues were imaged with a Zeiss StemiS V11, and the adult wings were imaged with a Zeiss Axioskop2.
Supplementary Material
ACKNOWLEDGMENTS
We are indebted to S. Cherry for calling our attention to the phiC31 integrase system and providing critical feedback throughout the project. We also thank J. Zallen, B. Mathey-Prevot, M. Gelbart-Carey, E. Larschan, M. Levine, L. Quilter and K. Venken for helpful comments on the manuscript, and J. Philips, M. Gibson, R. Binari, J. Bateman, M. Kuroda, A. Gortchakov, A. Alekseyenko, W. Bender, M. Wolfner, S. Elledge, A. McMahon, S. Dymecki and N. Hunter for stimulating discussions. We are grateful to M. Calos, R. Nusse and M. Fish (Stanford University) for attP fly stocks, B. Fisher for attP mapping data, J. Bai (Harvard Medical School) for pUAST-luciferase, R. Lehmann (New York University Medical Center), J. Posakony (University of California San Diego), N. Dostatni (Institut Curie), G. Struhl (Columbia University), D. Arnosti (Michigan State University) and the Bloomington Stock Center for fly stocks, and FlyBase for the BLAST server. N.P. is an investigator of the Howard Hughes Medical Institute; M.M. is a fellow of the Jane Coffin Childs Memorial Fund; C.P. is a European Molecular Biology Organization (EMBO) fellow and S.E.C. receives support from the US Department of Energy contract DE-AC0376SF0098.
Footnotes
References
- 1.Anderson KV, Ingham PW. The transformation of the model organism: a decade of developmental genetics. Nat. Genet. 2003;33(Suppl.):285–293. doi: 10.1038/ng1105. [DOI] [PubMed] [Google Scholar]
- 2.Stathopoulos A, Levine M. Genomic regulatory networks and animal development. Dev. Cell. 2005;9:449–462. doi: 10.1016/j.devcel.2005.09.005. [DOI] [PubMed] [Google Scholar]
- 3.Lewis EB. The phenomenon of position effect. Adv. Genet. 1950;3:73–115. doi: 10.1016/s0065-2660(08)60083-8. [DOI] [PubMed] [Google Scholar]
- 4.Spradling AC, Rubin GM. The effect of chromosomal position on the expression of the Drosophila xanthine dehydrogenase gene. Cell. 1983;34:47–57. doi: 10.1016/0092-8674(83)90135-6. [DOI] [PubMed] [Google Scholar]
- 5.Levis R, Hazelrigg T, Rubin GM. Effects of genomic position on the expression of transduced copies of the white gene of Drosophila. Science. 1985;229:558–561. doi: 10.1126/science.2992080. [DOI] [PubMed] [Google Scholar]
- 6.Pirrotta V, Steller H, Bozzetti MP. Multiple upstream regulatory elements control the expression of the Drosophila white gene. EMBO J. 1985;4:3501–3508. doi: 10.1002/j.1460-2075.1985.tb04109.x. [DOI] [PMC free article] [PubMed] [Google Scholar]
- 7.Palmiter RD, Brinster RL. Germ-line transformation of mice. Annu. Rev. Genet. 1986;20:465–499. doi: 10.1146/annurev.ge.20.120186.002341. [DOI] [PMC free article] [PubMed] [Google Scholar]
- 8.Hogan B, Beddington R, Costantini F, Lacey E. Manipulating the Mouse Embryo: A Laboratory Manual. Cold Spring Harbor Laboratory Press; Cold Spring Harbor, New York: 1995. [Google Scholar]
- 9.Rubin GM, Spradling AC. Genetic transformation of Drosophila with transposable element vectors. Science. 1982;218:348–353. doi: 10.1126/science.6289436. [DOI] [PubMed] [Google Scholar]
- 10.Gaszner M, Felsenfeld G. Insulators: exploiting transcriptional and epigenetic mechanisms. Nat. Rev. Genet. 2006;7:703–713. doi: 10.1038/nrg1925. [DOI] [PubMed] [Google Scholar]
- 11.Chung JH, Whiteley M, Felsenfeld G. A 5′ element of the chicken beta-globin domain serves as an insulator in human erythroid cells and protects against position effect in Drosophila. Cell. 1993;74:505–514. doi: 10.1016/0092-8674(93)80052-g. [DOI] [PubMed] [Google Scholar]
- 12.Potts W, Tucker D, Wood H, Martin C. Chicken beta-globin 5′ HS4 insulators function to reduce variability in transgenic founder mice. Biochem. Biophys. Res. Commun. 2000;273:1015–1018. doi: 10.1006/bbrc.2000.3013. [DOI] [PubMed] [Google Scholar]
- 13.Allen BG, Weeks DL. Transgenic Xenopus laevis embryos can be generated using phiC31 integrase. Nat. Methods. 2005;2:975–979. doi: 10.1038/nmeth814. [DOI] [PMC free article] [PubMed] [Google Scholar]
- 14.Kellum R, Schedl P. A position-effect assay for boundaries of higher order chromosomal domains. Cell. 1991;64:941–950. doi: 10.1016/0092-8674(91)90318-s. [DOI] [PubMed] [Google Scholar]
- 15.Roseman RR, Pirrotta V, Geyer PK. The su(Hw) protein insulates expression of the Drosophila melanogaster white gene from chromosomal position-effects. EMBO J. 1993;12:435–442. doi: 10.1002/j.1460-2075.1993.tb05675.x. [DOI] [PMC free article] [PubMed] [Google Scholar]
- 16.Giraldo P, Rival-Gervier S, Houdebine LM, Montoliu L. The potential benefits of insulators on heterologous constructs in transgenic animals. Transgenic Res. 2003;12:751–755. doi: 10.1023/b:trag.0000005089.30408.25. [DOI] [PubMed] [Google Scholar]
- 17.Qianqian Z, Halfon MS. Vector-dependent gene expression driven by insulated P element reporter vectors. Fly. 2007;1:55–56. doi: 10.4161/fly.3892. [DOI] [PubMed] [Google Scholar]
- 18.Soriano P. Generalized lacZ expression with the ROSA26 Cre reporter strain. Nat. Genet. 1999;21:70–71. doi: 10.1038/5007. [DOI] [PubMed] [Google Scholar]
- 19.Yu J, McMahon AP. Reproducible and inducible knockdown of gene expression in mice. Genesis. 2006;44:252–261. doi: 10.1002/dvg.20213. [DOI] [PubMed] [Google Scholar]
- 20.Rong YS, Golic KG. Gene targeting by homologous recombination in Drosophila. Science. 2000;288:2013–2018. doi: 10.1126/science.288.5473.2013. [DOI] [PubMed] [Google Scholar]
- 21.Groth AC, Calos MP. Phage integrases: biology and applications. J. Mol. Biol. 2004;335:667–678. doi: 10.1016/j.jmb.2003.09.082. [DOI] [PubMed] [Google Scholar]
- 22.Groth AC, Fish M, Nusse R, Calos MP. Construction of transgenic Drosophila by using the site-specific integrase from phage phiC31. Genetics. 2004;166:1775–1782. doi: 10.1534/genetics.166.4.1775. [DOI] [PMC free article] [PubMed] [Google Scholar]
- 23.Bateman JR, Lee AM, Wu CT. Site-specific transformation of Drosophila via phiC31 integrase-mediated cassette exchange. Genetics. 2006;173:769–777. doi: 10.1534/genetics.106.056945. [DOI] [PMC free article] [PubMed] [Google Scholar]
- 24.Venken KJ, He Y, Hoskins RA, Bellen HJ. P[acman]: a BAC transgenic platform for targeted insertion of large DNA fragments in D. melanogaster. Science. 2006;314:1747–1751. doi: 10.1126/science.1134426. [DOI] [PubMed] [Google Scholar]
- 25.Bischof J, Maeda RK, Hediger M, Karch F, Basler K. An optimized transgenesis system for Drosophila using germ-line-specific phiC31 integrases. Proc. Natl. Acad. Sci. USA. 2007;104:3312–3317. doi: 10.1073/pnas.0611511104. [DOI] [PMC free article] [PubMed] [Google Scholar]
- 26.Brand AH, Perrimon N. Targeted gene expression as a means of altering cell fates and generating dominant phenotypes. Development. 1993;118:401–415. doi: 10.1242/dev.118.2.401. [DOI] [PubMed] [Google Scholar]
- 27.Arnone MI, Dmochowski IJ, Gache C. Using reporter genes to study cis-regulatory elements. Methods Cell Biol. 2004;74:621–652. doi: 10.1016/s0091-679x(04)74025-x. [DOI] [PubMed] [Google Scholar]
- 28.Struhl K. Transcriptional noise and the fidelity of initiation by RNA polymerase II. Nat. Struct. Mol. Biol. 2007;14:103–105. doi: 10.1038/nsmb0207-103. [DOI] [PubMed] [Google Scholar]
- 29.Presente A, Shaw S, Nye JS, Andres AJ. Transgene-mediated RNA interference defines a novel role for notch in chemosensory startle behavior. Genesis. 2002;34:165–169. doi: 10.1002/gene.10149. [DOI] [PubMed] [Google Scholar]
- 30.Kuhn EJ, Viering MM, Rhodes KM, Geyer PK. A test of insulator interactions in Drosophila. EMBO J. 2003;22:2463–2471. doi: 10.1093/emboj/cdg241. [DOI] [PMC free article] [PubMed] [Google Scholar]
- 31.Smith PA, Corces VG. The suppressor of Hairy-wing protein regulates the tissue-specific expression of the Drosophila gypsy retrotransposon. Genetics. 1995;139:215–228. doi: 10.1093/genetics/139.1.215. [DOI] [PMC free article] [PubMed] [Google Scholar]
- 32.Gerlitz O, Nellen D, Ottiger M, Basler K. A screen for genes expressed in Drosophila imaginal discs. Int. J. Dev. Biol. 2002;46:173–176. [PubMed] [Google Scholar]
- 33.Markstein M, Markstein P, Markstein V, Levine MS. Genome-wide analysis of clustered Dorsal binding sites identifies putative target genes in the Drosophila embryo. Proc. Natl. Acad. Sci. USA. 2002;99:763–768. doi: 10.1073/pnas.012591199. [DOI] [PMC free article] [PubMed] [Google Scholar]
- 34.Markstein M, et al. A regulatory code for neurogenic gene expression in the Drosophila embryo. Development. 2004;131:2387–2394. doi: 10.1242/dev.01124. [DOI] [PubMed] [Google Scholar]
- 35.Small S, Blair A, Levine M. Regulation of even-skipped stripe 2 in the Drosophila embryo. EMBO J. 1992;11:4047–4057. doi: 10.1002/j.1460-2075.1992.tb05498.x. [DOI] [PMC free article] [PubMed] [Google Scholar]
- 36.Reeves N, Posakony JW. Genetic programs activated by proneural proteins in the developing Drosophila PNS. Dev. Cell. 2005;8:413–425. doi: 10.1016/j.devcel.2005.01.020. [DOI] [PubMed] [Google Scholar]
- 37.Dietzl G, et al. A genome-wide transgenic RNAi library for conditional gene inactivation in Drosophila. Nature. 2007;448:151–156. doi: 10.1038/nature05954. [DOI] [PubMed] [Google Scholar]
- 38.Ledford H. Fly library boosts gene tool supply. Nature. 2007;448:115. doi: 10.1038/448115a. [DOI] [PubMed] [Google Scholar]
- 39.Dickins RA, et al. Tissue-specific and reversible RNA interference in transgenic mice. Nat. Genet. 2007;39:914–921. doi: 10.1038/ng2045. [DOI] [PMC free article] [PubMed] [Google Scholar]
- 40.Chintapalli VR, Wang J, Dow JA. Using FlyAtlas to identify better Drosophila melanogaster models of human disease. Nat. Genet. 2007;39:715–720. doi: 10.1038/ng2049. [DOI] [PubMed] [Google Scholar]
- 41.Robertson HM, et al. A stable genomic source of P element transposase in Drosophila melanogaster. Genetics. 1988;118:461–470. doi: 10.1093/genetics/118.3.461. [DOI] [PMC free article] [PubMed] [Google Scholar]
- 42.Liao GC, Rehm EJ, Rubin GM. Insertion site preferences of the P transposable element in Drosophila melanogaster. Proc. Natl. Acad. Sci. USA. 2000;97:3347–3351. doi: 10.1073/pnas.050017397. [DOI] [PMC free article] [PubMed] [Google Scholar]
- 43.Thummel CS, Pirrotta V. New pCaSpeR P-element vectors. Drosoph. Inf. Serv. 1992;71:150. [Google Scholar]
- 44.Geyer PK, Corces VG. DNA position-specific repression of transcription by a Drosophila zinc finger protein. Genes Dev. 1992;6:1865–1873. doi: 10.1101/gad.6.10.1865. [DOI] [PubMed] [Google Scholar]
- 45.Gloor GB, et al. Type I repressors of P element mobility. Genetics. 1993;135:81–95. doi: 10.1093/genetics/135.1.81. [DOI] [PMC free article] [PubMed] [Google Scholar]
- 46.Ranganayakulu G, Schulz RA, Olson EN. Wingless signaling induces nautilus expression in the ventral mesoderm of the Drosophila embryo. Dev. Biol. 1996;176:143–148. doi: 10.1006/dbio.1996.9987. [DOI] [PubMed] [Google Scholar]
- 47.Sun B, Xu P, Salvaterra PM. Dynamic visualization of nervous system in live Drosophila. Proc. Natl. Acad. Sci. USA. 1999;96:10438–10443. doi: 10.1073/pnas.96.18.10438. [DOI] [PMC free article] [PubMed] [Google Scholar]
- 48.Fietz MJ, Jacinto A, Taylor AM, Alexandre C, Ingham PW. Secretion of the amino-terminal fragment of the hedgehog protein is necessary and sufficient for hedgehog signalling in Drosophila. Curr. Biol. 1995;5:643–650. doi: 10.1016/s0960-9822(95)00129-1. [DOI] [PubMed] [Google Scholar]
- 49.Sullivan W, Ashburner M, Hawley RS. Drosophila protocols. Cold Spring Harbor Laboratory Press; Cold Spring Harbor, New York: 2000. [Google Scholar]
Associated Data
This section collects any data citations, data availability statements, or supplementary materials included in this article.