

A general tetramerization and oligomerization scheme is proposed for BenM and other LysR-type transcriptional regulators based on two newly characterized structures of the effector-binding domain of BenM. An analysis of these structures in the light of other LysR-type structures may explain the general solubility problems associated with this protein family.
Keywords: oligomerization, protein–protein interactions, LysR-type transcriptional regulators, BenM
Abstract
LysR-type transcriptional regulators comprise the largest family of homologous regulatory DNA-binding proteins in bacteria. A problematic challenge in the crystallization of LysR-type regulators stems from the insolubility and precipitation difficulties encountered with high concentrations of the full-length versions of these proteins. A general oligomerization scheme is proposed for this protein family based on the structures of the effector-binding domain of BenM in two different space groups, P4322 and C2221. These structures used the same oligomerization scheme of dimer–dimer interactions as another LysR-type regulator, CbnR, the full-length structure of which is available [Muraoka et al. (2003 ▶), J. Mol. Biol. 328, 555–566]. Evaluation of packing relationships and surface features suggests that BenM can form infinite oligomeric arrays in crystals through these dimer–dimer interactions. By extrapolation to the liquid phase, such dimer–dimer interactions may contribute to the significant difficulty in crystallizing full-length members of this family. The oligomerization of dimeric units to form biologically important tetramers appears to leave unsatisfied oligomerization sites. Under conditions that favor association, such as neutral pH and concentrations appropriate for crystallization, higher order oligomerization could cause solubility problems with purified proteins. A detailed model by which BenM and other LysR-type transcriptional regulators may form these arrays is proposed.
1. Introduction
BenM is a transcriptional regulator found in the soil bacterium Acinetobacter baylyi ADP1. Together with another transcriptional regulator, CatM, this regulator controls a large set of genes used by A. baylyi for aromatic compound degradation (Collier et al., 1998 ▶; Clark et al., 2002 ▶; Brzostowicz et al., 2003 ▶; Ezezika et al., 2006 ▶; Clark, Haddad et al., 2004 ▶). BenM is a member of the family of LysR-type transcriptional regulators (LTTR), the largest homologous family of transcriptional regulators in bacteria (Schell, 1993 ▶; Henikoff et al., 1988 ▶; Pareja et al., 2006 ▶). LTTRs control genes of diverse function that include the synthesis of virulence factors, CO2 fixation, antibiotic resistance, catabolism of aromatic compounds, nodule formation of N2-fixing bacteria and amino-acid biosynthesis. LTTRs are present in abundant and diverse bacterial genera (Diaz & Prieto, 2000 ▶). BenM specifically belongs to a subclass of this family involved in aromatic compound catabolism (Tropel & van der Meer, 2004 ▶).
Mutational analyses of this group of regulators demonstrate that the N-terminal region is required for DNA binding. This region comprises residues 1 to approximately 66 and displays high sequence identity among members (Schell et al., 1990 ▶). Removal of the N-terminal region aids structural studies by circumventing the insolubility problems associated with the full-length versions of these proteins, as observed in BenM and CatM (Clark, Haddad et al., 2004 ▶) and other LysR-type regulators such as CysB, OxyR and Cbl (Verschueren et al., 1999 ▶; Tyrrell et al., 1997 ▶; Choi et al., 2001 ▶; Stec et al., 2006 ▶). In the case of CysB, the addition of sulfobetaines was necessary to obtain crystals (Verschueren et al., 1999 ▶). BenM and CatM crystals were obtained using high concentrations of NaCl, glycerol and imidazole at a nonphysiological pH (Clark, Haddad et al., 2004 ▶; Ezezika et al., 2007 ▶). As a result, the structure determinations of truncated versions of LTTRs have been more successful than those of the full-length proteins. CbnR is the only example of a complete full-length LTTR structure and high concentrations of NaCl were involved in its crystallization (Muraoka, Okumura, Ogawa et al., 2003 ▶). Although a complete tetrameric DntR has been crystallized, the DNA-binding domain, which contains a helix–turn–helix motif, was poorly defined owing to weak electron density in the corresponding region (Smirnova et al., 2004 ▶). Other LTTRs, such as AmpR and GltC, have been difficult to purify from overexpression systems (Bishop & Weiner, 1993 ▶; Picossi et al., 2007 ▶).
CbnR is a homotetramer, but the CbnR monomers exist as two different conformations of the same polypeptide chain, making the tetrameric molecule a dimer of dimers. Tetramers are generally the active form of LTTRs, as noted for CbnR, CysB, NahR and DntR (Hryniewicz & Kredich, 1994 ▶; Muraoka, Okumura, Ogawa et al., 2003 ▶; Schell et al., 1990 ▶; Smirnova et al., 2004 ▶). BenM also exists as a tetramer in its active full-length form, although the reported molecular weight of 180 kDa is 25% higher than predicted (Bundy et al., 2002 ▶). Gel-filtration studies carried out on truncated BenM lacking the N-terminal DNA-binding domain showed that the effector-binding domain (EBD) exists as a homodimer in solution (Clark, Haddad et al., 2004 ▶).
BenM responds synergistically to two effector ligands, benzoate and cis,cis-muconate (hereafter referred to as muconate), to activate transcription of the ben genes (Bundy et al., 2002 ▶; Clark, Phillips et al., 2004 ▶). In contrast, CatM, a homolog of BenM, only responds to muconate. Recently, the structures of the EBDs of BenM and CatM were determined with and without their cognate effectors (Ezezika et al., 2007 ▶). These structures identify two distinct binding sites for the effectors and identify conformational changes associated with ligand binding that are likely to be associated with transcriptional activation. The primary effector-binding site is located at an interdomain cleft and can accommodate muconate or benzoate. The secondary effector-binding site can only accommodate benzoate in a hydrophobic pocket that communicates with the primary binding site. CatM lacks this secondary binding site. One unexplored area of the BenM structural studies is the interaction between its subunits. Here, we report two additional structures of the BenM EBD in different space groups that form tetramers and high-order oligomers in their unit cells. These structures suggest a general scheme by which this family of proteins might form oligomers. Surface-oligomerization domains were identified and analyzed in the context of other members of this family. Based on this analysis, we propose a model whereby the same interactions that yield biologically relevant LTTR oligomers can, under some conditions, contribute to the solubility problems associated with this family of transcriptional regulators.
2. Materials and methods
2.1. Purification
BenM EBD was expressed from a pET21b-based vector (Novagen) such that it had a C-terminal hexahistidine purification tag as described previously (Clark, Haddad et al., 2004 ▶). Purification of BenM EBD protein was performed as previously described using a 5 ml Hi-Trap metal-chelating column (GE Biosciences) charged with Ni2+ (Ezezika et al., 2007 ▶).
2.2. Crystallization
Prior to crystallization, BenM EBD was dialyzed into protein buffer consisting of 20 mM Tris–HCl pH 7.9, 0.5 M NaCl, 200 mM imidazole and 10%(v/v) glycerol. Crystallization setups were performed using the microbatch-under-oil method at 288 K (Chayen et al., 1992 ▶; Chayen, 1997 ▶) using conditions that had been identified in high-throughput screens (HTS) at the Hauptman–Woodward Institute (Luft et al., 2003 ▶). During HTS screens, some protein samples contained 5 mM muconate. Two conditions generated crystals with properties that differed from those identified in earlier reports (Clark, Haddad et al., 2004 ▶). The two crystals are here referred to as crystals (and structures) A and B (Table 1 ▶). For crystal A, 2 µl protein solution (6 mg ml−1) was mixed with 2 µl crystallization precipitant solution containing 0.1 M LiCl, 0.1 M N-Tris(hydroxymethyl)methyl-3-aminopropanesulfonic acid (TAPS) pH 9, 5 mM muconate (from a 0.2 M stock adjusted to pH 7 with NaOH) and 20% PEG 8000. Crystal B growth conditions were identical except for the use of a different precipitant: 100 mM KBr, 100 mM N-cyclohexyl-3-aminopropanesulfonic acid (CAPS) pH 10 and 20% PEG 4000. Proteins were centrifuged briefly in an Eppendorf microcentrifuge for ∼5 min at 14 000g before addition of the precipitant. Crystals were transferred into appropriate cryosolvents (35% glycerol or 35% polyethylene glycol 4000 for crystals A and B, respectively) that contained all of the crystallization components at concentrations 10% higher than those present in the mixture of the protein solution and precipitant. The crystal B cryosolvent also contained 70 mM benzoate, which was added in order to obtain an effector complex. Crystals with approximate dimensions 0.05 × 0.05 × 0.3 mm were flash-frozen in liquid N2 and shipped overnight in a dry cryogenic shipper prior to data collection.
Table 1. Crystal properties, data-collection and refinement statistics.
Values in parentheses are for the highest resolution shell.
| Structure A (PDB code 2f97) | Structure B (PDB code 2f8d) | |
|---|---|---|
| Crystallization conditions | 0.1M LiCl, 0.1M TAPS pH 9, 5 mM cis,cis-muconate, 20% PEG 8000 | 100 mM KBr, 0.1M CAPS pH 10, 20% PEG 4000 |
| Data-collection statistics | ||
| Space group | P4322 | C2221 |
| Unit-cell parameters () | a = 70.0, b = 70.0, c = 187.7 | a = 94.1, b = 106.4, c = 184.3 |
| Resolution () | 702.2 | 46.12.7 |
| Completeness (%) | 99.99 (99.9) | 98.4 (98.1) |
| I/(I) | 66.0 (5.91) | 28.1 (5.85) |
| Redundancy | 20.9 | 7.16 |
| R merge (%) | 6.3 (76.9) | 9.3 (42.1) |
| Refinement statistics | ||
| Resolution range () | 46.92.2 (2.282.20) | 46.12.7 (2.802.70) |
| No. of reflections | 23294 (1626) | 24161 (1685) |
| R cryst (%) | 17.6 (24.2) | 14.8 (22.2) |
| R free † (%) | 20.9 (30.6) | 19.5 (24.1) |
| No. of solvent atoms | 295 | 596 |
| Ligands | 4 PEG, 1 acetate | 3 benzoate, 6 glycerol |
| Mean temperature factor B (2) | ||
| Main chain | 38.0 | 27.7 |
| Side chain | 39.3 | 27.8 |
| Solvent | 58.4 | 52.2 |
| Root-mean-square deviations | ||
| Bond lengths () | 0.008 | 0.008 |
| Bond angles () | 1.115 | 1.301 |
| Ramachandran plot statistics (%) | ||
| Most favored | 94.7 [177 residues] | 93.4 [356 residues] |
| Additionally allowed | 5.3 [10 residues] | 6.6 [25 residues] |
| Generously and disallowed | 0 | 0 |
R free was calculated on a 5% subset of all measured reflections.
2.3. Data collection and structure determination
Diffraction data were collected at the Structural Biology Center Collaborative Access Team (SBC-CAT) 19-BM beamline at the Advanced Photon Source, Argonne, IL, USA using 0.5° oscillations, a wavelength of 1.00727 Å and a MAR Research CCD detector set at a detector-to-crystal distance of 194 mm. Data were processed and scaled using the beamline version of HKL-2000 (Otwinowski & Minor, 1997 ▶) and resulted in 99.6 and 98.2% complete data sets extending to 2.2 and 2.7 Å resolution for structures A and B, respectively (Table 1 ▶). The space groups were ultimately found to be P4322 and C2221 for structures A and B, respectively. Structure A contained a monomer in the asymmetric unit. Two monomers in the asymmetric unit were observed for structure B. Structure A was initially indexed and the structure solved in a lower symmetry space group (Laue 4/m) until it was realised that the refined structures of the two monomers were identical except in two poorly defined regions at the N- and C-termini that were modeled differently. The data were reindexed and scaled in the correct space group, P4322. On reprocessing the data, the I/σ(I) ratio improved from 3 (our routine data-processing cutoff) to 5 in the high-resolution bin despite an increase in the R merge from 56.4 to 76.9%. We account for this as being a consequence of the increased redundancy in the higher symmetry space group (20-fold) applied to very weak data. The R free in the high-resolution bin was a reasonable 31%, the theoretical σ values output from SCALEPACK matched the measured σ values and the χ2 values were approximately 1. The C2221 data set, although having a triclinic cell very close to the 4/mmm space group, does not satisfy 4/mmm symmetry.
The solutions of both structures A and B were straightforward using the coordinates of the previously solved BenM EBD native structure (PDB code 2f7a) as a molecular-replacement model. The program MOLREP from the CCP4 suite (Collaborative Computational Project, Number 4, 1994 ▶) was used for molecular replacement. Since the original BenM EBD structures solved in space group P212121 had two copies of the monomer per asymmetric unit, both monomers were separately used as independent search models in the BenM EBD structures. Rigid-body refinement in REFMAC with subdomains I (residues 88–161 and 268–304) and II (residues 162–267) refined as separate bodies was performed before any refinement or model building. Several rounds of positional and isotropic B-factor refinement using REFMAC (Murshudov et al., 1997 ▶; Vagin et al., 2004 ▶) and manual modeling using O (Jones et al., 1991 ▶), Swiss-PDBViewer (Guex & Peitsch, 1997 ▶) and Coot (Emsley & Cowtan, 2004 ▶) with ARP water identification (Perrakis et al., 1999 ▶) were performed. All water positions were manually verified using water-analysis tools in Coot (Emsley & Cowtan, 2004 ▶). The computer program MOLPROBITY (Lovell et al., 2003 ▶) was used to evaluate the correctness of the side chains of histidine, asparagine and glutamine residues as well as to identify likely remaining errors during the refinement process. The refinement process included TLS temperature-factor refinement (Winn et al., 2001 ▶), with structure A defined by 14 groups identified by the TLSMD web server at http://skuld.bmsc.washington.edu/~tlsmd/ (Painter & Merritt, 2006 ▶). Structure B was defined by four groups representing the two domains of each EBD monomer. Several small molecules were added to the models that best accounted for the electron density and that were also consistent with the composition of the cryosolvents. The model for structure A included several short chains of PEG consistent with long continuous electron density. Structure B included several glycerol molecules as well as three benzoate molecules in positions previously identified as effector-binding sites (Ezezika et al., 2007 ▶).
The quality of the models was analyzed using PROCHECK (Laskowski et al., 1993 ▶). Hydrogen bonds between protein atoms were calculated using SwissPdbViewer (Guex & Peitsch, 1997 ▶) with the default parameters for distance and angles. Salt bridges were inferred when aspartic or glutamic acid side-chain carboxyl O atoms were found to be within 4.0 Å of the side-chain N atoms of arginine, lysine or histidine amino acids. Accessible surface areas and interface characteristics were calculated using a protein–protein interaction server (http://www.biochem.ucl.ac.uk/bsm/PP/server/) based on work performed by Jones and Thornton (Jones et al., 2000 ▶; Jones & Thornton, 1996 ▶). Molecular-graphics figures were produced using PyMOL (DeLano, 2002 ▶). Comparison of the two structural models was performed using SwissPdbViewer (Guex & Peitsch, 1997 ▶).
3. Results and discussion
3.1. Crystallization and structure determination
Previous structures of BenM EBD with and without benzoate and/or muconate crystallized in space group P212121 from conditions consisting of low-pH precipitants (pH 4.6) and complex anion compositions (acetate, chloride and sulfate; Clark, Haddad et al., 2004 ▶). High-throughput screens revealed a subset of conditions that had higher pH buffers than previously used, some of which uniquely required the effector muconate. Crystals grown under the higher pH conditions reported here, where the precipitant solutions were at pH 9 and 10, were found to belong to two different space groups with different unit-cell parameters. The morphology of both crystal forms was rod-like, with the short axes about 0.05 mm. While still containing high chloride levels owing to the presence of 0.25 M NaCl in the protein buffer, no sulfate or acetate ions were present in the crystallization cocktail. Because the protein solution itself had significant buffering capacity owing to the high imidazole and minimal Tris concentrations, the actual pH of the final crystallization conditions would lie between that of the protein solution and the pH of the precipitant solution. The presence of muconate was necessary for growing crystal A, although no muconate molecules could be identified in the final structure. While the second crystal form was grown without the effector benzoate, benzoate was added to the cryosolvent to create a benzoate-complex crystal. Interestingly, crystals grown from condition B that were frozen in cryosolvents lacking benzoate did not diffract adequately for structure determinations.
The crystal characteristics and data-collection statistics for both crystal forms (structures A and B, space groups P4322 and C2221, respectively) are given in Table 1 ▶. Phasing of the structures was straightforward using the previously determined atomic structures of BenM EBD as molecular-replacement models. Crystal structures A and B contained a monomer or a dimer in the asymmetric unit, respectively. The high symmetry shared by the crystals and their similar triclinic cells suggested that the crystal packing within the cells might be similar. Space group C2221 becomes space group P4322 with the addition of twofolds parallel to the ab diagonals and translationally offset 1/8 along the c axis. The noncrystallographic twofold within the asymmetric unit of crystal B is roughly parallel to the diagonal of the C2221 cell. The ab diagonal for the tetragonal cell with a = 70 Å as in crystal A is 99.0 Å, which lies between the values for the a and b unit-cell parameters of the C2221 crystal, which are 94.1 and 106.4 Å, respectively. The c axes of the two crystal forms are nearly identical at 187.7 and 184.3 Å. Thus, the packing arrangements of the two structures are similar. The asymmetry within crystal B may arise from the asymmetric distribution of the benzoate in the primary effector-binding site. Crystal A is the first structure that we have obtained that has a single molecule of BenM in the asymmetric unit. Usually, some asymmetry is present, as is the case in crystal B. It is conceivable that crystal B started out with the P4322 space group and the addition of benzoate (after crystal growth) caused a polymorphic change. Unfortunately, both of these crystal forms have been difficult to produce with any significant size and the crystals that were not supplemented with benzoate did not diffract adequately for a structure determination despite being grown without benzoate.
3.2. The monomer–monomer interface of BenM EBD
The full-length native BenM protein is a homotetramer in solution (Bundy et al., 2002 ▶). This is consistent with results showing that most LysR-type regulators exist as tetramers (Muraoka, Okamura, Ogawa et al., 2003 ▶; Tropel & van der Meer, 2004 ▶). However, gel-filtration studies carried out on a truncated form of the protein from which the 88 N-terminal residues had been removed showed that BenM EBD exists as a homodimer in solution (Clark, Haddad et al., 2004 ▶). In all of the structures of the BenM EBD determined so far, whether obtained at lower pH values in previous work or here, two monomers are intimately associated with each other to form a stable dimer with a common interface. In several cases, there are two monomers in the asymmetric unit (the low-pH space group P212121 and structure B here). The monomeric structure of BenM EBD is an α/β structure that consists of nine α-helices and nine β-strands (Fig. 1 ▶ a). Two subunits form a dimer by antiparallel side-by-side alignment of the monomers (Fig. 1 ▶ b), which are related by noncrystallographic twofold symmetry as observed for structure B. Although the number of molecules in the asymmetric unit of structure A was one, a second twofold-related monomer could be generated by applying the crystallographic symmetry operator −x, y, −z to form a dimer similar to that in the asymmetric unit of structure B. The crystallographically related monomer–monomer interface in structure A is identical to the noncrystallographic monomer–monomer interface in structure B.
Figure 1.
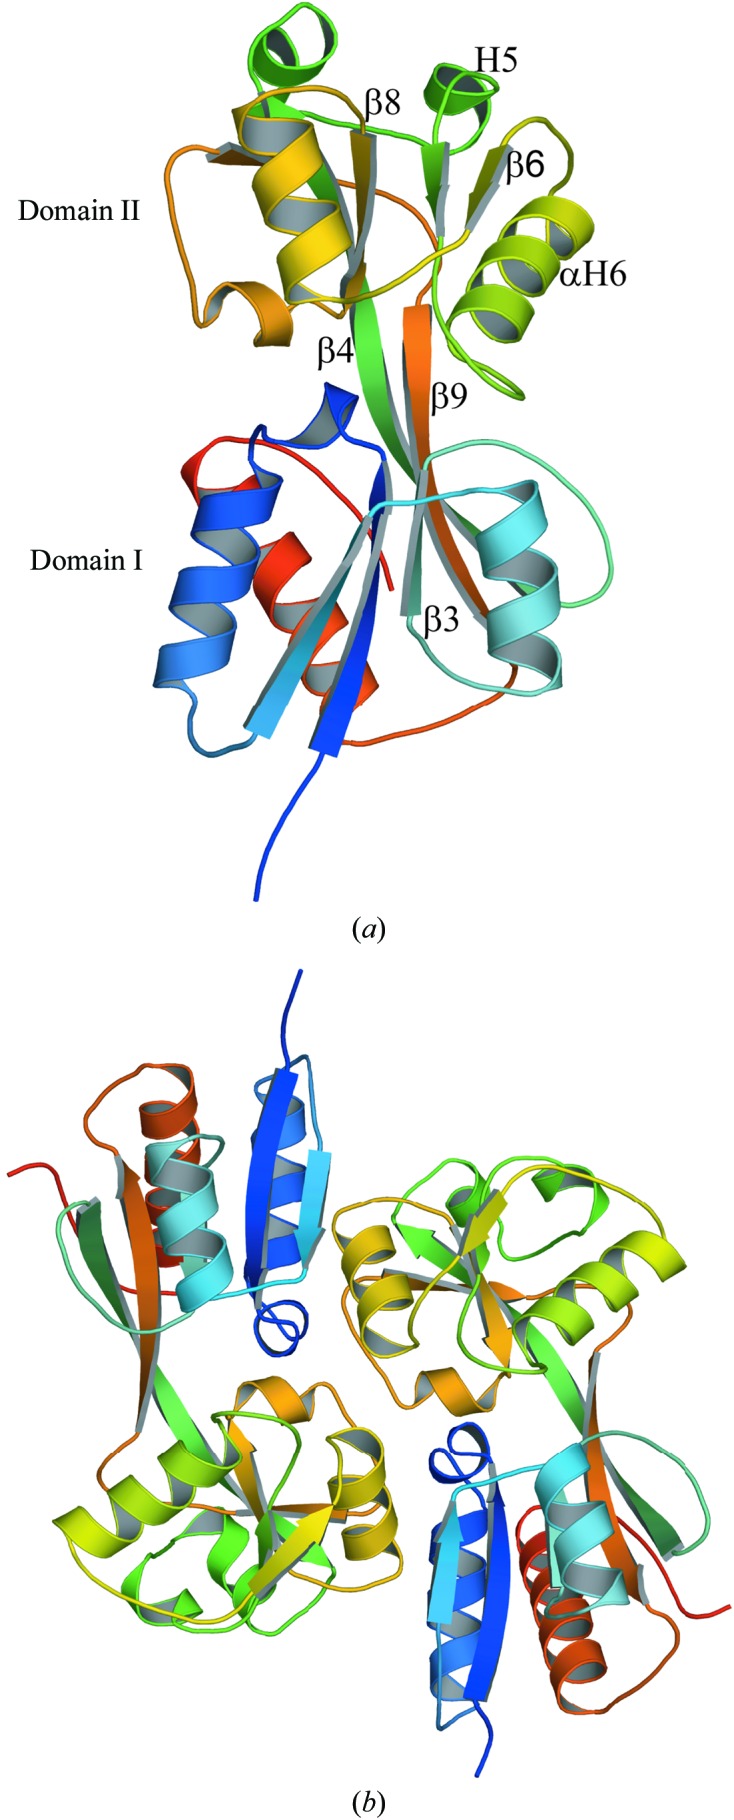
Ribbon representation of the monomeric and dimeric structures of BenM EBD structure A. (a) Structure of a monomer of BenM EBD. The secondary structures used for tetramerization are indicated. The monomer can be divided into two major domains: domain I (residues 81–161 and 268–296) and domain II (residues 162–267). (b) View of the dimeric structure of BenM EBD. The secondary structures are colored from blue to red going from the N-terminus to the C-terminus.
The r.m.s. deviation between the subunits of structure A and structure B was less than 1.21 Å for the backbone atoms and 1.45 Å for all atoms. When comparing the main-chain traces of the refined structures and the previously solved structures, no significant differences were observed. The overall similarities between these structures and other BenM EBD structures were comparable, with an r.m.s. deviation of less than 1.6 Å for all atoms. Stable interactions are present between both monomers to form the dimeric arrangement in structure B. These interactions comprise hydrogen bonds, hydrophobic interactions and salt bridges. The interaction between both subunits in the dimer buries a surface of 1315 Å2 on each molecule. The core region of the interface is composed of hydrophobic residues: Leu101, Pro106, Ile109, Leu123, Val227, Leu229, Leu233, Ala235, Ala236, Ile250 and Leu252. Surrounding these hydrophobic residues are hydrophilic residues that provide hydrogen bonds and salt bridges: these residues include Arg113, Glu125, Arg225, Glu226, Gln228, Ala236, Glu238, Ser249 and Gln251. Taken together, these interactions are structurally very similar to the two monomer–monomer interfaces observed for CbnR (Muraoka, Okamura, Urugami et al., 2003 ▶). Despite the common structural features found among LTTRs in this region, the primary sequences contributing specific amino-acid interactions are typically unrelated even within closely related families, such as within the aromatic compound catabolism regulator family that includes DntR, CbnR, BenM and CatM. DntR, for example, has an extended β-sheet across the monomer interface that is not found at all in BenM or CbnR.
3.3. The tetramerization interface
Two neighboring dimers in the crystal lattice interact with each other to form a well defined tetrameric unit. In structure A (Fig. 2 ▶ a), which contains a monomer in the asymmetric unit, a tetramer could be generated by applying the symmetry operation y, x, 1/4 − z to the twofold-related dimer of structure A described in §3.2. The adjacent dimer to make the tetramer of structure B could be generated by applying the crystallographic symmetry operator −x + 1, y, 1/2 − z. The high pH of the crystallization conditions more closely mimics physiological conditions than the previously reported low-pH conditions. This may account for BenM EBD packing as tetramers, compared with the previously solved structures in which only dimeric complexes were observed. Differences in the pH of crystallization conditions have been shown to affect the oligomerization states of proteins in crystal lattices. For example, in the crystallization of the Esp8 SH3 domain, the pH of the crystallization condition could be controlled to produce either individual independent monomers or dimers in the asymmetric unit (Kishan et al., 2001 ▶). The general characteristics governing the tetrameric interface between both subunits were comparable. The surface area buried by the interaction of the dimers was approximately 883 and 998 Å2 for structures A and B, respectively. This was similar to the 855 Å2 observed in the dimer–dimer interface of CbnR (Fig. 2 ▶ b and Table 2 ▶) and of DntR (Fig. 2 ▶ c). The planarity was also similar between the BenM EBD structures and CbnR; this is a measure of how far the interface residues deviate from a best-fit plane calculated through the three-dimensional coordinates of the atoms in the interface using principal-component analysis (Jones & Thornton, 1996 ▶). Other parameters such as the length and breadth of the interfaces, length/breadth ratios and relative percentages of polar and nonpolar atoms in the interface were similar between the BenM structures and CbnR. ‘α’ was the predominant secondary classification of the interface, with the involvement of some random-coil and β-strand residues.
Figure 2.

Ribbon representations of the BenM EBD tetramer structure A in the P4322 space group (a) and the full-length LTTRs CbnR (b) and DntR (c). The secondary structures of each subunit are colored from blue to red going from the N-terminus of the effector-binding domain to the C-terminus. Arrows point to unliganded tetramerization sites. The tetramerization interface of BenM is shown within a box. The yellow–green helices centered within the box are BenM EBD helix αH6. The structurally homologous helices in CbnR and DntR are also colored yellow–green. The DNA-binding domains of CbnR are colored gray. Although DntR crystallized as a full-length protein, no coordinates are available for the DNA-binding domains. The unliganded tetramerization sites are not sterically hindered from forming additional oligomers. We propose that these available sites promote high-order oligomerization and may serve as the basis for the low solubility of this class of proteins under some conditions.
Table 2. Analysis of the tetrameric interfaces of the two BenM EBD structures and the structure of CbnR from Ralstonia eutropha .
| Structure A (PDB code 2f97) | Structure B (PDB code 2f8d) | CbnR† (PDB code 1iz1) | |
|---|---|---|---|
| Interface-accessible surface area (2) | 882.84 | 997.6 | 854.57 |
| Interface-accessible surface area (%) | 8.01 | 8.79 | 8.17 |
| Planarity‡ | 2.78 | 3.12 | 2.62 |
| Length/breadth () | 40.59/18.61 | 40.01/22.63 | 37.74/24.02 |
| Length/breadth ratio | 0.33 | 0.28 | 0.56 |
| Secondary-structure classification§ | |||
| Polar atoms in interface (%) | 48.8 | 43.0 | 42.8 |
| Nonpolar atoms in interface (%) | 52.2 | 57.0 | 57.2 |
| Segmentation¶ | 6 (4) | 5 (4) | 4 (3) |
Computations were performed using the A and P monomers of CbnR which constitute its tetrameric interface. CbnR has one tetramer per asymmetric unit. The DNA-binding domain and helix linker (residues 189) of CbnR were excluded from calculations.
Planarity is a measure of how far the interface residues deviate from a best-fit plane. This plane is calculated through the three-dimensional coordinates of the atoms in the interface using principal-component analyses.
Secondary-structure classification represents the secondary-structure feature that occurs with the greatest frequency of and secondary structures in the interface residues.
Segmentation is the number of discontinuous segments of the polypeptide involved in the interface interaction. The number in parentheses refers to the number of segments that result when segments containing single or double residues are not considered as separate segments.
The hydrophobic residues in the dimer–dimer interface of BenM consisted of Leu147, Lys148, Ile149, Leu184, Pro201, Gly215, Leu216, Pro263 and Pro268. Other residues, some of which were involved in hydrogen bonding and/or the formation of salt bridges, included Thr128, Lys129, Lys148, Ser150, Asp151, Arg156, His183, Asn185, Asp186, Thr205, His206, Asn209, Ser212 Asp213, His214, Gly215, Asp262 and Asp264.
Dimers interact with one another through helices αH6 and H5 (a 310-helix), strand β4 and random-coil loops. α-Helix αH6 interacts with its symmetry-related partner through hydrogen bonds between the side chains of residues Asn209 and Ser212 in an antiparallel fashion (Table 3 ▶; Fig. 3 ▶ a). The average distance between the backbones of both helices is about 7.5 Å. There were approximately ten direct hydrogen bonds between dimers for both structures (Table 3 ▶). Although the α-helix was seen as the major secondary-structure interaction, interacting surfaces were also found at the N-terminal end of β-strand β4, comprising residues 155–161, and the loop before the β-strand, involving residues 147–152. Ser150 (in the loop between β3 and β4) from one dimer interacts with Asn185 (H5), His214 (in the loop between αH6 and β6) and Asp262 (in the loop between β8 and β9) from the other dimer to form an ion-pair network (Table 3 ▶; Fig. 3 ▶ b). A salt bridge is formed between Arg156 (in β4) and Asp264 (in the loop between β8 and β9) (Table 3 ▶, Fig. 3 ▶ c). A hydrogen bond is formed between Lys148 (in the loop between β3 and β4) and Asp 213 (in αH6). Apart from these direct interactions between residues, there were also many additional hydrogen bonds mediated by water molecules.
Table 3. Distances between atoms at the tetrameric interfaces.
| Structure A (PDB code 2f97) | Structure B (PDB code 2f8d) | ||
|---|---|---|---|
| Interaction† | Distance‡ () | Distance, A subunit§ () | Distance, B subunit§ () |
| Lys148NAsp213O | 3.50 | 2.90 | 3.73 |
| Lys148OGly215N | 3.23 | [4.08] | 3.55 |
| Lys148NZAsp264OD2 | 3.01 | 3.5 | 3.87 |
| Ser150NHis214O | 3.21 | [4.59] | 3.35 |
| Ser150OGLeu184N | 3.49 | 3.28 | 3.52 |
| Ser150OGAsp262OD1 | 2.66 | 2.83 | 2.61 |
| Ser150OGAsn185N | 3.16 | 3.11 | 3.17 |
| Arg156NH2Asp264OD1 | 4.67 ¶ | 2.84 | 3.91 ¶ |
| Asn209OD1Ser212OG | 2.69 | 4.05 | 2.83 |
In addition to the interactions listed, there are symmetry-related interactions generated by the crystallographic twofold that bisects the interface.
Not all distances presented are suggested to be ionic or hydrogen bonds. In some cases, the distance between the atoms is provided in order for comparison with its equivalent counterpart in the other structure. Distances greater than 3.4 are italicized. Bracketed distances do not represent contacting atoms.
The A subunit contains a molecule of benzoate in the primary effector-binding site. Both subunits have benzoate molecules in the secondary effector-binding sites. The A subunit interacts with a symmetry-related (x,y,z + 1/2) A subunit at the tetramerization interface, while the B subunit interacts with a symmetry-related (x, y,z) B subunit.
A water molecule bridges these atoms.
Figure 3.
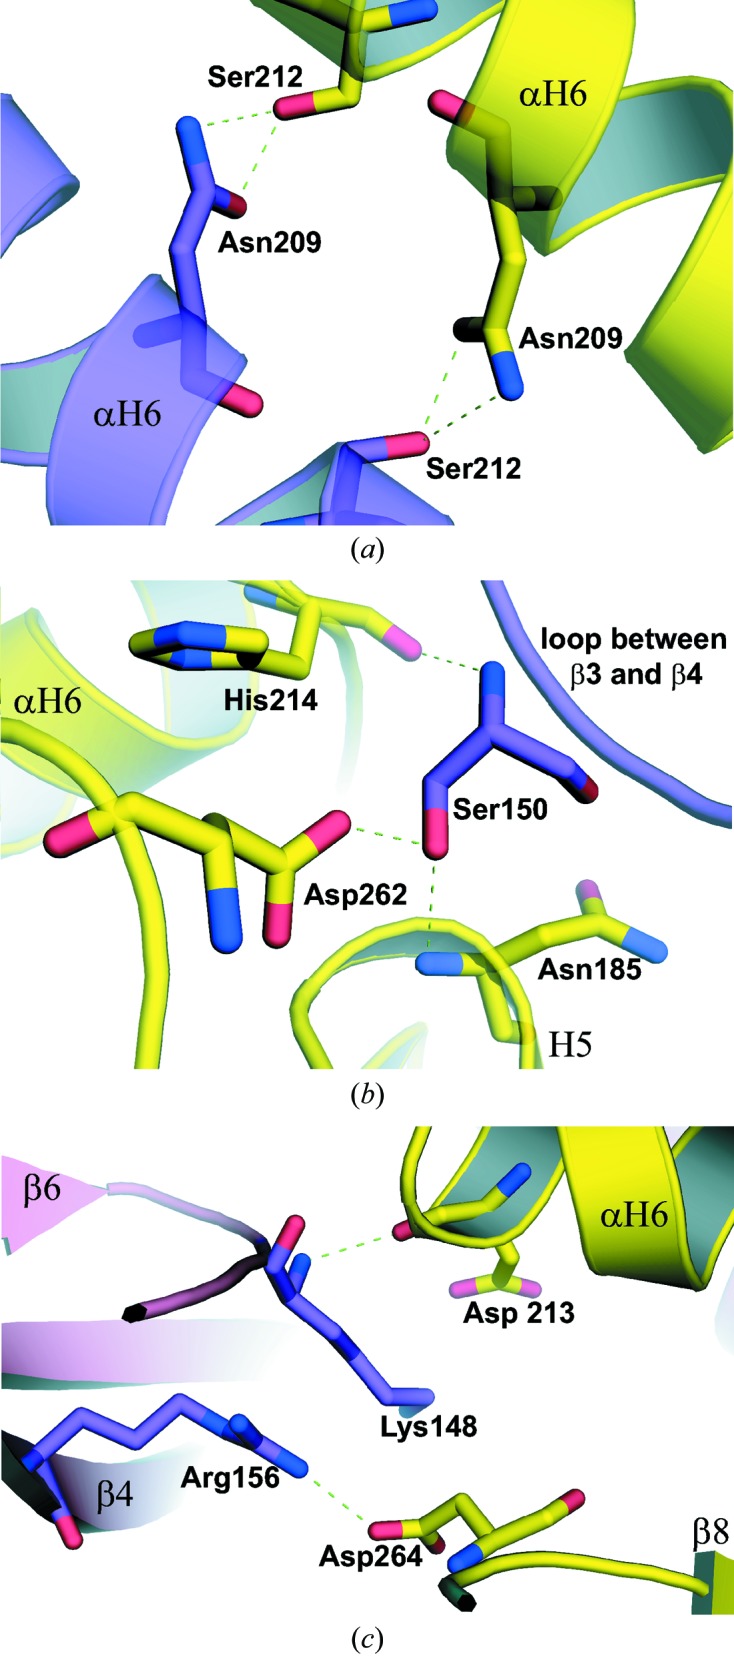
Interactions at the tetrameric interface of crystal structures A and B. One monomer from a dimer is shown with the backbone and C atoms colored purple, with the other twofold-related interacting monomer colored yellow. Interactions between residues on the helices (αH6) of interacting dimers in crystal structure A are shown in (a). Hydrogen bonds between Ser150 from one dimer and three other residues from another dimer, applicable to both structures, are shown in (b). Interactions at the tetrameric interface of crystal B around residues Lys148, Arg156, Asp213 and Asp264 are shown in (c). Distances between the residues are listed in Table 3 ▶.
While the interfaces are similar in the two BenM EBD crystal forms, the fact that some residues are closer or farther away in one structure with respect to the other suggests that there is some flexibility in the interface. Intriguingly, the B subunit of structure B, which lacks a benzoate in the primary effector-binding site (but has a benzoate in the secondary site), has interaction distances (chain B to chain B) at the tetramerization site that match closely with structure A. The A subunit of structure B, which contains a molecule of benzoate in the primary site, has significant deviations at the chain A–chain A tetramerization interface. Whether the specific structural differences seen here correlate with different conformational states that may be biologically significant is not clear. However, this conformational flexibility may be critically important in allowing LTTRs to change global conformations when their effector ligands are bound. Some of the residues, such as Lys148, are involved in the interfaces of both structures, but they pair with different ionic partners. This flexibility may confer a thermodynamic balance between conformations such that effector binding can cause a large structural change while keeping the dimers associated.
3.4. Crystal packing and oligomerization
By applying the crystallographic symmetry operations in both space groups, an extended oligomerization scheme was observed. The packing arrangements of structures A (space group P4322) and B (C2221 space group) are shown in Fig. 4 ▶. Although crystal structure A contained one subunit in the asymmetric unit, a BenM EBD dimer could be generated by applying the appropriate crystallographic symmetry transformation (−x, y, −z). The monomer can interact with another monomer by an antiparallel side-by-side alignment, making it identical to the dimer in the asymmetric unit of the crystal structure B dimer (Fig. 1 ▶ b). The other dimers as seen in the complete unit cell of structure A were built by applying the following symmetry operations to the generated BenM EBD dimer of structure A: y, x, 1/4 − z; y, −y + 1, 1/2 − z; −y + 1, x, 3/4 + z; x, y, z + 1. The other three dimers in the unit cell of structure B were built using the following symmetry operations: −x + 1, y, 1/2 − z; −x + 1, −y + 1, 1/2 − z; x, −y + 1, −z + 1.
Figure 4.

Packing representations of BenM EBD structures A (a) and B (b). The unit cell is outlined in black and the a, b and c crystallographic cell axes are shown. Structure A is colored by monomers as it has a monomer in the asymmetric unit. Structure B is colored by dimers as it has a dimer in the asymmetric unit. The placement of the noncrystallographic twofold axis of structure B parallel to the ab diagonal and positioned at c = ∼3/8 recreates the P4322 cell packing of structure A. Only half of the unit-cell contents of structure B are shown.
A continuous oligomer using the tetramerization interface was visualized by expanding the asymmetric units to the full unit cells of both crystal structures. A high-order oligomeric array could be computed for both crystal structures as shown in their unit cells by applying appropriate crystallographic symmetry operators (Fig. 4 ▶). Assembly via this interface does not rely on contacts between the DNA-binding domains, although the DNA-binding domains interlock the tetramer through a long linker helix. For example, as can be seen in Fig. 2 ▶(b), the DNA-binding domains of the different subunits of CbnR do not show any interaction with each other across the tetrameric interface (Muraoka, Okamura, Ogawa et al., 2003 ▶). Furthermore, modeling of CbnR tetramers into the structure A oligomeric array does not introduce any steric clashes from the DNA-binding domain with neighboring tetramers (not shown). While several lattice contacts in CbnR (PDB code 1iz1) include residues associated with the tetramerization interface, the lattice-forming interactions are completely different in nature from dimer–dimer interactions. For instance, the helix in CbnR that corresponds to the BenM EBD helix αH6 (Fig. 1 ▶ a) does not interact with a twofold-related helix αH6 in the lattice contacts. Conditions that disfavor the αH6/αH6 interactions may account for the success in crystallizing this particular full-length LTTR.
Interestingly, the tetrameric interactions used by CbnR are also observed in another full-length LTTR structure. The same helix (αH6) involved in the tetrameric interactions of CbnR (Fig. 2 ▶ b) is observed in DntR (Fig. 2 ▶ c), although the helices are oriented differently with respect to the effector-binding domains (Smirnova et al., 2004 ▶). The predominant segment of residues in the tetrameric interface of DntR (Gly205–Lys219) are analogous to residues Lys200–Glu217 of the tetrameric interface of BenM. Overall, the tetrameric interfaces observed for full-length DntR and the effector-binding domain of BenM are comparable to CbnR, as they employ similar secondary-structural elements and analogous residues, but with different orientations of the secondary-structure elements. This may be biologically relevant as the LTTRs bind different promoters with different configurations of the protein–DNA interaction sites.
Fig. 5 ▶ shows a schematic diagram of two possible pathways by which extended oligomerization may occur for BenM and LTTRs in general. In pathway A, two dimers interlock through the DNA-binding domains and associate at the tetramerization interface to stabilize the tetramer as a single unit. However, two tetramerization sites are left accessible to other tetramers (see also Fig. 2 ▶). At high protein concentrations, linear arrays might form that could ultimately precipitate. If it were to form in this fashion, the array could readily dissociate to individual tetramers. The open and closed ovals in the figure denote two different conformations of the DNA-binding domains, as observed in the structure of CbnR (Muraoka, Okamura, Ogawa et al., 2003 ▶). Modeling of CbnR tetramers indicates that pathway A is feasible. In pathway B, domain swapping might occur such that the DNA-binding domains now interact with dimers from nearby molecules. In this proposed pathway an individual tetramer is no longer formed. If the array were to form in this fashion, it would likely not dissociate as readily as the array in pathway A. We have not evaluated whether pathway B is conformationally possible. A permutation of pathway B that is not shown would include the formation of conformationally identical DNA-binding domains (both ovals open or both ovals closed). Pathway B could be particularly problematic in a cellular environment when LTTRs are overexpressed at high concentrations in heterologous systems with strong promoters.
Figure 5.
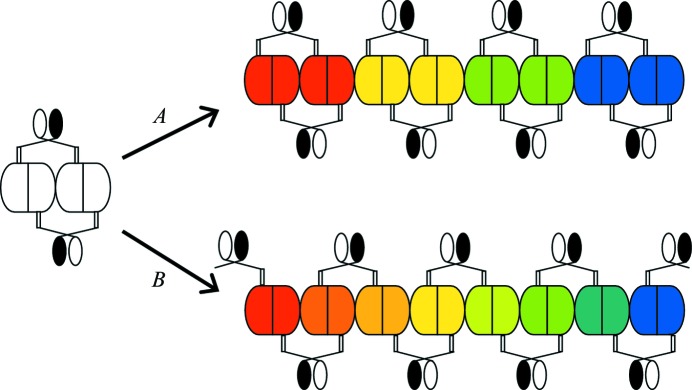
Proposed pathways for the oligomerization of BenM in light of the CbnR structure (PDB code 1iz1). Two avenues by which oligomerization could take place are shown. Pathway A shows a high-order oligomer formation in which there are no interactions of the DNA-binding domains (represented by the open and closed ovals) between adjacent tetramers in the tetrameric interface. Two oligomerization interfaces are present: one interface within a tetramer and a second between two tetramers. Pathway B shows an alternate route for oligomer formation. In this case, the DNA-binding domains interact across all of the tetramerization interfaces. The tetramers are colored red, yellow, green and blue in pathway A, but there is not a defined tetrameric unit in pathway B. The DNA-binding domains assume two conformations in the structure of CbnR and thus are represented as two different ovals, open and closed. The dimer interface is shown as a straight line, while the tetramerization interface of each monomer is a convex surface.
4. Conclusion
Protein molecules tend to form random crystal-packing contacts during crystallization (Carugo & Argos, 1997 ▶). In most cases, little biological significance is assigned to these contacts. However, the analysis presented here evaluates these interactions in LTTRs in the context of the formation of functional tetramers. This analysis takes into account the fundamental properties that characterize physiologically relevant protein–protein interactions (Jones & Thornton, 1996 ▶; Jones et al., 2000 ▶).
Refinement of two BenM EBD structures of different space groups to resolutions of 2.2 and 2.7 Å from relatively high-pH crystallization conditions allowed us to assess the tetrameric interface in this LysR-type transcriptional regulator. Residues were identified in this interface that appear to interact in the formation of a tetrameric molecule. The crystal packing observed in both structures suggests that this same tetrameric interface can be used to form high-order oligomers. We propose that this oligomerization scheme is found in LTTRs as a class and that it may be the cause of the insolubility problems associated with BenM and other proteins in this family. An LTTR tetramer appears to leave two additional unused tetramerization sites exposed. These sites may lead to further oligomerization in solution. In the tetrameric CbnR structure (Muraoka, Okamura, Ogawa et al., 2003 ▶), the interactions in the tetrameric interface employ significantly similar surface contacts as BenM EBD. Thus, analysis of the sole known tetrameric structure of a full-length LTTR is consistent with our interpretation of the BenM EBD structures presented here.
Several general observations can be made concerning the biological significance of the protein–protein interactions in LTTR oligomers. Firstly, while the monomer–monomer (dimer interface) interactions and the dimer–dimer (tetramer interface) interactions are structurally well conserved in BenM and CbnR, the sequence similarity between these regions is low. Thus, the local nature of the interactions differs between the LTTRs. Such differences may be biologically advantageous if they prevent the formation of mixed LTTR dimers or tetramers that could produce deleterious metabolic consequences. Since most LTTRs are subject to negative autoregulation, their concentration in vivo most likely remains at a level below one that would favor oligomerization beyond a tetramer. While the formation of high-order oligomers may not normally be an issue in cells, it becomes interesting to the crystallographer as it creates problems with solubility of the protein at the near-millimolar concentrations routinely used for crystallization trials. Solubility problems are not only manifest in the full-length proteins, where they are extreme, but they are also evident in the truncated effector-binding domains. Mutagenesis at the tetramerization interface is not likely to provide a solution as changes that prevent oligomer formation are likely to interfere with biological function and to prevent relevant structural analysis. We are attempting to cap the exposed tetramer interfaces using antibody fragments as one approach to solving the problem. Alternatively, crystallization attempts might be made at submillimolar concentrations in the presence of interface-destabilizing buffer components. We anticipate that structural studies of LTTRs will be hampered as long as the oligomerization issue in this family is not fully addressed.
Supplementary Material
PDB reference: effector-binding domain of BenM, P4322, 2f97, r2f97sf
PDB reference: C2221, 2f8d, r2f8dsf
Acknowledgments
We are grateful to the staff at the Hauptman–Woodward Institute for performing the high-throughput crystallization screens and the staff at the Structural Biology Centre Collaborative Access Team (SBC-CAT) 19-BM beamline (Advanced Photon Source, Argonne National Laboratory) for assistance in X-ray data collection and for the use of their facility. Use of the Advanced Photon Source was supported by the US Department of Energy, Office of Science and Office of Basic Energy Sciences under Contract No. W-31-109-Eng-38. We also thank Michelle Momany for assistance in collecting X-ray data and Peter Horanyi for useful suggestions concerning the manuscript preparation. This research was supported by grants MCB 0346422 to CM and MCB 0516914 to ELN from the National Science Foundation.
References
- Bishop, R. E. & Weiner, J. H. (1993). Eur. J. Biochem. 213, 405–412. [DOI] [PubMed] [Google Scholar]
- Brzostowicz, P. C., Reams, A. B., Clark, T. J. & Neidle, E. L. (2003). Appl. Environ. Microbiol. 69, 1598–1606. [DOI] [PMC free article] [PubMed] [Google Scholar]
- Bundy, B. M., Collier, L. S., Hoover, T. R. & Neidle, E. L. (2002). Proc. Natl Acad. Sci. USA, 99, 7693–7698. [DOI] [PMC free article] [PubMed] [Google Scholar]
- Carugo, O. & Argos, P. (1997). Protein Sci. 6, 2261–2263. [DOI] [PMC free article] [PubMed] [Google Scholar]
- Chayen, N. E. (1997). Structure, 5, 1269–1274. [DOI] [PubMed] [Google Scholar]
- Chayen, N. E., Shaw Stewart, P. D. & Blow, D. M. (1992). J. Cryst. Growth, 122, 176–180.
- Choi, H., Kim, S., Mukhopadhyay, P., Cho, S., Woo, J., Storz, G. & Ryu, S. (2001). Cell, 105, 103–113. [DOI] [PubMed] [Google Scholar]
- Clark, T., Haddad, S., Neidle, E. & Momany, C. (2004). Acta Cryst. D60, 105–108. [DOI] [PubMed] [Google Scholar]
- Clark, T. J., Momany, C. & Neidle, E. L. (2002). Microbiology, 148, 1213–1223. [DOI] [PubMed] [Google Scholar]
- Clark, T. J., Phillips, R. S., Bundy, B. M., Momany, C. & Neidle, E. L. (2004). J. Bacteriol. 186, 1200–1204. [DOI] [PMC free article] [PubMed] [Google Scholar]
- Collaborative Computational Project, Number 4 (1994). Acta Cryst. D50, 760–763. [Google Scholar]
- Collier, L. S., Gaines, G. L. III & Neidle, E. L. (1998). J. Bacteriol. 180, 2493–2501. [DOI] [PMC free article] [PubMed] [Google Scholar]
- DeLano, W. L. (2002). The PyMOL Molecular Graphics System. DeLano Scientific, San Carlos, CA, USA. http://www.pymol.org.
- Diaz, E. & Prieto, M. A. (2000). Curr. Opin. Biotechnol. 11, 467–475. [DOI] [PubMed] [Google Scholar]
- Emsley, P. & Cowtan, K. (2004). Acta Cryst. D60, 2126–2132. [DOI] [PubMed] [Google Scholar]
- Ezezika, O. C., Collier-Hyams, L. S., Dale, H. A., Burk, A. C. & Neidle, E. L. (2006). Appl. Environ. Microbiol. 72, 1749–1758. [DOI] [PMC free article] [PubMed] [Google Scholar]
- Ezezika, O. C., Haddad, S., Clark, T. J., Neidle, L. E. & Momany, C. (2007). J. Mol. Biol. 367, 616–629. [DOI] [PubMed] [Google Scholar]
- Guex, N. & Peitsch, M. C. (1997). Electrophoresis, 18, 2714–2723. [DOI] [PubMed] [Google Scholar]
- Henikoff, S., Haughn, G. W., Calvo, J. M. & Wallace, J. C. (1988). Proc. Natl Acad. Sci. USA, 85, 6602–6606. [DOI] [PMC free article] [PubMed] [Google Scholar]
- Hryniewicz, M. M. & Kredich, N. M. (1994). J. Bacteriol. 176, 3673–3682. [DOI] [PMC free article] [PubMed] [Google Scholar]
- Jones, S., Marin, A. & Thornton, J. M. (2000). Protein Eng. 13, 77–82. [DOI] [PubMed] [Google Scholar]
- Jones, S. & Thornton, J. M. (1996). Proc. Natl Acad. Sci. USA, 93, 13–20. [Google Scholar]
- Jones, T. A., Zou, J.-Y., Cowan, S. W. & Kjeldgaard, M. (1991). Acta Cryst. A47, 110–119. [DOI] [PubMed] [Google Scholar]
- Kishan, K. V., Newcomer, M. E., Rhodes, T. H. & Guilliot, S. D. (2001). Protein Sci. 10, 1046–1055. [DOI] [PMC free article] [PubMed] [Google Scholar]
- Laskowski, R. A., Moss, D. S. & Thornton, J. M. (1993). J. Mol. Biol. 231, 1049–1067. [DOI] [PubMed] [Google Scholar]
- Lovell, S. C., Davis, I. W., Arendall, W. B. III, de Bakker, P. I., Word, J. M., Prisant, M. G., Richardson, J. S. & Richardson, D. C. (2003). Proteins, 50, 437–450. [DOI] [PubMed] [Google Scholar]
- Luft, J. R., Collins, R. J., Fehrman, N. A., Lauricella, A. M., Veatch, C. K. & DeTitta, G. T. (2003). J. Struct. Biol. 142, 170–179. [DOI] [PubMed] [Google Scholar]
- Muraoka, S., Okumura, R., Ogawa, N., Nonaka, T., Miyashita, K. & Senda, T. (2003). J. Mol. Biol. 328, 555–566. [DOI] [PubMed] [Google Scholar]
- Muraoka, S., Okumura, R., Uragami, Y., Nonaka, T., Ogawa, N., Miyashita, K. & Senda, T. (2003). Protein Pept. Lett. 10, 325–329. [DOI] [PubMed] [Google Scholar]
- Murshudov, G. N., Vagin, A. A. & Dodson, E. J. (1997). Acta Cryst. D53, 240–255. [DOI] [PubMed] [Google Scholar]
- Otwinowski, Z. & Minor, W. (1997). Methods Enzymol. 276, 307–326. [DOI] [PubMed]
- Painter, J. & Merritt, E. A. (2006). J. Appl. Cryst. 39, 109–111. [Google Scholar]
- Pareja, E., Pareja-Tobes, P., Manrique, M., Pareja-Tobes, E., Bonal, J. & Tobes, R. (2006). BMC Microbiol. 6, 29. [DOI] [PMC free article] [PubMed] [Google Scholar]
- Perrakis, A., Morris, R. & Lamzin, V. S. (1999). Nature Struct. Biol. 6, 458–463. [DOI] [PubMed] [Google Scholar]
- Picossi, S., Belitsky, B. R. & Sonenshein, A. L. (2007). J. Mol. Biol. 365, 1298–1313. [DOI] [PMC free article] [PubMed] [Google Scholar]
- Schell, M. A. (1993). Annu. Rev. Microbiol. 47, 597–626. [DOI] [PubMed] [Google Scholar]
- Schell, M. A., Brown, P. H. & Raju, S. (1990). J. Biol. Chem. 265, 3844–3850. [PubMed] [Google Scholar]
- Smirnova, I. A., Dian, C., Leonard, G. A., McSweeney, S., Birse, D. & Brzezinski, P. (2004). J. Mol. Biol. 340, 405–418. [DOI] [PubMed] [Google Scholar]
- Stec, E., Witkowska-Zimny, M., Hryniewicz, M. M., Neumann, P., Wilkinson, A. J., Brzozowski, A. M., Verma, C. S., Zaim, J., Wysocki, S. & Bujacz, G. D. (2006). J. Mol. Biol. 364, 309–322. [DOI] [PubMed] [Google Scholar]
- Tropel, D. & van der Meer, J. R. (2004). Microbiol. Mol. Biol. Rev. 68, 474–500. [DOI] [PMC free article] [PubMed] [Google Scholar]
- Tyrrell, R., Verschueren, K. H., Dodson, E. J., Murshudov, G. N., Addy, C. & Wilkinson, A. J. (1997). Structure, 5, 1017–1032. [DOI] [PubMed] [Google Scholar]
- Vagin, A. A., Steiner, R. A., Lebedev, A. A., Potterton, L., McNicholas, S., Long, F. & Murshudov, G. N. (2004). Acta Cryst. D60, 2184–2195. [DOI] [PubMed] [Google Scholar]
- Verschueren, K. H. G., Tyrrell, R., Murshudov, G. N., Dodson, E. J. & Wilkinson, A. J. (1999). Acta Cryst. D55, 369–378. [DOI] [PubMed] [Google Scholar]
- Winn, M. D., Isupov, M. N. & Murshudov, G. N. (2001). Acta Cryst. D57, 122–133. [DOI] [PubMed] [Google Scholar]
Associated Data
This section collects any data citations, data availability statements, or supplementary materials included in this article.
Supplementary Materials
PDB reference: effector-binding domain of BenM, P4322, 2f97, r2f97sf
PDB reference: C2221, 2f8d, r2f8dsf