Recombinant SOS3 and SOS2 regulatory domain from A. thaliana have been coexpressed in E. coli, purified and crystallized by the hanging-drop vapour-diffusion method. An X-ray data set has been collected at 2.0 Å resolution.
Keywords: salt-tolerance genes, SOS3, SOS2, Arabidopsis thaliana
Abstract
The salt-tolerance genes SOS3 (salt overly sensitive 3) and SOS2 (salt overly sensitive 2) regulatory domain of Arabidopsis thaliana were cloned into a polycistronic plasmid and the protein complex was expressed in Escherichia coli, allowing purification to homogeneity in three chromatographic steps. Crystals were grown using vapour-diffusion techniques. The crystals belonged to space group P212121, with unit-cell parameters a = 44.14, b = 57.39, c = 141.90 Å.
1. Introduction
The plant SOS2 family of protein kinases (CIPKs) and their interacting activators, the SOS3 family of calcium-binding proteins (CBLs; Guo et al., 2001 ▶; Luan et al., 2002 ▶) and protein phosphatase type 2C (Ohta et al., 2003 ▶), function together in decoding calcium signals elicited by various environmental stimuli (Harmon et al., 2000 ▶; Scrase-Field & Knight, 2003 ▶). CIPKs have evolved to display discrete scaffolding modules that organize these signalling proteins into supramolecular complexes. These arrangements are involved in the regulation of the activity of the components, increase the specificity of the signal and sometimes ensure the colocalization of the substrates and the products at a particular cellular place (Moscat et al., 2006 ▶).
Available data suggest a general mechanism in which CBL–CIPK complexes may regulate the phosphorylation state and the activity of various ion transporters. In this way, the CBL calcium sensor SOS3 can perceive calcium signals elicited by salt stress. SOS3 physically interacts with the CIPK SOS2 (Liu & Zhu, 1998 ▶) and activates it (Halfter et al., 2000 ▶). SOS2 displays its activity at the plasma membrane, where the SOS2–SOS3 complex is required for the phosphorylation and activation of the Na+/H+ antiporter SOS1 (Qiu et al., 2002 ▶; Quintero et al., 2002 ▶). In addition, it has been shown that two other CBLs can interact with and activate another CIPK to phosphorylate the potassium transporter AKT1 so that plants can adapt to potassium-deficient soils (Xu et al., 2006 ▶; Li et al., 2006 ▶). Moreover, the ability of SOS2 to interact with the protein phosphatase ABI2 (Ohta et al., 2003 ▶) suggests that SOS2–ABI2 and/or other CIPK–PP2C complexes could act as molecular on–off switches controlling the phosphorylation state of plant ion transporters.
Although the availability of the structure of SOS3 (Sanchez-Barrena et al., 2005 ▶) has helped to explain some of its features as a calcium sensor, it did not provide insight into one of its principal functions, the activation mechanism of CIPKs. The structure of SOS3 complexed with the regulatory domain of SOS2 (Sanchez-Barrena et al., 2007 ▶) provided the structural basis for the regulation of SOS2 kinase activity and binding to protein phosphatase 2C. This data revealed a molecular mechanism for the kinase activation in which the calcium sensor SOS3 opens a cavity and binds the SOS2 autoinhibitory FISL/NAF motif. The basis for this regulation should be conserved among the Arabidopsis protein network formed by the CBL calcium sensors and CIPK family.
In this work, we present the cloning, expression, purification and crystallization of the complex between SOS3 and the regulatory domain of SOS2.
2. Experimental procedures and results
2.1. Genes cloning, proteins expression and purification
The A. thaliana SOS3 C-terminal truncated mutant (SOS3Δ15) was constructed by cloning into the pETDuet1 plasmid (Novagen). The PCR fragment amplified with the primers 5′-GGAGATATACATATGGGCTGCTCTGTATCGAAGAAG-3′ and 5′-GCGCCTCGAGTTAAACGAAACTTGGAAACGTCC-3′ was cloned into the multiple cloning site 2 (MCS2) betweeen NdeI and XhoI sites. Subsequently, the DNA fragment encoding the A. thaliana SOS2 regulatory domain (amino acids 304–446; SOS2T1; Guo et al., 2001 ▶) was cloned into the pETDuet1 MCS1 (Novagen) between NcoI and EcoRI sites. This plasmid was transformed into Escherichia coli BL21-CodonPlus (DE3) (Stratagene) for protein expression.
20 ml aliquots of overnight cultures were subcultured into 2000 ml fresh 2×TY medium (16 g Bacto Tryptone, 10 g yeast extract, 5 g NaCl per litre of solution) plus ampicillin (50 µg ml−1) and chloramphenicol (34 µg ml−1) and allowed to grow to A 600 = 0.8 at 310 K. Overnight protein expression was then induced with 0.3 mM isopropyl β-d-thiogalactoside at 289 K. Cells were harvested by centrifugation (20 min, 3200g).
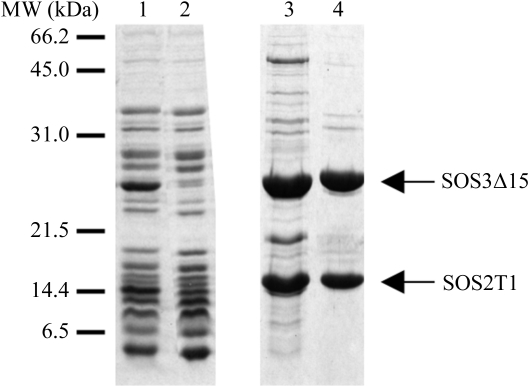
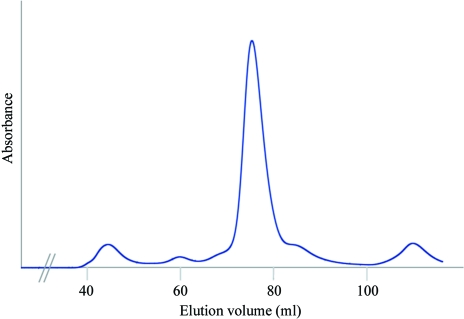
The cell pellet was then resuspended in buffer 1 (20 mM Tris–HCl pH 8.0, 50 mM NaCl, 5 mM dithiothreitol, 5 mM CaCl2, 0.05% NaN3) and cells were disrupted using a French press. After centrifugation (30 min, 47 800g) at 277 K, the clear supernatant was filtered (0.45 µm pore diameter; Millipore) and applied onto an ion-exchange HiTrap Q FF column (5 ml; GE Healthcare) equilibrated with buffer 1. The flowthrough fraction was then applied onto a Resource-S cation-exchange column (Amersham Biosciences Ltd, UK) equilibrated with buffer 1. A salt gradient was applied from 0.05 to 0.5 M NaCl and the SOS2–SOS3 complex was eluted at 125 mM NaCl. The protein sample was concentrated to 1 ml using a Centriprep YM-10 centrifugal filter device (Amicon). A final polishing step was performed using a HiLoad 16/60 Superdex200 gel-filtration column (GE Healthcare) equilibrated with 20 mM Tris–HCl pH 8.0, 125 mM NaCl, 5 mM dithiothreitol, 5 mM CaCl2, 0.05% NaN3. The purification steps were monitored by SDS–PAGE (see Fig. 1 ▶). The fractions corresponding to the major peak eluted from the gel-filtration chromatography were pooled and used for crystallization experiments (see Fig. 2 ▶). SDS–PAGE analysis of these fractions indicated that they correspond to the complex formed by SOS3Δ15 and SOS2T1.
Figure 1.
Expression and purification of the SOS3Δ15–SOS2T1 complex. Lane 1, flowthrough from the anion-exchange column. Lane 2, flowthrough from the cation-exchange column. Lane 3, the fraction eluted with 125 mM NaCl buffer from the cation-exchange column. Lane 4, the main peak from the permeability column. Proteins were analyzed using 15% SDS–PAGE gels. Gels were stained using Coomassie Brilliant Blue.
Figure 2.
Gel-filtration chromatography of SOS3Δ15–SOS2T1. The line shows the absorbance recorded at 280 nm.
The protein complex was concentrated to a final concentration of 10 mg ml−1 with a 10 kDa cutoff protein concentrator (YM-10, Amicon). The final protein concentration was determined spectrophotometrically using a molar absorption coefficient of 20 460 M −1 cm−1 at 280 nm. The sample was aliquoted and immediately frozen at 253 K. The final sample purity was examined by SDS–PAGE (Fig. 1 ▶).
The SOS3 full-length (Ishitani et al., 2000 ▶) and SOS2T1 (Guo et al., 2001 ▶) proteins were first coexpressed and purified following the protocol described above. However, this protocol yielded partially proteolyzed SOS3. The use of protease cocktails did not overcome this problem. Mass-spectrometric analysis showed the existence of two SOS3 species, the full-length SOS3 and a 15-amino-acid C-terminally truncated form (SOS3Δ15). Thus, it was decided to clone and express the truncated SOS3 protein in order to avoid heterogeneity in crystallization experiments.
2.2. Crystallization
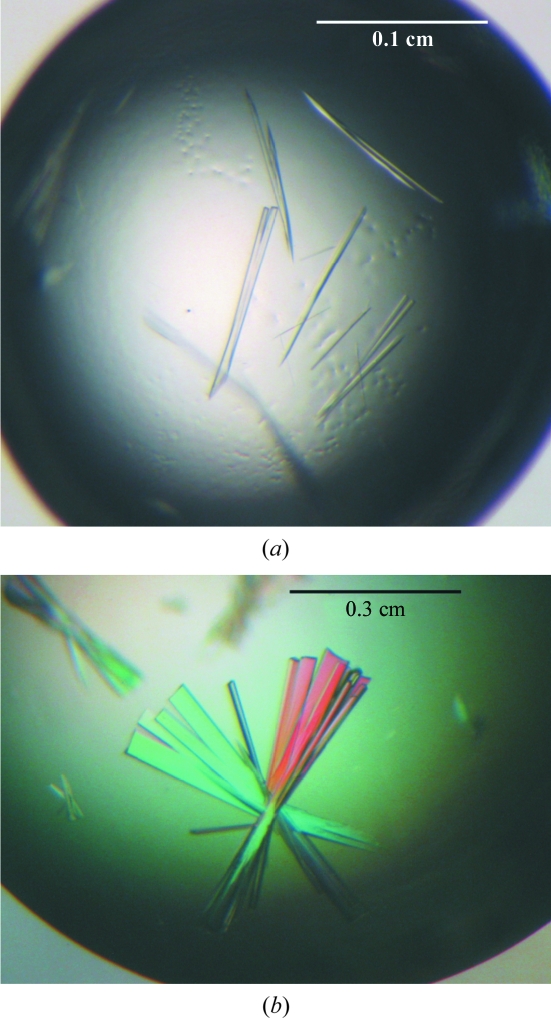
Preliminary crystallization conditions were established using JBScreen Classic Kit 1–10 (Jena Biosciences) with the hanging-drop vapour-diffusion method at 293 K. Drops containing equal volumes (1 µl) of protein (10 mg ml−1) and reservoir solution were equilibrated against 500 µl reservoir solution. Condition No. B5 [20%(w/v) PEG 4000, 0.1 M Tris–HCl pH 8.5, 0.2 M lithium sulfate] from JBScreen Classic Kit 2 (PEG 4000-based; Jena Biosciences) produced needle-like crystals in 5 d (see Fig. 3 ▶ a). Various additives were tested around these conditions (Hampton Reseach). Rod-shaped crystal clusters (see Fig. 3 ▶ b) were grown from drops containing 10.0 mg ml−1 SOS3Δ15–SOS2T1 complex, reservoir solution [20%(w/v) PEG 4000, 0.1 M Tris–HCl pH 7.5, 0.2 M lithium sulfate, 3%(v/v) ethylene glycol] and 1 M guanidine–HCl in a 1:1:0.5 ratio.
Figure 3.
(a) SOS3Δ15–SOS2T1 crystals grown in 20%(w/v) PEG 4000, 0.1 M Tris–HCl pH 8.5, 0.2 M lithium sulfate. (b) Effect of ethylene glycol and guanidine–HCl on the crystals used in the study.
2.3. Data collection and analysis
Crystals were mounted in a fibre loop and cryoprotected by two quick soaks: first in reservoir solution containing 15%(w/v) glycerol and then in reservoir solution containing 25%(w/v) glycerol. Crystals were then flash-frozen at 100 K in a nitrogen steam. Diffraction data were collected on a CCD detector using the ID29 beamline at the ESRF Grenoble synchrotron-radiation source. The crystal-to-detector distance was set to 300 mm, with Δϕ = 1° and 1.3 s exposure per image. The maximum resolution reached was 2.0 Å. Diffraction data were processed and scaled using MOSFLM (Leslie, 1987 ▶) and SCALA from the CCP4 package (Collaborative Computational Project, Number 4, 1994 ▶). A summary of the data-collection statistics taken from Sanchez-Barrena et al. (2007 ▶) is given in Table 1 ▶.
Table 1. Data-collection and processing statistics of orthorhombic crystals of the SOS3Δ15–SOS2T1 salt-tolerance complex.
Values in parentheses are for the highest resolution shell.
| Space group | P212121 |
| Unit-cell parameters (Å) | a = 44.14, b = 57.39, c = 141.90 |
| Resolution limits (Å) | 70.9–2.00 (2.05–2.00) |
| Unique reflections | 23719 |
| Completeness (%) | 99.3 (92.7) |
| Multiplicity | 4.4 (3.5) |
| Rmerge† (%) | 0.06 (0.35) |
| I/σ(I) | 9.7 (2.6) |
| Solvent content‡ (%) | 63.6 |
R
merge = 
 .
.
Solvent-content calculations considering the existence of a SOS3Δ15–SOS2T1 heterodimer in the asymmetric unit.
3. Results and discussion
The DNA fragments corresponding to the C-terminal truncated protein SOS3 and the SOS2 regulatory domain from A. thaliana (Guo et al., 2001 ▶) were cloned into the same plasmid. The complex was coexpressed and purified to homogeneity using a three-step procedure: two ion-exchange chromatography steps followed by gel filtration. The first two steps were aimed to capture the complex from the soluble fraction after cell disruption. To achieve this, we took advantage of the fact that the SOS3Δ15–SOS2T1 complex binds to a cation-exchange column at pH 8 while most of the E. coli proteome flows through the column at this pH. Subsequent gel-filtration chromatography was used as a polishing step and to test the complex formation. SDS–PAGE analysis after this step showed that the complex had been formed and that it was about 95% pure (see Fig. 1 ▶).
Single crystals of the SOS3Δ15–SOS2T1 complex were obtained using hanging-drop vapour-diffusion techniques at 293 K. A high-resolution data set was collected. The statistics for this data set are shown in Table 1 ▶. The space group was orthorhombic P212121, with unit-cell parameters a = 44.14, b = 57.39, c = 141.90 Å.
Molecular-replacement calculations with the program AMoRe (Navaza, 1994 ▶) using the coordinates of the SOS3–Ca2+ complex (PDB code 1v1g; Sanchez-Barrena et al., 2005 ▶) as the search model yielded a correct solution. The resulting electron-density map was good enough as to model the SOS3 moiety of the complex. Starting with this preliminary model, most of the residues of SOS2T1 could be traced automatically using ARP/wARP (Perrakis et al., 1997 ▶; Sanchez-Barrena et al., 2007 ▶).
Acknowledgments
MJS-B was supported by a FPU studentship from Ministerio de Educación, Cultura y Deporte and a Postgraduate I3P Fellowship from the Consejo Superior de Investigaciones Cientificas. AA thanks the ESRF for the access to the synchrotron-radiation source. This work was funded by grant BFU2005-06388-C04-02/BMC from the Spanish ‘Plan Nacional’ (MEC) and ‘Factoría de Cristalización’ Consolider Ingenio 2010 to AA.
References
- Collaborative Computational Project, Number 4 (1994). Acta Cryst. D50, 760–763. [Google Scholar]
- Guo, Y., Halfter, U., Ishitani, M. & & Zhu, J. K. (2001). Plant Cell, 13, 1383–1399. [DOI] [PMC free article] [PubMed] [Google Scholar]
- Halfter, U., Ishitani, M. & Zhu, J. K. (2000). Proc. Natl Acad. Sci. USA, 97, 3735–3740. [DOI] [PMC free article] [PubMed] [Google Scholar]
- Harmon, A. C., Gribskov, M. & Harper, J. F. (2000). Trends Plant Sci.5, 154–159. [DOI] [PubMed] [Google Scholar]
- Ishitani, M., Liu, J., Halfter, U., Kim, C. S., Shi, W. & Zhu, J. K. (2000). Plant Cell, 12, 1667–1678. [DOI] [PMC free article] [PubMed] [Google Scholar]
- Leslie, A. G. W. (1987). Proceedings of the CCP4 Study Weekend. Computational Aspects of Protein Crystal Data Analysis, edited by J. R. Machin & M. Z. Papiz, pp. 39–50. Warrington: Daresbury Laboratory.
- Li, L., Kim, B. G., Cheong, Y. H., Pandey, G. K. & Luan, S. A. (2006). Proc. Natl Acad. Sci. USA, 103, 12625–12630. [DOI] [PMC free article] [PubMed] [Google Scholar]
- Liu, J. & Zhu, J. K. (1998). Science, 280, 1943–1945. [DOI] [PubMed] [Google Scholar]
- Luan, S., Kudla, J., Rodriguez-Concepcion, M., Yalovsky, S. & Gruissem, W. (2002). Plant Cell, 14, S389–S400. [DOI] [PMC free article] [PubMed] [Google Scholar]
- Moscat, J., Diaz-Meco, M. T., Albert, A. & Campuzano, S. (2006). Mol. Cell, 23, 631–640. [DOI] [PubMed] [Google Scholar]
- Navaza, J. (1994). Acta Cryst. A50, 157–163. [Google Scholar]
- Ohta, M., Guo, Y., Halfter, U. & Zhu, J. K. (2003). Proc. Natl Acad. Sci. USA, 100, 11771–11776. [DOI] [PMC free article] [PubMed] [Google Scholar]
- Perrakis, A., Sixma, T. K., Wilson, K. S. & Lamzin, V. S. (1997). Acta Cryst. D53, 448–455. [DOI] [PubMed] [Google Scholar]
- Qiu, Q., Guo, Y., Dietrich, M. A., Schumaker, K. S. & Zhu, J. K. (2002). Proc. Natl Acad. Sci. USA, 99, 8436–8441. [DOI] [PMC free article] [PubMed] [Google Scholar]
- Quintero, F. J., Ohta, M., Shi, H., Zhu, J. K. & Pardo, J. M. (2002). Proc. Natl Acad. Sci. USA, 99, 9061–9066. [DOI] [PMC free article] [PubMed] [Google Scholar]
- Sanchez-Barrena, M. J., Fujii, H., Angulo, I., Martinez-Ripoll, M., Zhu, J. K. & Albert, A. (2007). Mol. Cell, 26, 427–435. [DOI] [PMC free article] [PubMed] [Google Scholar]
- Sanchez-Barrena, M. J., Martinez-Ripoll, M., Zhu, J. K. & Albert, A. (2005). J. Mol. Biol.345, 1253–1264. [DOI] [PubMed] [Google Scholar]
- Scrase-Field, S. A. & Knight, M. R. (2003). Curr. Opin. Plant Biol.6, 500–506. [DOI] [PubMed] [Google Scholar]
- Xu, J., Li, H. D., Chen, L. Q., Wang, Y., Liu, L. L., He, L. & Wu, W. H. (2006). Cell, 125, 1347–1360. [DOI] [PubMed] [Google Scholar]


