Abstract
We report the development of a practical ultrafast allelic profiling assay for the analysis of short tandem repeats (STRs) by using a highly optimized microfluidic electrophoresis device. We have achieved baseline-resolved electrophoretic separations of single-locus STR samples in 30 sec. Analyses of PCR samples containing the four loci CSF1PO, TPOX, THO1, and vWA (abbreviated as CTTv) were performed in less than 2 min. This constitutes a 10- to 100-fold improvement in speed relative to capillary or slab gel systems. The separation device consists of a microfabricated channel 45 μm × 100 μm in cross section and 26 mm in length, filled with a replaceable polyacrylamide matrix operated under denaturing conditions at 50°C. A fluorescently labeled STR ladder was used as an internal standard for allele identification. Samples were prepared by standard procedures and only 4 μl was required for each analysis. The device is capable of repetitive operation and is suitable for automated high-speed and high-throughput applications.
Distributed throughout the human genome are stretches of DNA composed of short tandem repeats (STRs) (1, 2). Typically less than 400 bp long, STRs consist of repetitive units 2–7 bp in length. Alleles defined by STRs are highly polymorphic because of large variation between individuals in the number of repeats. For example, four loci in the human genome, CSF1PO, TPOX, THO1, and vWA (abbreviated CTTv), are characterized by an STR allele that differs in the number of repeats. Two repeating units are found at these loci: AATG for TPOX and THO1, and AGAT for CSF1PO and vWA (3–5). Because STRs are abundant and their locations have been mapped in genomes, STR analysis is becoming an important tool for genetic linkage studies, forensics, and clinical diagnostics (6).
Significant decreases in electrophoretic run-times would greatly increase the speed of STR analysis. Presently, an STR is amplified from the locus of interest by PCR and then electrophoresed through a conventional slab gel to determine the number of repeats present in the locus. Despite the fact that a slab gel format allows for parallel analysis, throughput is still limited by the slow speed of electrophoresis, which is in the range of 2–3 h (7, 8). Capillary gel electrophoresis is currently being explored by a number of groups as a possible alternative to slab gel electrophoresis for DNA analysis (9). Analysis times of 10–30 min have been achieved on such capillaries for the genotyping of single loci such as THO1 (10, 11) and D1S80 (12, 13). To improve throughput, arrays of capillaries have been operated in parallel (14–16). An analysis of the quadruplex STR system CTTv was reported on a 5-column array device with a throughput of 5 samples in 50 min (17). Also, a 48-column array system has been described where 48 samples could be analyzed in parallel in 1 h (18).
In 1992, microchip-based electrophoresis was introduced by Manz and Harrison (19, 20). Several applications to the analysis of biological materials, such as amino acids (21, 22), oligonucleotides (23), restriction fragments (24), sequencing products (25), and immunoassays (26), have been reported. The most striking common feature of such separations is that the analysis times are on the order of seconds. Such ultrafast separations are possible primarily because the microchip format permits the use of unique injection methods which result in extremely short injection plugs.
An important issue is the further improvement in the speed and resolution of these microchip devices without compromise of analysis quality. Little work has yet been reported in which microfabricated devices have been shown to be fully competitive with traditional technologies. One area in which a microchip-based system may be able to decrease analysis times by several orders of magnitude is in DNA typing. We have developed and highly optimized a microfabricated device that utilizes the advantages inherent to the microfabricated format. To demonstrate an important practical application, we have chosen to type STR alleles, using the CTTv quadruplex system, in which four loci are profiled simultaneously. We have found that the new format outperforms the current technologies in almost all practical measures.
MATERIALS AND METHODS
Micromachining.
Miniaturized electrophoresis devices were fabricated by using photolithography and chemical etching methods to produce channel structures in fused silica wafers (26). A 40-nm-thick film of chromium was sputtered onto 150-mm-diameter 0.4-mm-thick fused silica wafers (Hoya, Tokyo). Then 1811 photoresist (Shipley, Marlborough, MA) was spin-coated onto the wafer to a thickness of 1.1 μm and baked at 90°C for 25 min. The resist was patterned by selective exposure to 365-nm UV light (Ultraviolet Products, Upland, CA) through a contact photomask with linewidths of 10 μm (Advanced Reproductions, Wilmington, MA) and developed with Microposit photoresist developer (Shipley). The selectively exposed chrome was removed with K3Fe(CN)6/NaOH chrome etch (Shipley). The resulting mask pattern was etched into the fused silica by immersing the wafer in NH4F/HF (1:1) etchant at 50°C. The depth of etching was controlled by monitoring etching time and measured with a profilometer. Photoresist was removed with acetone, and the remaining chrome was dissolved with K3Fe(CN)6/NaOH. Access to the channel ends was provided by 75-μm-diameter holes drilled through the etched wafer with a CO2 laser system. A second 150-mm-diameter fused silica wafer was contact bonded to the etched wafer to enclose the channels. To achieve bonding, both wafers were immersed in a bath of NH4OH 30% wt/vol/H2O/H2O2 30% wt/vol, 4:5:1 (vol/vol), at 50°C and then rinsed thoroughly with filtered water. They were then placed in direct contact and thermally bonded. Initial reversible bonding took place at 200°C (2 h), followed by final permanent bond formation at 1000°C overnight. This is well below the softening point of the fused silica substrate utilized, and therefore the bonding is due to the formation of covalent bonds between the two surfaces and not diffusion of boundary molecules. Individual microchips were cut from the bonded wafer pair by using a wafer saw. Reservoirs of 50-μl volume were formed by affixing 5-mm-tall 3-mm-i.d. glass Raschig rings (Ace Glass, Vineland, NJ) with optical cement (Norland Optical, New Brunswick, NJ) around each exit hole.
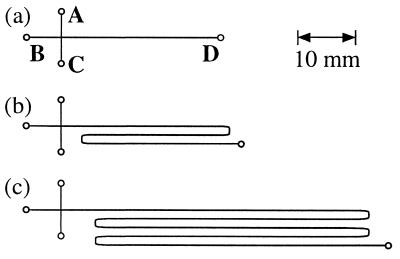
Shown in Fig. 1a is a cross-structure device with a straight separation channel. Channels A, B, and C are 5 mm long, and the separation channel D has a length of 30 mm. The chip was isotropically etched to a depth of 45 μm, producing a channel with a semicircular cross section and a width of 100 μm at the top. The cross-sectional area of the channels is equivalent to that of a cylindrical capillary with an internal diameter of 70 μm. The structures depicted in Fig. 1 b and c were fabricated to study the effect of channel folding, a common technique used to create compact structures in microfabricated devices. Channels A, B, and C are 5 mm long, and the folded separation channels are 100 and 300 mm in length. The etch depth for the folded devices are 60 μm, resulting in 130-μm-wide channels. Two different intersection geometries were fabricated in the folded channel chips. In the first case all four channels meet at a single point, while in the other, channels A and C are offset horizontally by 250 μm.
Figure 1.
Fused silica microchip designs utilized in this study. For details see Materials and Methods.
Coating.
The inner channel surfaces of these microfabricated devices were coated by using a modified Hjerten procedure (27). A filtered solution of 1.0 M NaOH was flushed through the channels for 10 min followed by a 12-h etching period. The channels were subsequently rinsed with filtered deionized water, 0.1 M HCl, deionized water, and MeOH, 10 min each, and then dried in a stream of He 6.0 (Boc Group, Murray Hill, NJ). The channels were then rinsed for 10 min with a filtered solution consisting of 5.0 ml of 95% MeOH/water, 0.5 ml of 10% acetic acid, and 1.0 ml of 3-(trimethoxysilyl)propylmethacrylate (Fluka). After 12 h, the channels were rinsed first with MeOH and then with deionized water, 10 min each. The channels were again dried with He 6.0. In the last step, 70 mg of acrylamide (Pharmacia) dissolved in 1.0 ml of separation buffer (see below) and kept air-tight in a glass vial with septum was purged with He 6.0 at room temperature to remove any traces of oxygen. After 2 h, 8 μl each of 100% N,N,N′,N′-tetramethylethylenediamine (TEMED; Sigma) and 20% (wt/vol) ammonium persulfate (Pharmacia) in water were added by a syringe to the acrylamide solution. After brief mixing, the mixture was pulled up through the septum into a syringe and pressed into the etched channels. After 12 h of polymerization at room temperature, excess polymerized coating solution was purged from the channels with a syringe. The channels were then ready to be filled with the replaceable separation matrix.
Separation Matrix.
The working buffer consisted of 1× TBE (90 mM Tris/64.6 mM boric acid/2.5 mM EDTA, pH 8.3) with 3.5 M urea and 30% (vol/vol) formamide (Pharmacia). A solution of 4% (wt/vol) acrylamide in working buffer kept in a glass vial equipped with a septum was purged with He 6.0. After 2 h, 2 μl each of 10% TEMED and 10% ammonium persulfate (both in water) were added with a syringe through the septum. The mixture was briefly mixed and allowed to polymerize for 12 h. Aliquots of the matrix (stored at 4°C) were transferred into a syringe and pushed into the coated microchip channels. This operation was performed with the aid of a mechanical fixture and could be fully automated in future generations of the apparatus.
Robotic Sample Preparation.
A robotic system was used to prepare the STR samples (28). This consisted of a T265 robotic arm on a linear track (CRS Robotics, Burlington, ON, Canada), a microplate feeding station (Eastern Technical Sales, Manchester, NH), a liquid pipetting station (Rosys, Wilmington, DE), a heat block, and Progene thermal cyclers (Techne, Princeton, NJ). Bloodstain card punches in 96-well Cycleplates (Robbins Scientific, Sunnyvale, CA) were washed with FTA Purification Reagent (Fitzco, Minneapolis, MN), TE (1 mM Tris⋅HCl/0.5 mM EDTA, pH 8.0), and ethanol. A volume of 30 μl of PCR mix [1× STR buffer (Promega), 5′-fluorescein labeled CTTv quadruplex primer pairs (each primer at 5 mM; Promega), BSA (60 mg/ml) and AmpliTaq Gold DNA polymerase (50 mg/ml; Applied Biosystems] was added to each well, followed by 25 μl of liquid wax (MJ Research, Watertown, MA). Thermal cycling was at 95°C for 10 min, 10 cycles of 94°C for 1 min, 60°C for 1 min, and 70°C for 1.5 min, 20 cycles of 90°C for 1 min, 60°C for 1 min, and 70°C for 1 min, and 70°C for 10 min.
Instrumentation.
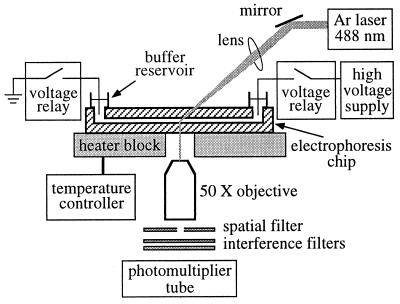
A schematic of the microchip genotyping apparatus is shown in Fig. 2. In brief, a fused silica microchip was mounted on a temperature-controlled stage with high-voltage connections and optical access for laser-induced fluorescence (LIF) detection. The microchip was affixed to an alumina heater block whose temperature was controlled by a temperature controller (Omega Instruments, Stamford, CT) and a series of thermocouples. The alumina block contained a machined aperture to allow for optical access of the detection zone.
Figure 2.
Schematic of microchip genotyping apparatus with laser-induced fluorescence detection optics and temperature-controlled heating block.
High voltage was provided to platinum wire electrodes mounted in the four glass fluid reservoirs by an SL150 power supply (Spellman, Plainview, NY). The voltages applied to each reservoir were controlled by a manual switching circuit and a resistor-based voltage divider network. Laser-induced fluorescence was detected by using an Innova 90 at 3 mW argon ion laser (Coherent, Santa Clara, CA) operating at 488 nm. The beam was focused to a spot size of 15 μm in the channel at a 30° angle of incidence with a 10-cm focal length lens. A 50×, 0.45 numerical aperture long working distance microscope objective (Bausch & Lomb) collected the fluorescence emission. The collected light was spatially filtered by a 4-mm-diameter aperture in the image plane and optically filtered by two 520DF20 bandpass filters (Omega Optical, Brattleboro, VT) and detected by a photomultiplier detection system. The current signal from the photomultiplier tube was converted to voltage across a 100-kΩ resistor, digitized with a PC-controlled 20-bit data acquisition system (Data Translation, Marlborough, MA), and analyzed by using C Grams software (Galactic Industries, Salem, NH).
Microchip Separations.
For fast genotyping, all four channels of the chip described in Fig. 1a were filled with the polyacrylamide separation matrix through a syringe interfaced to the separation channel exit hole. The detector was placed 26 mm from the injector. The freshly filled chip was pre-electrophoresed for 3 min at 200 V/cm across the separation channel at 50°C. To separate the CTTv internal standard ladder, 2 μl of the ladder was diluted with 8 μl of working buffer. For the allelic profiling, 4 μl of PCR-amplified sample was added to 2 μl of CTTv ladder and diluted to a total volume of 10 μl with 2× TBE buffer containing 3.5 M urea and 30% (vol/vol) formamide. The samples were briefly mixed, denatured for 2 min at 95°C, chilled on ice, and pipetted into the microchip sample vial located at the end of channel A. The chip was operated in the pinched cross injection mode, in which three ionic currents are merged at the injection point to confine the sample ions to the volume defined by the channel intersection (29). To load the sample, 400 V/cm was applied across channels A and C. Field strengths of 40 V/cm were applied to channels B and D to prevent the sample from entering these channels. This resulted in a stable injection plug length of 100 μm and an injection volume of approximately 0.36 nl. To inject the representative sample plug into the separation channel, the voltages were switched to create a field strength of 200 V/cm in the separation channel, and approximately 20 V/cm in channels A and C. This generated a well defined plug entering the separation channel D with no excess leakage of sample from the side channels A and C. For experiments at higher field strengths all voltages were equally multiplied. Similar field strengths were used in the 100-mm and 300-mm folded channel microchip devices, resulting in injection plug lengths of 130 μm and 250 μm, respectively, depending on the intersection geometry. Samples were changed by rinsing sample reservoir A three times with separation buffer, loading the new sample, and pre-electrophoresis for several seconds through the cross channel to prevent sample carry-over.
Slab Gel Electrophoresis.
Three microliters of 5′-fluorescein-labeled CTTv ladder (diluted 1:5) was mixed with 3 μl of formamide containing 5′-Rox labeled Genescan-2500 size standard (Applied Biosystems). The sample was maintained at 95°C for 2 min, quickly cooled in ice, and electrophoresed for 2.5 h at 28 W through a denaturing 8% polyacrylamide gel in Applied Biosystems 373 DNA sequencer running genescan software. The sizes of the CTTv ladder and PCR products were automatically determined by genescan analysis software, using the local Southern method. The polyacrylamide gel was pre-run for 20 min before the samples were loaded.
RESULTS
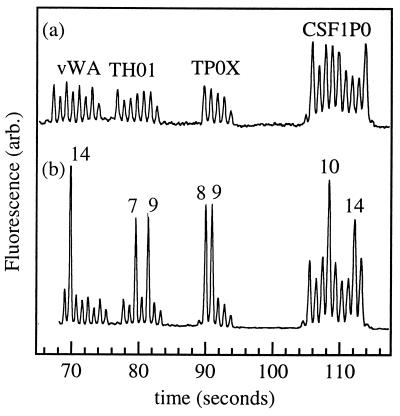
In the initial series of experiments we characterized the general operation of the microfabricated device for genotyping by STR analysis. Our objective was to determine the factors that limit the ultimate speed of such analyses in microchip devices. We followed the device performance for the STR system CTTv, consisting of the four loci CSF1PO, TPOX, THO1, and vWA, each of which contains STR alleles that differ in length by 4 bp. The four loci, CSF1PO, TPOX, THO1, and vWA, contain 9, 5, 7, and 8 common alleles, respectively. Fig. 3a shows the separation of the CTTv ladder ranging from 140 to 330 bases by microchip gel electrophoresis in one of our devices. This ladder was used as an internal sizing standard for the allelic profiling. In Fig. 3a the alleles of all of the four loci are well resolved in less than 2 min with measured resolution R,
 |
1 |
where t is the retention time of the nth peak and hw is the full width at half-maximum of the nth peak. The resolution ranges from 1.7 for the vWA locus to 1.1 for the CSF1PO locus. We chose a minimum resolution of R = 1.0, which is typically required for forensic applications, as a requirement while we optimized for analysis speed. This level of resolution is easily achieved in our microchip in a separation time that is approximately two orders of magnitude faster than conventional slab gel electrophoresis.
Figure 3.
(a) Microchip electropherogram for the four-locus CTTv allelic sizing standard. The chip contained 45-μm-deep channels, a 100-μm sample injector, and a 26-mm-long separation channel. The separation was performed at 50°C with a field strength of 200 V/cm in a sieving matrix that consisted of 4% linear polyacrylamide in 1× TBE buffer with 3.5 M urea and 30% (vol/vol) formamide. (b) Microchip electropherogram presenting the allelic profile of an individual obtained by spiking a PCR-amplified sample with the CTTv sizing standard. Allele numbers are given above the peaks. Electrophoretic conditions were the same as above.
The interdependent parameters varied were operating temperature, channel shape (straight or serpentine), field strength, injection plug length, and channel length. Injection plug length was varied from 100 μm to 250 μm by using simple cross and offset cross injectors. Channel length was varied between 13 mm and 295 mm.
After initial experiments at room temperature, the device was operated at 50°C throughout the optimization process. Heating of the matrix assisted in keeping the samples denatured, and it resulted in a nearly 2-fold decrease in analysis time compared with ambient temperature, which we attribute to a decrease in the viscosity of the sieving gel. There were no observed changes in selectivity or peak width relative to operation at room temperature. Temperatures above 50°C were found to be impractical, primarily due to bubble formation in the channels.
For STR analysis, serpentine channel bends (Fig. 1, devices b and c) were found to significantly degrade device performance. A band-broadening effect was observed, which can be quanititatively explained by a simple geometrical calculation of the path-length differences introduced by the turns, under the assumption that cross-channel migration randomizes molecular paths completely between turns. In contrast, analysis of data from straight channel devices revealed that these separations were essentially injection-plug limited. The absence of other measurable band broadening effects underlines the near ideal performance of our microchip gel system.
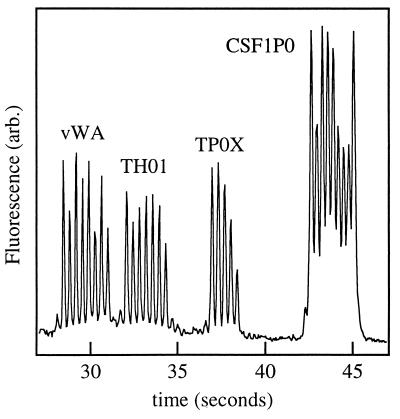
The field strength determines the migration speed within the device and influences the performance of the sieving matrix. Experimentally, the field strength was increased from values typical for capillary gel electrophoresis (approximately 200 V/cm) to values as high as 800 V/cm. At high fields, the resolution suffered due to the onset of new molecular sieving mechanisms such as biased reptation (30). The highest field at which a resolution of R = 1 was maintained depended on the specific locus. As an example, Fig. 4 displays results of a separation at 500 V/cm where the vWA locus is baseline separated in 30 sec. At a field strength of 800 V/cm the device performance became unpredictable and required replacement of the polyacrylamide solution to recover performance. Below 600 V/cm the device and sieving matrix exhibited excellent long-term stability. An increase in migration times of about 10% was found during the course of 10 consecutive runs. However, the original migration times could be restored by replacing the gel/buffer system. In addition, the accuracy of the allele assignment was not affected by small changes in migration time because an internal standard was used for allele identification. No other changes in separation were observed even after 20 consecutive runs without replacement of the gel/buffer system. Occasionally a high fluorescence background was seen which was most likely due to contamination of the injection or detection zones with dust particles. Replacement of the gel/buffer system consistently restored the background signal to normal. A single microchip device was used for allelic profiling for an entire week (about 20–30 separations per day) at 50°C with no noticeable deterioration. The polyacrylamide matrix was routinely replaced every morning after it was found that overnight storage of the chip at 4°C could lead to a decrease in performance. The wall coating showed no degradation during continuous use over the course of 1 week.
Figure 4.
Microchip electropherogram for the four-locus CTTv allelic sizing standard. The chip contained 45-μm-deep channels, a 100-μm sample injector, and a 26-mm-long separation channel. The separation was performed at 50°C with a field strength of 500 V/cm in a sieving matrix that consisted of 4% linear polyacrylamide in 1× TBE buffer with 3.5 M urea and 30% (vol/vol) formamide.
The channel length required for a minimum resolution of R = 1 depended primarily on field strength and injector length. The different injectors were characterized by varying field strength and effective channel length (the latter by moving the position of the detector along the length of the microfabricated channel). Minimum channel length with a given injector and given field is set by the acceptable resolution for the locus of interest.
To evaluate the practicability of the microchip device for genotyping, the PCR-amplified samples of eight individuals were spiked with the CTTv ladder as the internal size standard and assayed on the microchip gel system. In all eight cases the alleles could be identified with no ambiguity in under 2 min, and the results were in complete agreement with data produced by traditional slab gel electrophoresis, which typically required 80, 94, 112, and 143 min to detect and resolve the alleles of vWA, THO1, TPOX, and CSF1PO, respectively. The spiking experiment for one of the individuals is shown in Fig. 3b. The individual is clearly homozygous for vWA (allele 14) and heterozygous for THO1 (alleles 7/9), TPOX (alleles 8/9), and CSF1PO (alleles 10/14).
DISCUSSION
We have demonstrated that the quadruplex STR system CTTv can be analyzed with high accuracy in less than 2 min and a single locus in 30 sec by microchip gel electrophoresis. Compared with capillary or slab gel electrophoresis, our device is faster by a factor of 10 or 100, respectively. In addition, our system can be operated for an extended period of time in a highly reliable manner.
The high speed of analysis can be explained by the unique property of microchips, which allow very short and precisely controlled injection plug widths (100 μm and less). These narrow injections permit short separation distances and consequently shorter analysis times and result in reduced diffusion. The influence of a given injection plug length on total analysis time can be estimated according to Eq. 2
 |
2 |
where the theoretical resolution Rt is calculated under the assumption that injection and diffusion are the sole contributors to peak width (31). In this expression, Δμ is the difference of mobility of two neighboring DNA fragments, E is the electric field strength, t is the fragment migration time, σI2 is the variance due to injection broadening, and 2Dt is the variance of the diffusion contribution with the diffusion coefficient D. Other effects, such as broadening due to detection or thermal gradients across the channel, were not observed in our system. Optimal performance was obtained only when straight separation channels were used, because in folded channels, as discussed previously, the broadening effect of the channel bends dominated.
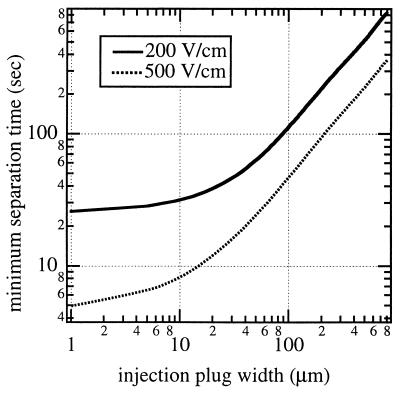
Fig. 5 shows the calculated separation times required to achieve a resolution of Rt = 1 for the last pair of alleles in the CSF1P0 locus as a function of injection width at two different field strengths. Because this locus is always the most difficult to separate it determines the overall CTTv analysis time for the full quadruplex system. These calculations are based on electrophoretic mobilities and diffusion coefficients determined experimentally for the CTTv ladder in our microchip gel system. Two extremes can be distinguished for the separation at 200 V/cm. In the case where the injection plug is larger than 100 μm, the minimal separation time is linearly dependent on plug width and independent of diffusion. Below 10-μm injection width the situation is reversed; the system becomes diffusion limited and almost independent of injection width. Any further decrease in injection plug length will therefore not result in a significant decrease in minimal separation time. The theoretical time in the limit of zero injection width is predicted by Eq. 2 with σI = 0. In this limit, resolution is determined by parameters that are solely gel dependent. A minimal separation time of 26 sec for the CTTv system, corresponding to a separation distance of 6 mm, was calculated for 200 V/cm. This is only a factor of 4 faster than what was obtained in this study, where we have been restricted by available devices to a minimal injection width of 100 μm. The predicted result would require a 10-μm injector, which in our system would not be feasible without an improved detector, or a preconcentration step of the STR samples. However, we consider an injection plug length between 25 μm and 50 μm to be practical for routine STR analysis with our system. The curve for the separations at 500 V/cm shows a similar behavior with even greater improvement predicted for scaled-down injectors. A device utilizing injectors between 25 μm and 50 μm with a separation length of 14 mm at 500 V/cm should result in a total separation time of 15–25 sec for the full CTTv ladder. Despite the observed loss in selectivity at 500 V/cm, adequate resolution is maintained because of the decreased diffusional broadening due to short analysis times with the higher field.
Figure 5.
Predicted minimal separation time required to achieve a resolution of 1.0 for the last two alleles of the CSF1P0 locus as a function of the injection plug width at 200 and 500 V/cm in the presence of a 4% linear polyacrylamide [1× TBE buffer with 3.5 M urea and 30% (vol/vol) formamide] sieving matrix at 50°C.
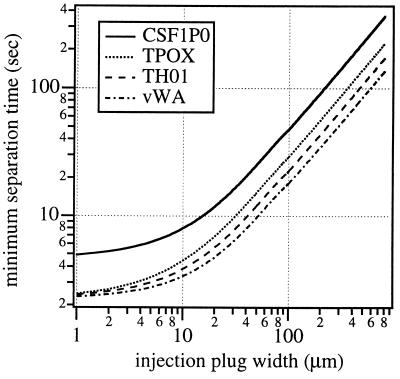
Fig. 6 shows the same analysis at a field strength of 500 V/cm for each of the four loci of the CTTv analysis. As above, the calculations are based on electrophoretic mobilities and diffusion coefficients measured for the CTTv ladder in our microchip gel system. The first three loci show very similar behavior. Extremely high speed analysis should be possible for these lower molecular weight fragments. It should be possible to perform STR analysis of the first three loci in a 25-μm injector in less than 4 sec.
Figure 6.
Predicted minimal separation time required to achieve a resolution of 1.0 for the last two alleles of each locus of the CTTv system as a function of the injection plug width at 500 V/cm in the presence of a 4% linear polyacrylamide [1× TBE buffer with 3.5 M urea and 30% (vol/vol) formamide] sieving matrix at 50°C.
In conclusion, we have demonstrated that genotyping for a single locus can be performed in 30 sec and that the CTTv STR system consisting of four loci can be analyzed reliably in less than 2 min in a microchip system. The device is already highly optimized and can perform repeated analyses without replacement of the sieving matrix. Further optimization is predicted with an improved fabrication geometry which would allow injection plugs between 25 μm and 50 μm in length. The current device uses sample volumes of 4 μl from standard PCR preparations, although the use of even smaller volumes should be possible without loss in performance. Our current microchip system offers an almost two orders of magnitude improvement in speed over current technology with no compromise in quality for standard quadruplex CTTv analyses.
Acknowledgments
We thank Jonathan K. Smith for technical assistance and Lt. Col. Victor W. Weedn for helpful discussions. This work was supported by the National Institutes of Health, the Defense Advanced Research Projects Agency, and the Air Force Office of Scientific Research.
Footnotes
This paper was submitted directly (Track II) to the Proceedings Office.
Abbreviations: STR, short tandem repeat; CTTv, the loci CSF1PO, TPOX, THO1, and vWA.
References
- 1.Edwards A, Civitello A, Hammond H A, Caskey C T. Am J Hum Genet. 1991;49:746–756. [PMC free article] [PubMed] [Google Scholar]
- 2.Beckman J S, Weber J L. Genomics. 1992;12:627–631. doi: 10.1016/0888-7543(92)90285-z. [DOI] [PubMed] [Google Scholar]
- 3.Promega Corp. Promega Technical Manual: Geneprint™ Fluorescent STR Systems. Madison, WI: Promega; 1996. [Google Scholar]
- 4.Huang N E, Schumm J, Budowle B. Forensic Sci Int. 1995;71:131–136. doi: 10.1016/0379-0738(94)01646-m. [DOI] [PubMed] [Google Scholar]
- 5.Lorente J A, Lorente M, Budowle B, Wilson M R, Villanueva E. Forensic Sci Int. 1994;65:169–175. doi: 10.1016/0379-0738(94)90272-0. [DOI] [PubMed] [Google Scholar]
- 6.Fregeau C J, Fourney R M. BioTechniques. 1993;15:100–119. [PubMed] [Google Scholar]
- 7.Budowle B, Chakraborty R, Giusti A M, Eisenberg A J, Allen R C. Am J Hum Genet. 1991;48:137–144. [PMC free article] [PubMed] [Google Scholar]
- 8.Puers C, Hammond H A, Jin L, Caskey C T, Schumm J W. Am J Hum Genet. 1993;53:953–958. [PMC free article] [PubMed] [Google Scholar]
- 9.Heller C. J Chromatogr. 1995;698:19–31. [Google Scholar]
- 10.Butler J M, McCord B R, Jung J M, Allen R O. BioTechniques. 1994;17:1062–1070. [PubMed] [Google Scholar]
- 11.Butler J M, McCord B R, Jung J M, Lee J A, Budowle B, Allen R O. Electrophoresis. 1995;16:974–980. doi: 10.1002/elps.11501601163. [DOI] [PubMed] [Google Scholar]
- 12.McCord B C, Jung J M, Holleran E A. J Liq Chromatogr. 1993;16:1963–1981. [Google Scholar]
- 13.Zhang N, Yeung E S. Anal Chem. 1996;68:2927–2931. doi: 10.1021/ac960346l. [DOI] [PubMed] [Google Scholar]
- 14.Mathies R A, Huang X C. Nature (London) 1992;359:167–169. [Google Scholar]
- 15.Huang X C, Quesada M A, Mathies R A. Anal Chem. 1992;64:2149–2154. doi: 10.1021/ac00042a021. [DOI] [PubMed] [Google Scholar]
- 16.Ueno K, Yeung E S. Anal Chem. 1994;66:1424–1431. [Google Scholar]
- 17.Wang Y, Wallin J M, Ju J, Sensabaugh G F, Mathies R A. Electrophoresis. 1996;17:1485–1490. doi: 10.1002/elps.1150170913. [DOI] [PubMed] [Google Scholar]
- 18.Mansfield E S, Vainer M, Enad S, Barker D L, Harris D, Rappaport E, Fortina P. Genome Res. 1996;6:893–903. doi: 10.1101/gr.6.9.893. [DOI] [PubMed] [Google Scholar]
- 19.Manz A, Harrison D J, Verpoorte E M J, Fettinger J C, Paulus A, Luedi H, Widmer H M. J Chromatogr. 1992;593:253–258. [Google Scholar]
- 20.Harrison D J, Manz A, Fan Z, Luedi H, Widmer H M. Anal Chem. 1992;64:1926–1932. [Google Scholar]
- 21.Fan Z, Harrison D J. Anal Chem. 1994;66:177–184. [Google Scholar]
- 22.Jacobson S C, Koutny L B, Hergenroeder R, Moore A W, Ramsey J M. Anal Chem. 1994;66:3472–3476. [Google Scholar]
- 23.Effenhauser C S, Paulus A, Manz A, Widmer H M. Anal Chem. 1994;66:2949–2953. [Google Scholar]
- 24.Woolley A T, Mathies R A. Proc Natl Acad Sci USA. 1994;91:11348–11352. doi: 10.1073/pnas.91.24.11348. [DOI] [PMC free article] [PubMed] [Google Scholar]
- 25.Woolley A T, Mathies R A. Anal Chem. 1995;67:3676–3680. doi: 10.1021/ac00116a010. [DOI] [PubMed] [Google Scholar]
- 26.Koutny L B, Schmalzing D, Taylor T A, Fuchs M. Anal Chem. 1996;68:18–22. doi: 10.1021/ac9508311. [DOI] [PubMed] [Google Scholar]
- 27.Hjerten S. J Chromatogr. 1985;347:191–198. [Google Scholar]
- 28.Belgrader P, Marino M A. Lab Rob Autom. 1997;9:3–7. [Google Scholar]
- 29.Jacobson S C, Hergenroeder R, Koutny L B, Warmack R J, Ramsey J M. Anal Chem. 1994;66:1107–1113. [Google Scholar]
- 30.Lumpkin O J, DeJardin P, Zimm B H. Biopolymers. 1985;24:1573–1593. doi: 10.1002/bip.360240812. [DOI] [PubMed] [Google Scholar]
- 31.Luckey J A, Smith L M. Anal Chem. 1993;65:2841–2850. doi: 10.1021/ac00068a022. [DOI] [PubMed] [Google Scholar]


