Abstract
At early stages in visual processing cells respond to local stimuli with specific features such as orientation and spatial frequency. Although the receptive fields of these cells have been thought to be local and independent, recent physiological and psychophysical evidence has accumulated, indicating that the cells participate in a rich network of local connections. Thus, these local processing units can integrate information over much larger parts of the visual field; the pattern of their response to a stimulus apparently depends on the context presented. To explore the pattern of lateral interactions in human visual cortex under different context conditions we used a novel chain lateral masking detection paradigm, in which human observers performed a detection task in the presence of different length chains of high-contrast-flanked Gabor signals. The results indicated a nonmonotonic relation of the detection threshold with the number of flankers. Remote flankers had a stronger effect on target detection when the space between them was filled with other flankers, indicating that the detection threshold is caused by dynamics of large neuronal populations in the neocortex, with a major interplay between excitation and inhibition. We considered a model of the primary visual cortex as a network consisting of excitatory and inhibitory cell populations, with both short- and long-range interactions. The model exhibited a behavior similar to the experimental results throughout a range of parameters. Experimental and modeling results indicated that long-range connections play an important role in visual perception, possibly mediating the effects of context.
A large body of psychophysical and physiological evidence has suggested that our visual system encodes the retinal image by means of local mechanisms, each of them sensitive to different ranges of orientation and spatial frequencies (1–5). These mechanisms respond selectively to bandpass-localized stimuli, such as short bars or Gabor patches. Recent psychophysical and physiological studies have suggested that although these mechanisms are assumed to be local and independent, they do interact. The visibility of short bars and Gabor patches was found to either be enhanced or suppressed by laterally placed flanking stimuli of similar orientation and spatial frequency. These psychophysical effects are functions of distance, relative orientation and spatial configuration (context) of target and flanks (6, 7), and global shape (8). Corresponding physiological experiments have suggested that the substrate for these spatial interactions can be found at early levels of visual processing (7, 9, 10). Single cell recording from V1 showed that 42% of complex cells demonstrated a similar facilitation (7). Moreover, visually evoked potentials elicited by a Gabor signal presented in the presence of two flanking high-contrast Gabor signals were significantly facilitated with collinear, co-oriented test/flankers up to at least 3° of separation (9). These interactions have raised the possibility that integration of the decomposed image into more global structures, like contours, can be carried out at early stages of visual processing.
Here we have further investigated the architecture of perceptual spatial interactions involved in visual processes, emphasizing the global effects on local activity. To consider cooperative interactions of many local mechanisms, we devised a novel paradigm, involving a detection of a target in the context of a simultaneous presentation of several high-contrast masks. This paradigm allowed a study of spatial interactions between filters tuned to the same orientation and to different spatial locations. The nonmonotonic behavior of the contrast-detection threshold with the number of masks has indicated the existence of a feedback network of excitatory and inhibitory mechanisms.
METHODS
Experiments
Observers participated in two types of experiments: a lateral masking experiment and a chain lateral masking experiment.
Lateral Masking Experiment.
Contrast-detection thresholds were measured for a foveal Gabor signal (11) (GS: σ = λ = 0.15°), flanked by two high-contrast (30%) similar GSs. Target-to-mask separation varied between 2λ and 12λ during each daily session (6).
Chain Lateral Masking Experiment.
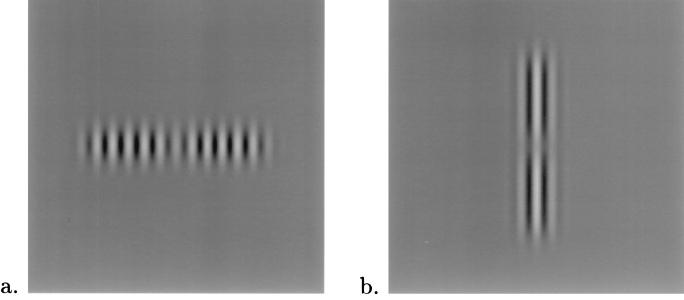
Contrast detection thresholds were measured for foveal GSs flanked on each side by a chain of one to six high-contrast GSs (2–12 GSs in all, 30% contrast). The length of the chain varied between 2 and 12 during each daily session. The target and mask GSs were aligned with 2λ (0.3°) spacing. We carried out experiments for two different chain global configurations: (i) a horizontal configuration of side-by-side vertically oriented GSs (Fig. 1a) and (ii) a collinear, vertical configuration of vertically oriented GSs (Fig. 1b). Stimuli were displayed as gray-level modulation on a Philips color monitor, using an Adage 3000 raster display system. The video display specifications were: 56 Hz noninterlaced with 512 × 512 pixels occupying 9.6° × 9.6° area, 3 × 8 bits image graylevels with 3 × 10 bits DAC digital-to-analog converter output levels. The mean display luminance was 50 cd/m2 in an otherwise dark environment. A two-alternative temporal forced-choice paradigm was used. Each trial consisted of two stimuli presented sequentially, only one of which contained a target. Before each trial, a small fixation cross was presented at the center of the screen. The observers, when ready, pressed a key to activate the trial sequence, which consisted of (i) a no stimulus interval (500 msec), (ii) a stimulus presentation interval (90 msec), (iii) a no stimulus interval (1,000 msec), and (iv) a second stimulus interval (90 msec). The observers’ task was to determine which stimulus interval contained the target. A staircase method (12) was used to determine the contrast threshold. Five observers participated in the experiments; stimuli were viewed from a distance of 125 cm.
Figure 1.
Examples of stimuli used in the chain lateral masking experiments in which target at fixation was embedded within a chain of six high-contrast GSs (three GSs from each side). The left-most and right-most GSs are at 6λ distance from the target. (a) Horizontal configuration. (b) Vertical configuration.
Model
Our proposed model has a structure resembling the cortical architecture and has been studied several times in the past (13). Here we consider interacting recurrent local networks describing individual hyper-columns activated by visual stimuli. Each local network consists of two different local populations. One population consists of Ne excitatory neurons, the other, of Ni inhibitory neurons. In a coarse-grained description, the information about the activity of each of the neurons can be replaced by the average activities of the corresponding populations (the fraction of neurons active within a certain time window around t): Er(t) and Ir(t), where r denotes the spatial location of the corresponding hyper-column in the visual field coordinates (r = 0 at the fovea where the target is located). These activities are governed by the temporally coarse-grained equations (14):
 |
1 |
 |
2 |
In these equations, ge(x) and gi(x) denote the response functions for both populations, i.e., the expected proportion of cells firing for a given level of excitation x. These response functions are monotonic functions going from 0 to 1 and usually are assumed to have a sigmoid shape. In this paper we have chosen them to be in the form
 |
3 |
where α pertains to either e or i, and βα and θα are the slope and threshold parameters; er(t) denotes the average external excitation received by the excitatory population from lateral geniculate nucleus, which reflects the contrast of the visual stimuli, and ir(t) is the same for the inhibitory population. τ (τ′) is the time constant of the excitatory (inhibitory) population, which is probably comparable to the membrane time constant of the neurons, i.e., approximately 10–20 msec (15). Finally, the strength of the interactions in the model is controlled by the parameters Jrr′ee, etc. For example, Jrr′ei is the product of the average number of inhibitory contacts per excitatory cell in the hyper-column r, originating from the hyper-column r′, and the average inhibitory effect of one presynaptic action potential on the postsynaptic cell. The terms with r′ = r describe recurrent interactions within one hyper-column; the remaining terms reflect long-range cortical interactions. Because the experiments we performed only involved stimuli with the same orientation, the model equations do not include an orientational degree of freedom. We have adopted the following assumptions regarding the dependence of the long-range synaptic interactions on the distance between the corresponding networks/stimuli:
 |
4 |
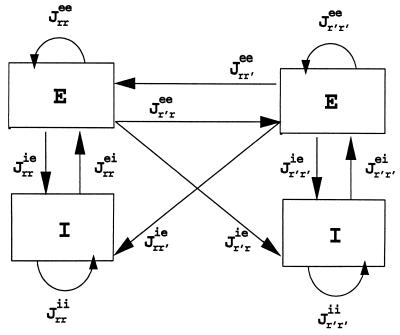
where α, β pertain to either e or i. These equations describe a Gaussian decay of the interactions with the space constant σ. We assume that only excitatory populations can form long-range connections with other networks, although both excitatory and inhibitory neurons can be the targets of such connections (Fig. 2). These assumptions are consistent with physiological and anatomical work demonstrating that horizontal projections in cat and monkey striate cortex originate primarily from excitatory pyramidal cells (16–18) the axons of which synapse onto both excitatory and inhibitory postsynaptic neurons (18).
Figure 2.
Schematic representation of the connectivity between any two nodes in our model network. Each E–I couple (a node) assumes to be tuned to the same spatial location. The strength of the connections is described in the text.
We ran the simulations for several chain lengths; for each chain length N, the stationary level of the target’s E0 activity was computed as a function of the direct input (e0) supplied to it. Detection threshold was defined as the minimum direct input eth producing E0(eth) − E0(0) ≥ 0.1. We leave for future studies an interesting issue of temporal aspects of network response and effects of dynamic synaptic transmission (19, 20).
RESULTS
Experiments
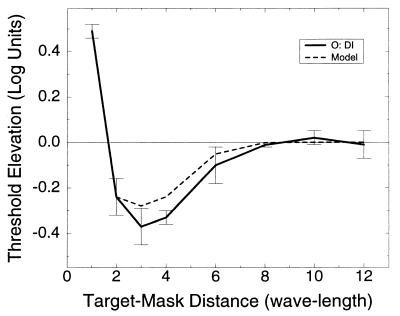
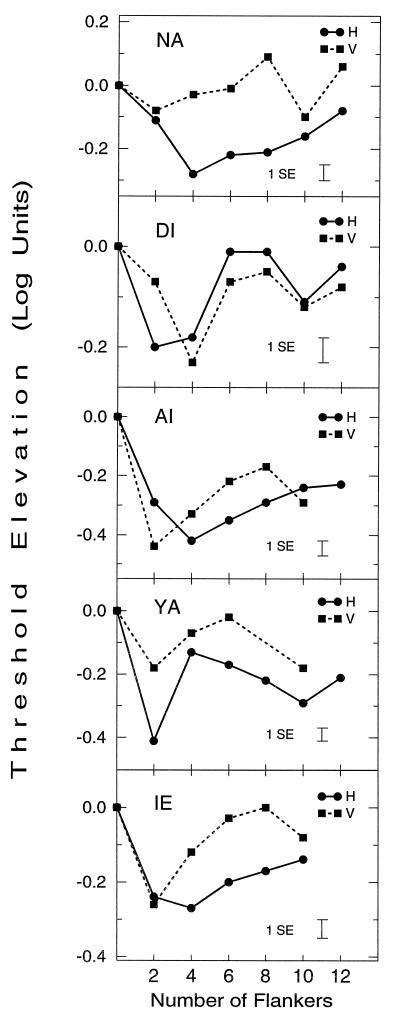
The architecture of perceptual spatial interactions involved in visual processing was studied using a chain lateral masking paradigm. Five observers were asked to detect a vertical Gabor target flanked on each side by a chain of one to six high-contrast vertical Gabor signals (2–12 GSs total), with the chain length varying during each daily session. Two chain configurations were used: a parallel, horizontally oriented configuration (H) (Fig. 1a) and a collinear, vertically oriented configuration (V) (Fig. 1b). All observers had at least a few practice sessions in lateral masking experiments (one flanker on each target side) before starting the chain lateral masking experiments. In the lateral masking experiment, detection thresholds of the target were measured as a function of target-to-mask distances. All observers had the same pattern of results as previously reported (6) and are shown in Fig. 3: Thresholds increased (suppression) with target-to-mask distance smaller than 2λ but decreased (enhancement) with flankers positioned at a larger target-to-mask distance. Enhancement was maximal at 3λ separation and decreased as target-to-mask distance increased, with long distance flankers (⩾8λ) having no effect on target visibility. We then proceeded to the chain lateral masking experiment in which detection thresholds of the target were measured as a function of the length and configuration of the GSs chain. Figure 4 shows the results obtained for five observers for both chain configurations; the graphs show a nontrivial relation of the detection threshold with the number of flankers: Short chains (1–3 maskers on each side, plotted at abscissa values of 2–6) caused enhancement, but as chain lengths increased, enhancement decreased for all observers, with thresholds occasionally returning to base line level. We call this effect, the chain depression effect. Interestingly, as we further increased the length of the chain, enhancement often increased again (for all observers with the vertical configuration and for DI and YA with the horizontal configuration). Note that for target-to-flankers distances larger than 2λ, single maskers caused no inhibition of the target detection threshold (as in Fig. 3 and ref. 6). This result is independent of the mask’s contrast (12). Thus, if the influence of the maskers on target visibility was the sum of the individual influences [as predicted by standard masking models (12, 21, 22) and as can be estimated from the lateral masking experimental data], then by adding the relatively far away flankers at 8λ, 10λ, and 12λ distances enhancement would not be expected to decrease.
Figure 3.
Dependence of target threshold on the distance between target and flankers. Here only two flankers were used (one on each side) as in ref. 6. The continuous line depicts the psychophysical data of observer DI, and the broken line shows our model predictions for distances between 2λ and 12λ. Model parameters are set as in Fig. 6, error bars represent ±SE of the mean, each datum point is the average of four measurements. Thresholds are relative to contrast detection threshold of an isolated target. Note that remote flankers (distance > 6λ) had no effect on target visibility.
Figure 4.
Dependence of target threshold on the number of flankers and configuration (H and V) for observers NA, DI, AI, YA, and IE. Threshold elevation was computed relative to that of an isolated target. Each datum point is the average of four measurements after practice. The number of flankers reflects the total number of maskers in the chain. All observers show a similar nonmonotonic dependence of detection threshold on the number of flankers for both configurations. (t tests on the difference between first minima and the following maxima show a significant decrease in sensitivity, with P < 0.03 in all cases and P < 0.01 in five cases. Observers DI and YA show a second significant minima.)
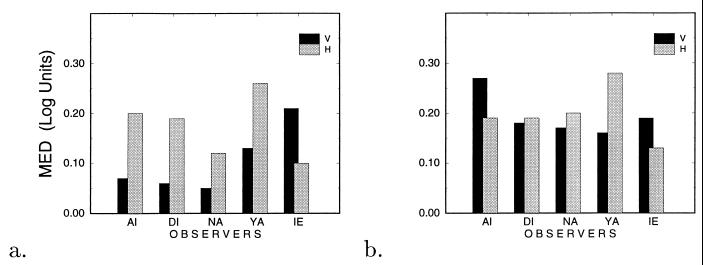
Practice had an interesting influence on the observers’ performance. At the first stage of practice, observers showed a different pattern of results under the parallel (H) and the collinear (V) conditions. At the early stage of practice, the chain depression effect was more pronounced under the parallel configuration condition, but practice had the effect of increasing depression on the collinear configuration condition, thus making the difference between the two conditions insignificant. We called the first four sessions “early phase” of practice and the next four sessions “late phase” of practice. After the early phase of practice, all the observers further practiced the collinear configuration and four observers practiced the parallel configuration. The observers differed in their psychophysical experience, practice level, and order of experiments. The observers’ performances were different in the optimal chain length, which results in the maximal enhancement, in the maximal enhancement value, and in the rate of enhancement decrease. To evaluate the chain depression effect we defined the maximum enhancement decrease (MED) in the following way: MED = E(n1) − E(n2); where n1 is the optimal chain length, producing the maximum enhancement Emax = E(n1), and n2 is the worse chain length, producing the minimum enhancement Emin = E(n2), under the condition n2 > n1.
Fig. 5 describes the MED values for all observers for both configurations as a function of practice level. Averaging all five observers we found that at the early phase of practice, MED values for the parallel (H) configuration were about twice as large as MED values obtained for the collinear (V) configuration, [MED(H) = 0.17 ± 0.02, MED(V) = 0.10 ± 0.03 log units, ±SE]. After some practice, however, we got similar MED values for both configurations [MED(H) = 0.20 ± 0.02, MED(V) = 0.19 ± 0.02 log units, ±SE], indicating a similar nonmonotonic dependency between target visibility and the length of the chain. Another interesting result is that, although by using the lateral masking paradigm it was found that enhancement was more pronounced when target and masks were laid in an axis parallel to their orientation (23), here we found that practicing the chain lateral masking paradigm led to a similar, and sometimes (see Fig. 4) even larger, average maximum enhancement obtained under the parallel (H) than the collinear (V) configurations.
Figure 5.
The chain depression effect as reflected by the MED values for configurations H (grey) and V (black). MED is a measure of decrease in enhancement as a result of increasing chain length. (a) Results obtained at the early stage of practice. (b) Results obtained at a later phase of practice (for observer DI who had no further practice with the H configuration, we took the results from the first stage of practice).
Model
The model we have proposed suggests that the dependency of target visibility on the context, shown in our psychophysical data, can result from a network of excitatory (E) and inhibitory (I) local mechanisms. Each local processing unit participates in a feedback network of lateral connections and thus can integrate information over large portions of the visual field. Since in our simulations, for each pair of neighboring masks, the Jie connections are stronger than the Jee (for H configuration, and for V configuration at the latest stages of practice), effectively each mask is inhibiting its neighbors. This results in a wave of activity spreading through the chain, with the ending masks always having the highest activities because they receive the lowest inhibition. Correspondingly, as the length of the chain increases, the target hits different phases of the wave, leading to nonmonotonic dependence of the detection threshold on the length of the chain.
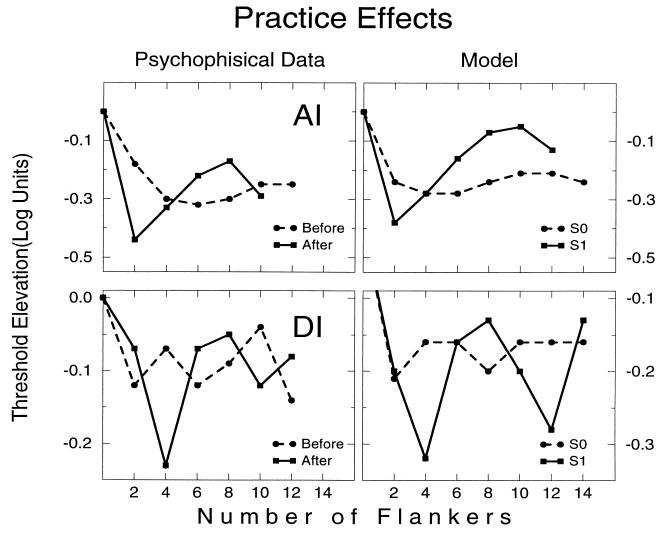
Analysis of the model showed that the effect of practice may result from two learning processes: (i) A decrease in the strength of inhibitory connections from flankers into the target. This process probably occurs during the lateral masking and the chain lateral masking practice, as implied from psychophysical data showing development of detection enhancement with practice at a target-to-mask distance of 2λ (for our two unpracticed observers, changes in log-units from the first four sessions to the last four sessions, at distance of 2λ: NA from 0.17 to −0.16 log units with parallel configuration, DI from −0.01 to −0.24 log units with collinear configuration. The other observers had previous experience with lateral masking experiments and here they showed a significant enhancement at 2λ distance during the first few sessions). (ii) An increase in the relative strength of inhibitory interactions between flankers; whereas at early phase of practice we assumed that the Jee were approximately equal the Jie connections, at the late phase of practice we assumed that the Jrr′ie interactions, when r ≠ r′ and r ≠ 0, are stronger than the Jrr′ee interactions. The increase in the Jie interactions is achieved by increasing both the range and the amplitude in the Jαβ expression (see Eq. 4). Because the Jie interactions are the connections that increase the input to the inhibitory subpopulations, their increase leads to larger inhibitory effects.
Fig. 6 compares model simulation results and psychophysical data for the chain lateral masking experiment. The correspondence between the psychophysical results and the model is quite clear. The chain depression effect shown with the parallel (H) configuration and developed with practice with the collinear (V) configuration may reflect about 1.4-fold increase in the range of the Jie connection, and no increase in the range of the Jee connections, together with a 2-fold increase in the strength of the Jie connections (not including connections into the target) and a 1.5-fold increase in the strength of the Jee connections.
Figure 6.
Psychophysical data versus model simulation for observers AI (Top) and DI (Bottom). Left column shows the dependence of target threshold on the number of flankers at early (before) and late (after) practice phases for observers AI and DI. These results were obtained with the V configuration. Threshold elevation was computed relative to the average threshold of an isolated target. Note the chain depression effect that was developed with practice. The right column gives two examples of model simulations. In the model, we transferred from S0 simulation into S1 simulation by enlarging the inhibitory influences (Jie) more than the excitatory influences (Jee). We changed the relative strength of the connections described in Eq. 4 using two parameters, the J0αβ parameter and the range parameter σαβ. Enlarging the J0αβ parameter enlarges the strength of all the Jrr′αβ connections, whereas enlarging the σαβ enlarges especially the far away connections. For observer AI, the S0 (S1) parameters in Eq. 4 were: J0ee = 16.8 (33.6); J0(rr′)ie = 21.9 (58.8) for r ≠ 0; J0( 0r′)ie = 9.12 (10.29); σee = 5λ (5λ); σie = 5.75λ (8λ). For observer DI, the S0 (S1) parameters were: J0ee = 33.6 (35.7); J0(rr)ie = 73.8 (80.85) for r ≠ 0; J0(0r′)ie = 29.4 (2.2); σee = 3.5λ (3.5λ); σie = 3.5λ (5λ). Parameters of the response functions were: βe = 0.4; βi = 0.5; θe = 12; θi = 1.5.
DISCUSSION
A chain lateral masking paradigm was used to study the architecture of lateral interactions between filters tuned to the same orientations and to different spatial locations. Using chains of high-contrast masks enabled us to explore interactions of the maskers among themselves, as well as the interactions between maskers and target. Experiments were carried out for two different global configurations enabling comparison between parallel and collinear relations. We found that for increasing chain length, threshold usually first decreases, then reaches a minimum (maximum enhancement), then increases (reaches a minimal enhancement), and then decreases again. The difference in the magnitude between the minimum threshold and the next maximum threshold (MED) is about 0.2 log units (40%), for both configurations. This nonmonotonic relation between the detection threshold and the number of maskers (chain depression effect) suggests that the detection threshold is a result of population dynamics of large neuronal populations in the neocortex, with an important role assigned to the interplay between excitation and inhibition (14, 24, 25).
We have considered a model of the primary visual cortex as a network consisting of excitatory and inhibitory populations, with both short- and long-range interactions (16–18, 25–29). The model exhibited a behavior similar to the experimental results. We suggest that in the basic state the long-range connectivity in the collinear direction assumes balanced excitation and inhibition, whereas in the parallel direction (side-by-side elements), inhibition dominates. This suggestion is assumed in our model and agrees with our observations from the early stage of practice (Fig. 6). It agrees also with observations reported by others that whereas the visibility of a Gabor target (or a short line) is significantly enhanced in the presence of collinear masks, the enhancement is weaker when target and masks are parallel (23).
According to our model, the roughly constant performance shown in the early phase of practice under the collinear (V) configuration, can be explained by assuming balanced excitatory and inhibitory interactions, (Jee≈< Jie, σee ≈ σie). The chain depression effect shown under the parallel (H) configuration and developed with practice under the collinear configuration reflects about a 1.4-fold increase in the range of the Jie connection, and no increase in the range of the Jee connections, together with a 2-fold increase in the strength of the Jie connections (not including connections into the target), and a somewhat smaller (1.5-fold) increase in the strength of the Jee connections. Our model suggests that the chain depression effect reflects excess inhibition between nodes responding to flankers (longer range and stronger E–I connections), whereas a monotonically increasing enhancement reflects longer and stronger E–E connections. An increase in the spatial range of excitatory lateral interactions was suggested in the past. Using the lateral masking paradigm, Polat and Sagi (30) found that for unpracticed observers, target threshold was facilitated by mask presence at distances up to six times the target period. Practice on a threshold detection task had the effect of increasing the facilitation range by a factor of three. Here we suggest an increase in the efficacy of both excitatory and inhibitory connections. The more dramatic increase in the strength of the connections to the inhibitory filters may result from an activity-dependent (Hebb-like) learning rule; an increase of connections efficacy, with correlated activity of two interconnected filters, the size of the increase being proportional to the level of activity in the interconnected filters. According to our simulation model, the activity in the inhibitory nodes, at the flankers locations, is much greater than that in the excitatory nodes, except for at the side nodes. Such a behavior is expected from a network exhibiting lateral inhibition, such as postulated for “pop-out” phenomena (24, 31, 32). In summary, our psychophysical findings suggest the existence of a feedback excitatory–inhibitory network in the visual cortex. Results from the chain lateral masking paradigm can be used to explore the architecture of perceptual spatial interactions and indicate that excitatory connections are stronger in the collinear direction, whereas inhibitory connections are stronger in axis orthogonal to the axis of the stimuli. Our model suggests that exposure to multiple high-contrast maskers develops the strength and range of the inhibitory connections more than the excitatory connections.
Acknowledgments
We thank Uri Polat, Yasuto Tanaka, and Marius Usher for helpful comments on an early version of the manuscript. This research was supported by the Basic Research Foundation administered by the Israel Academy of Sciences and Humanities, the Charles H. Revson Foundation (D.S.), and the Minerva Foundation (M.T.).
ABBREVIATIONS
- GS
Gabor signal
- MED
maximum enhancement decrease
References
- 1.Mountcastle V B. J Neurophysiol. 1957;20:408–434. doi: 10.1152/jn.1957.20.4.408. [DOI] [PubMed] [Google Scholar]
- 2.Hubel D H, Weisel T N. J Physiol (London) 1963;165:559–568. doi: 10.1113/jphysiol.1963.sp007079. [DOI] [PMC free article] [PubMed] [Google Scholar]
- 3.Campbell F, Robson J. J Physiol (London) 1968;197:551–566. doi: 10.1113/jphysiol.1968.sp008574. [DOI] [PMC free article] [PubMed] [Google Scholar]
- 4.Blakemore C, Campbell F. J Physiol (London) 1969;203:237–260. doi: 10.1113/jphysiol.1969.sp008862. [DOI] [PMC free article] [PubMed] [Google Scholar]
- 5.DeValois R L, DeValois K K. Spatial Vision. New York: Oxford Univ. Press; 1990. [Google Scholar]
- 6.Polat U, Sagi D. Vision Res. 1993;33:993–999. doi: 10.1016/0042-6989(93)90081-7. [DOI] [PubMed] [Google Scholar]
- 7.Kapadia M K, Ito M, Gilbert D C, Westheimer G. Neuron. 1995;15:843–856. doi: 10.1016/0896-6273(95)90175-2. [DOI] [PubMed] [Google Scholar]
- 8.Kovács I, Julesz B. Nature (London) 1994;370:644–646. doi: 10.1038/370644a0. [DOI] [PubMed] [Google Scholar]
- 9.Polat U, Norcia A M. Vision Res. 1996;36:2099–2109. doi: 10.1016/0042-6989(95)00281-2. [DOI] [PubMed] [Google Scholar]
- 10.Mizobe K, Kasamatsu T, Polat U, Norcia A. Soc Neurosci Abstr. 1996;254:18. [Google Scholar]
- 11.Gabor D. J Inst Electr Eng (London) 1946;93:429–445. [Google Scholar]
- 12.Zenger B, Sagi D. Vision Res. 1996;36:2497–2513. doi: 10.1016/0042-6989(95)00303-7. [DOI] [PubMed] [Google Scholar]
- 13.Wilson H R, Cowan J D. Biophys J. 1972;12:1–24. doi: 10.1016/S0006-3495(72)86068-5. [DOI] [PMC free article] [PubMed] [Google Scholar]
- 14.Wilson H R, Cowan J D. Kybernetic. 1973;13:55–80. doi: 10.1007/BF00288786. [DOI] [PubMed] [Google Scholar]
- 15.Abeles M. Corticonics. New York: Cambridge Univ. Press; 1991. [Google Scholar]
- 16.Gilbert C D, Wiesel T N. Nature (London) 1979;280:120–125. doi: 10.1038/280120a0. [DOI] [PubMed] [Google Scholar]
- 17.Martin K A C, Whitteridge D. J Physiol (London) 1984;353:463–504. doi: 10.1113/jphysiol.1984.sp015347. [DOI] [PMC free article] [PubMed] [Google Scholar]
- 18.McGuire B A, Gilbert C, Rivlin P K, Wiesel T N. J Comp Neurol. 1991;305:370–392. doi: 10.1002/cne.903050303. [DOI] [PubMed] [Google Scholar]
- 19.Abbott L F, Varela J A, Sen K, Nelson S B. Science. 1997;275:220–224. doi: 10.1126/science.275.5297.221. [DOI] [PubMed] [Google Scholar]
- 20.Tsodyks M, Markram H. Proc Natl Acad Sci USA. 1997;94:719–723. doi: 10.1073/pnas.94.2.719. [DOI] [PMC free article] [PubMed] [Google Scholar]
- 21.Foley J M. J Opt Soc Am A. 1994;11:1710–1719. doi: 10.1364/josaa.11.001710. [DOI] [PubMed] [Google Scholar]
- 22.Heeger D J. Vis Neurosci. 1992;9:181–197. doi: 10.1017/s0952523800009640. [DOI] [PubMed] [Google Scholar]
- 23.Polat U, Sagi D. Vision Res. 1994;34:73–78. doi: 10.1016/0042-6989(94)90258-5. [DOI] [PubMed] [Google Scholar]
- 24.Stemmler M, Usher M, Niebur E. Science. 1995;269:1877–1880. doi: 10.1126/science.7569930. [DOI] [PubMed] [Google Scholar]
- 25.Weilky M, Kandler K, Fitzpatrick D, Katz L C. Neuron. 1995;15:541–552. doi: 10.1016/0896-6273(95)90143-4. [DOI] [PubMed] [Google Scholar]
- 26.Gilbert C D, Wiesel T N. J Neurosci. 1989;9:2432–2442. doi: 10.1523/JNEUROSCI.09-07-02432.1989. [DOI] [PMC free article] [PubMed] [Google Scholar]
- 27.Malach R, Amir Y, Harel M, Grinvald A. Proc Natl Acad Sci USA. 1993;90:10469–10473. doi: 10.1073/pnas.90.22.10469. [DOI] [PMC free article] [PubMed] [Google Scholar]
- 28.Hirsch J A, Gilbert C D. J Neurosci. 1991;11:1800–1809. doi: 10.1523/JNEUROSCI.11-06-01800.1991. [DOI] [PMC free article] [PubMed] [Google Scholar]
- 29.Fitzpatrick D. Cereb Cortex. 1996;6:329–341. doi: 10.1093/cercor/6.3.329. [DOI] [PubMed] [Google Scholar]
- 30.Polat U, Sagi D. Proc Natl Acad Sci USA. 1994;91:1206–1209. doi: 10.1073/pnas.91.4.1206. [DOI] [PMC free article] [PubMed] [Google Scholar]
- 31.Sagi D, Julesz B. Spatial Vis. 1987;2:39–49. doi: 10.1163/156856887x00042. [DOI] [PubMed] [Google Scholar]
- 32.Sagi D. Vision Res. 1990;30:1377–1388. doi: 10.1016/0042-6989(90)90011-9. [DOI] [PubMed] [Google Scholar]


