

Abstract
This study aimed to clarify the direction and timing of the change of non-active lower limb vascular conductance at the onset of contralateral limb isometric exercise and to examine the mechanisms controlling this change. Fifteen human subjects performed 2 min of electrically evoked (Stim) or voluntary (Vol) ischaemic isometric calf plantar flexor exercise at 30 % maximum voluntary contraction (MVC). Blood pressure (BP) and heart rate were continuously recorded and blood flow in the non-active contralateral lower limb was recorded at 15 s intervals. In subsets of subjects the presence of inadvertent muscle contraction was monitored by calf muscle EMG and the effects of the sensation of electrical stimulation without muscle contraction (sham) were investigated. After 10-15 s conductance had increased significantly (P < 0.05) in Vol and Stim by a mean of 15 and 12 %, respectively, whilst BP was unchanged. Following this initial increase conductance decreased progressively during Stim and Vol whilst blood pressure rose. No EMG activity was seen during either protocol. In the sham stimulation experiments where no contraction was evoked the conductance change at the onset of stimulation replicated that seen during Stim exercise. Increases in conductance were independent of central command and muscle force generation, were not activated in anticipation of exercise but could be activated secondarily to peripheral sensations associated with expected exercise. The explanation for our results might involve sympathetic withdrawal related to mental stress; however, a central pathway, which directly activates a vasodilator mechanism in passive calf muscle, remains a possibility.
There is still controversy in the literature over the time course and direction of change of non-active limb vascular conductance at the onset of contralateral limb isometric exercise, and indeed the mechanisms underpinning such a change in humans (Joyner & Halliwill, 2000).
In previous studies of non-active limb vascular behaviour it was usual for blood flow and mean arterial pressure (MAP) measurements to be made or averaged over periods of 30-60 s. As a result it is highly likely that initial changes may have been missed. This may have led to the contradictory reports of apparent vasodilatation (Eklund et al. 1974; Saunders et al. 1989) or vasoconstriction (Lind et al. 1964; Cotzias & Marshall, 1993) occurring at exercise onset in the non-active limb. Therefore, the primary objective of our study was simply to clarify the time course and direction of vascular conductance change in the inactive lower limb at rest and at the onset of exercise of the contralateral limb. Secondarily through a series of additional experiments we set out to investigate the mechanisms which may explain the changes. Since muscle chemoreflex activation and consequent sympathetically mediated vasoconstriction is dependent upon muscle metabolite accumulation (Victor et al. 1988), exercise was continued to reveal its progressive influence on inactive limb conductance. A subsequent period of post-exercise circulatory occlusion to the active limb enabled this influence to be clearly identified.
To examine whether conductance changes at the onset of exercise were dependent upon volitional contraction of the active muscle, i.e. in the presence of central command, we compared responses to both electrically evoked and voluntary contractions. The possible role of central arousal during electrical stimulation was clarified in an experiment, which used ‘sham’ stimulation of the active muscle. This involved low level electrical stimulation, which was subthreshold for calf muscle mechanical activity. Finally, central translocation of blood from the large vascular bed of the active leg at exercise onset is possible in an upright human. This may cause a reflex withdrawal of sympathetic tone to the muscle vasculature thus increasing conductance. To control for this possibility a comparison was made between inactive limb conductance changes when circulation to the active limb was open and when it was closed using thigh cuff inflation.
Preliminary results from this study have been reported previously (Fisher & White, 2001).
Methods
Subjects
Fifteen subjects (12 male) participated in this study. All were normotensive (< 140/90 mmHg), healthy and physically active students from the University of Birmingham with a mean age of 23.8 ± 1 years (s.e.m.), weight 75 ± 2.3 kg and height 176 ± 2 cm. All protocols were approved by the local Ethical Committee and in accordance with the Declaration of Helsinki. Prior to experimentation subjects gave informed, written consent.
Experimental procedures
The apparatus and methods used to measure plantar flexor forces in this study were similar to those used previously by Carrington & White (2001). The subject was seated in the dynamometer with the thigh of the preferred leg clamped horizontally with the ankle positioned at 1.48 rad (85 deg). The upward force generated by the triceps surae was transduced and amplified before being transmitted to an analog to digital converter (Cambridge Electronic Design 1401plus, CED, Cambridge, UK). Force output was displayed on a chart recorder and recorded on Spike 2 computer software (Cambridge Electronic Design) for off-line analysis.
Whilst seated in the dynamometer the subject's maximum voluntary contractions (MVC) was assessed as being the best of three attempts and 30 % of the maximum was displayed on the chart recorder. For voluntary contractions subjects maintained the required force by matching the deflection produced on the chart recorder to the pre-determined 30 % MVC line. Evoked contractions were produced using tetanic stimulation at 20 Hz, and a pulse width of 50 μs (Digitimer DS7, Digitimer Ltd, Hertfordshire, UK). A force output of 30 % MVC was maintained by adjustment of the stimulus current.
Blood pressure (BP) was monitored continuously and non-invasively from the third finger of the hand, supported at the level of the heart, using a Finapres monitor (Ohmeda 2300, Louisville, CO, USA). Heart rate (HR) was calculated from a three lead electrocardiogram (Cardiorater CR7, Cardiac Records Ltd, London, UK). Blood flow in the non-contracting, passive contralateral calf was measured using mercury strain gauge plethysmography (Whitney, 1953; Hokanson, Bellevue, WA, USA). The strain gauge was positioned around the widest portion of the calf, and the leg supported in a dependent position at the foot and the knee to eliminate postural muscle tension. The first three blood flow measurements were used as a priming stimulus (Patterson & Whelan, 1954) and were omitted from the calculation of resting averages. The foot was not occluded during blood flow measurements (Siggaard-Anderson, 1970). Blood flow measurements were made every 15 s throughout the main protocol, with the first of the exercise period being made after 10 s. Signal outputs were transmitted to an analog to digital converter (Cambridge Electronic Design, 1401plus) and sampled at frequencies of 1000 Hz for ECG and 250 Hz for blood pressure, blood flow and force. Waveform data were stored and analysed on a personal computer (Vale Platinum TX, Pentium II) using Spike 2 software (Cambridge Electronic Design). Vascular conductance was calculated as blood flow/MAP and expressed in ml (100 ml)−1 min−1 mmHg−1. As the subject was seated, venous occlusion pressure during plethysmography was calculated; 50 mmHg plus the sum of the distance from the centre of the thigh to the heart, multiplied by 0.779, thus accounting for the effect of the gravitational constant and the specific gravity of blood (1.055; Gamble et al. 1997).
Main protocol
Diagram 1 outlines the main experimental protocol. During preliminary visits to the laboratory, subjects were familiarised with the experimental procedures. Prior to experimental sessions subjects were asked to refrain from food and caffeine for 3 h. Each session consisted of both electrically induced and voluntary exercise protocols performed in a random order and separated by a 20 min rest period. Once seated in the leg dynamometer, after the subject had attained a stable basal circulatory state, continuous beat-to-beat recordings of resting heart rate and blood pressure were made for 2 min. Just prior to the start of voluntary or electrically evoked contractions, the thigh occlusion cuff was rapidly (3 s) inflated to a pressure of 26.6 kPa (200 mmHg). Then a 2 min contraction was sustained at 30 % MVC, followed by continued circulatory occlusion of the relaxed muscle for 2 min. Subjects were instructed to breathe as freely as possible and to relax all muscles excluding the plantar flexors. Following exercise the thigh cuff remained inflated for a further 2 min (post-exercise circulatory occlusion or PECO) which after deflation was followed by a further 2 min recovery period (Diagram 1).
Diagram 1.
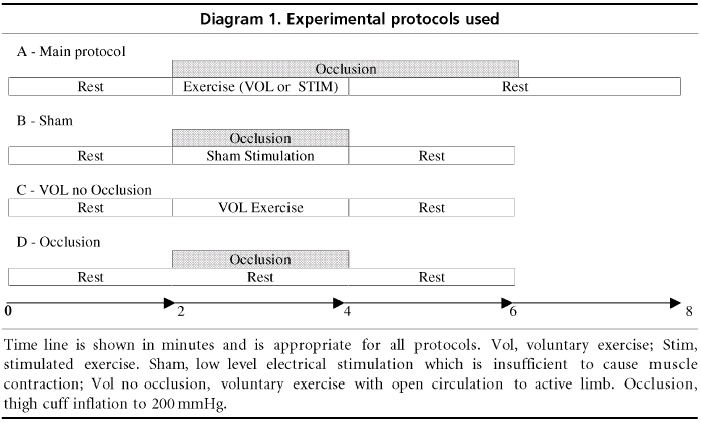
Experimental protocols used
Electromyogram recordings from the belly of the gastrocnemius and tibialis anterior were made in a subset of subjects (n = 3). Recordings were made using bipolar, silver surface electrodes (10 mm diameter, 17 mm centre to centre) with a skin-mounted pre-amplifier (×1000) encapsulated in epoxy resin (Johnson et al. 1977). Prior to EMG electrode application, the site was prepared by removal of dead skin by gentle abrasion and cleaning with alcohol. Conducting gel was applied to the electrodes before being placed on the central portion of each muscle belly in a direction parallel to muscle fibre orientation. Movement artefacts were prevented by taping the electrodes and wires to the skin. EMG recordings for each subject were made during the same session so that electrode position remained consistent. The EMG signal produced by contraction of the gastrocnemius at 10 % MVC and tibialis anterior at 5 % MVC was recorded for comparison. Analog EMG signals were amplified and converted to a digital signal at a frequency of 1.7 kHz.
Additional experiments
In another group of subjects (n = 10; five from original experiments) additional experiments were conducted to examine the roles of various components of the protocol in producing the initial conductance changes. For sham stimulation, subjects were prepared in the leg dynamometer as for the stimulated protocol and had therefore been exposed to short test stimuli to ascertain the intensity required to cause contraction at 30 % MVC. However, in the event an intensity of stimulus was delivered which, while noticeable, was not sufficient to cause a muscle contraction. Subjects were not informed that the stimulus would be of such a low intensity prior to this experiment. (Diagram 1.)
To assess the role of local circulatory occlusion, subjects were prepared in the leg dynamometer as for the voluntary trial of the general protocol. Following a 2 min rest period a further 2 min of either thigh cuff occlusion (200 mmHg) or voluntary exercise without thigh cuff occlusion was performed followed by 2 min of recovery. (Diagram 1.)
In four subjects (two from original experiments) skin blood flow was measured as laser-Doppler flow (LDF; Moor Instruments Ltd., UK) during the Vol and Stim protocols. LDF probes were attached to the skin at the middle of the widest part of the gastrocnemius, that overlying the tibia at the same height and the arch and dorsum of the foot. For each subject the analog signal was sampled at 20 Hz and an average taken at a time coresponding to blood flow measurements made by venous occlusion plethysmography. Skin vascular conductance is expressed as the ratio of percentage peak cutaneous flow induced by local heating to 40-42 °C (Taylor et al. 1988) and MAP and is expressed in arbitrary units.
To investigate whether vascular changes in the foot during the main protocol had a measurable effect on calf blood flow, the same four subjects also performed this protocol but with the circulation occluded to the foot of the limb from which blood flow measurements were made. Foot circulatory occlusion was achieved using a tourniquet cuff positioned just proximal to the ankle joint and inflated to 250 mmHg 1 min prior to the start of the experiment.
Data analysis
Results are all presented as means ± s.e.m. MAP and HR values are reported at 15 s intervals throughout each protocol. They were calculated as the average of the values of the three consecutive beats immediately prior to each time point. Subjects performed the main protocol on two occasions. Data recorded during the two voluntary and stimulated trials were averaged for each subject. In all other experiments, subjects performed only one trial of each protocol. Repeated measures analysis of variance (ANOVA) was conducted to investigate time and condition effects at rest and during exercise phases of the protocols. Group means were calculated by averaging the individual values, thus minimising inter-trial variability. Statistical analysis performed using ANOVA was adjusted using the Greenhouse- Geisser correction. Post hoc analysis was conducted with paired t tests between rest and exercise onset. In all tests statistical significance was set at P < 0.05.
Results
Contractile responses
There was no significant difference between the maximum voluntary forces recorded prior to the main protocol for voluntary or stimulated conditions (1068 ± 105 and 1007 ± 87 N, respectively). These values are similar to those produced prior to voluntary contraction without thigh cuff inflation (1004 ± 51 N).
Cardiovascular responses during main protocol
MAP
Mean resting MAP prior to voluntary exercise was 84.1 ± 1.1 and 87.1 ± 0.4 mmHg (Vol and Stim, respectively). Series analysis of MAP (2-way ANOVA) showed no significant differences between resting pressures prior to Vol and Stim trials. Additionally, no difference was found between conditions during exercise, PECO or recovery. During exercise there was a significant linear effect of time (P < 0.01) with MAP reaching end points of 106.0 ± 3.8 and 104.9 ± 2.5 mmHg in Vol and Stim trials, respectively. During PECO, MAP fell from peak exercise levels but remained significantly elevated above resting levels (P < 0.01). Upon removal of circulatory occlusion MAP fell sharply before returning to baseline during the recovery period (Fig. 1).
Figure 1.
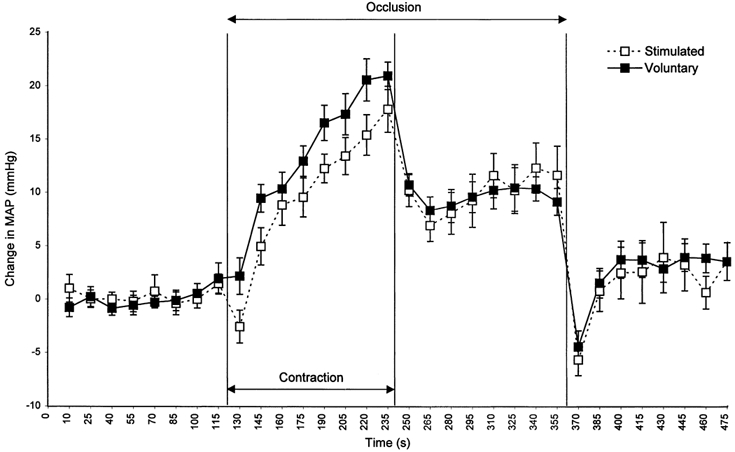
Changes in MAP before, during and after 2 min of Vol (▪, continuous line) and Stim (□, dashed line) exercise.
Heart rate
Group mean resting heart rates prior to exercise were 75 ± 0.3 and 74 ± 0.4 beats min−1 for Vol and Stim, respectively. Series analysis of HR (2-way ANOVA) at rest showed no significant effect of time or condition. After 10 s of Vol exercise HR increased to 84 ± 3.8 beats min−1 (11 %) before decreasing slightly after 25 s of voluntary exercise. HR then increased progressively throughout the rest of the contraction period to reach an end-point value of 87 ± 3.0 beats min−1 (Fig. 2). During the Stim trial after 10 s of exercise, heart rate had increased to 85 ± 3.9 beats min−1 (13 %) before decreasing slightly at 25 s of exercise. HR then decreased slowly throughout the rest of the exercise period to reach an end-point value of 78 ± 3.0 beats min−1. During PECO, upon the cessation of exercise HR fell to baseline levels with no significant difference between conditions. After an initial sharp increase in heart rate, on cuff deflation, HR recovered to baseline levels with no significant difference in recovery patterns between conditions (Fig. 2).
Figure 2.
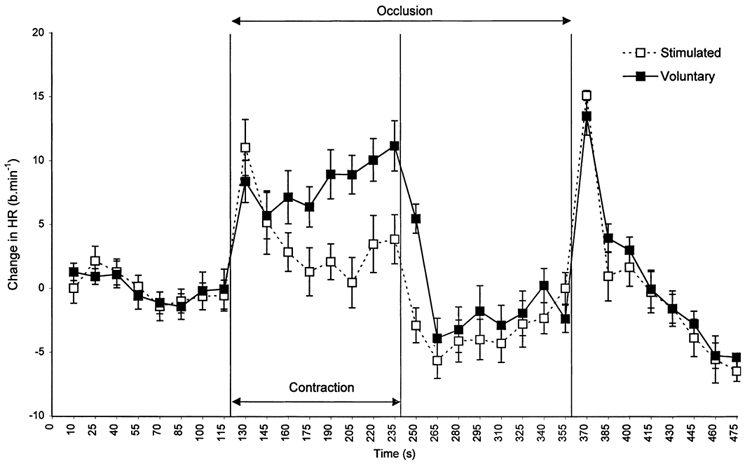
Changes in HR before, during and after 2 min of Vol (▪, continuous line) and Stim (□, dashed line) exercise.
Conductance
Group mean resting conductance prior to exercise was 0.023 ± 0.002 and 0.022 ± 0.002 ml (100 ml)−1 min−1 mmHg−1 for the Vol and Stim protocols, respectively. There was no significant effect of time or condition on resting mean conductance values, and no significant difference between conditions during exercise, PECO or recovery. After 10 s of exercise, mean conductance increased from rest to 0.026 ± 0.003 (15 %) and 0.025 ± 0.003 ml (100 ml)−1 min−1 mmHg−1 (12 %) (P < 0.05), in Vol and Stim, respectively. After 25 s of exercise, conductance had returned to mean resting levels and continued this significant decrease throughout the exercise protocol to reach an end-point value of 0.018 ± 0.002 and 0.017 ± 0.002 ml (100 ml)−1 min−1 mmHg−1 for Vol and Stim protocols, respectively (Fig. 3). Upon cessation of exercise, conductance increased from end-exercise levels; however, it remained significantly below baseline levels throughout the PECO phase in Stim and Vol conditions. Upon release of the thigh cuff, conductance returned to baseline after an initial decrease.
Figure 3.

Changes in conductance before, during and after 2 min of Vol (▪, continuous line) and Stim (□, dashed line) exercise. *P < 0.05 initial change versus mean rest.
Sham stimulation with occlusion
There was no significant change in MAP from rest throughout the sham stimulation, whilst HR showed a progressive decrease reaching 4 beats min−1 below baseline by end stimulus. However, conductance showed a significant increase after 10 s of sham stimulation (P < 0.05; Table 1) that had returned to baseline after 40 s of sham stimulation. The change in conductance after 10 s of sham stimulation was 0.007 ± 0.001 ml (100 ml)−1 min−1 mmHg−1, as compared with the value of 0.0028 ± 0.002 ml (100 ml)−1 min−1 mmHg−1 observed in the larger subject group who performed the Stim protocol.
Table 1.
Absolute resting lower limb conductor values and changes from rest at 10 s of intervention
| Condition | Resting conductance (ml (100 ml)−1 min−1 mmHg−1) | Change from rest at 10 s exercise (ml (100 ml)−1 min−1 mmHg−1) |
|---|---|---|
| Voluntary exercise | 0.023 ± 0.002 | 0.004 ± 0.002* |
| Stimulated exercise | 0.022 ± 0.002 | 0.003 ± 0.002* |
| sham stimulus | 0.026 ± 0.001 | 0.007 ± 0.001** |
| Voluntary exercise with open circulation | 0.028 ± 0.001 | 0.004 ± 0.002* |
| Calf occlusion alone | 0.028 ± 0.001 | 0.001 ± 0.001 |
| Voluntary exercise (foot circulation occluded non active limb) | 0.022 ± 0.006 | 0.004 ± 0.003 |
Conductance values are expressed as ml (100 ml)−1 min−1 mmHg−1± s.e.m.; significant difference from rest
P < 0.05
P < 0.01.
Voluntary exercise without occlusion
Voluntary exercise without cuff inflation produced similar increases in MAP and HR to those in the main Vol protocol, reaching 16.64 ± 2.19 mmHg (P < 0.05) and 6.55 ± 1.92 beats min−1 (P < 0.05), respectively, above resting levels at end exercise. After 10 s of exercise, conductance had increased by 0.0039 ± 0.002 ml (100 ml)−1 min−1 mmHg−1 from baseline (P < 0.05; Table 1), before decreasing progressively (P < 0.05) throughout the exercise protocol, reaching 0.0058 ± 0.002 ml (100 ml)−1 min−1 mmHg−1 below baseline at end exercise.
Occlusion alone
Passive cuff inflation to supra-systolic pressure caused a progressive decrease (P < 0.05) in HR over the 2 min experimental period, reaching 3.71 ± 1.14 beats min−1 below baseline whilst MAP remained unchanged throughout. In the contralateral limb, conductance had not changed after 10 s (Table 1) and did not change thereafter.
EMG
There was no measurable EMG activity from gastrocnemius or tibialis anterior of the non-active limb during either Stim or Vol protocols.
Skin conductance
Skin conductance at the gastrocnemius and tibial sites showed little change from resting values after 10 s of exercise in either the Stim or Vol protocols (Table 2). Skin conductance at the foot dorsum and arch sites showed marked vasoconstriction (Table 2).
Table 2.
Mean skin conductance at rest and after 10 s of exercise
| Condition | ||||
|---|---|---|---|---|
| Skin conductance site measured | Rest | After 10 s voluntary exercise | Rest | After 10 s stimulated exercise |
| Calf (n = 4) | 0.056 ± 0.002 | 0.072 ± 0.0042 | 0.074 ± 0.001 | 0.074 ± 0.015 |
| Tibia (n = 3) | 0.045 ± 0.007 | 0.051 ± 0.01 | 0.095 ± 0.002 | 0.01 ± 0.028 |
| Sole (n = 4) | 0.025 ± 0.002 | −0.089 ± 0.006 | — | — |
| Foot dorsum (n = 4) | 0.095 ± 0.015 | 0.008 ± 0.003 | — | — |
Conductance values are expressed as arbitrary units ± s.e.m.
Calf conductance with foot occlusion
After 10 s of isometric exercise, the calf conductance in the contralateral lower limb measured with the foot occluded was of a similar magnitude to that observed in the larger group without the foot circulation occluded (Table 1).
Discussion
Isometric contractions of the calf plantar flexors, performed voluntarily and electrically evoked, resulted in a progressive increase in BP and HR. The increase in HR was more pronounced during Vol. During PECO, BP remained elevated whereas HR fell towards resting levels. These changes were similar to those previously reported (Fisher & White, 1999). The major novel findings of the present study are that early (10-15 s) in both Vol and Stim exercise there was a transient increase in conductance in the contralateral non-active lower limb. This phenomenon still occurred during, but not in anticipation of, sham stimulation where BP remained unaltered. Since in this case there was the expectation of Stim exercise but none occurred, it suggests that this increase in conductance must be triggered by sensations evoked by the stimulus but does not require muscle contraction per se.
There may be several reasons why early calf vasodilatation has not been reported previously. Seals (1989) noted an initial increase in calf blood flow during handgrip exercise. However, as blood pressure was only measured at 45 s intervals they possibly overestimated the magnitude of this change and therefore calculated a small increase in vascular resistance. At this time point (10 s of exercise) we found no change in blood pressure which if true of Seals et al.'s study would then lead to a decrease in vascular resistance being calculated at the onset of their exercise. Similarly Taylor et al. (1989) reported an immediate increase in the blood flow of the contralateral limb during both calf and forearm exercise but vascular resistance was not significantly decreased in the calf. This may be explained on the basis of their calculation of resistance using MAP which was measured 1 min after exercise commenced.
Gaffney et al. (1990) did report a decrease in non-active limb vascular resistance but at 30 s into static exercise of the contralateral quadriceps at 20-25 % MVC. The timing of this resistance change differs from that of the present study which suggests a different mechanism to that in the present study (see below).
The mechanisms which could underpin the immediate changes in conductance we observed fall into five main areas.
Exercise-induced local metabolite accumulation
Cotzias & Marshall (1993) reported that vascular resistance decreased in the non-active forearm during contralateral limb exercise only when inadvertent EMG activity was detected in the non-active limb. We can rule out inadvertent muscle activation of the non-active limb and subsequent local metabolite production as a cause of the initial increase in conductance as we found no EMG activity at the onset of, or during exercise. This finding supports the work of Rusch et al. (1981) who reported that EMG activity was rarely seen in the non-active limb early in exercise, at which time the vasodilatory response was greatest.
Shear stress
In agreement with Eklund et al. (1974) we can eliminate passive distension of resistance vessels by increased blood pressure as a cause of the increased conductance at exercise onset since MAP and pulse pressure were unchanged at this time. In addition we can eliminate a shear stress-related increase in nitric oxide production and subsequent vasodilatation for the same reason. However shear stress might explain the decrease in non-active limb vascular resistance after 30 s of exercise reported by Gaffney et al. (above) since they reported that BP was markedly increased at this time.
Sympathetic withdrawal
A decrease in basal sympathetic tone could explain our results. Indeed, Ray et al. (1992) demonstrated in man, a decrease in MSNA of the passive lower limb during the first minute of seated contralateral quadriceps exercise at 30 % MVC. However, this may have been caused by an increase in venous return at exercise onset leading to baroreflex-mediated sympathetic withdrawal (Joyner et al. 2001).
In the present study, exercise was performed with the circulation of the active limb occluded thus eliminating the possibility of increased venous return from the exercised limb. Additionally, simply inflating the thigh cuff in the absence of exercise, which might be expected to cause a transient increase in venous return, failed to produce a change in non-active limb conductance. Finally our recent findings on haemodynamic responses to exercise onset under Vol and Stim conditions confirm that there is no significant alteration in cardiac output over the initial 15 s period of isometric exercise using this protocol (Fisher & White, 2002).
In contrast to the decrease in MSNA reported by Ray et al. (1992), Herr et al. (1999) found that MSNA increased within 4-6 s of unilateral quadriceps exercise at 25 % MVC.
Using a non-exercise model Halliwill et al. (1997) demonstrated that radial nerve MSNA decrease was associated with increased conductance of the forearm during mental stress. It is not clear in these experiments exactly what effect, if any, the marked blood pressure increase during mental stress may have had on baroreflex modulation of MSNA. The final resolution of whether there is sympathetic withdrawal during our protocols awaits direct recording of MSNA from the peroneal nerve during exercise onset and sham stimulation.
Circulating catecholamines
Kozlowski et al. (1973) showed that catecholamine release is provoked by isometric contraction at 30 % MVC handgrip exercise but this increase was not evident until 1 min after isometric exercise began. This is after the transient conductance increase observed in the present study occurred. The rapid increase in conductance at exercise onset followed by a progressive decrease would appear to rule out the effects of a circulating vasodilatory substance. Additionally, in the present study, sham stimulation produced a rapid increase in conductance, which again rapidly returned to baseline and this also argues against a contribution from a circulating vasodilator.
Cholinergic/nitrosyl factors
An initial increase in conductance mediated through sympathetic cholinergic vasodilatation is one possible explanation for the current findings. However, although sympathetic cholinergic fibres have been described in cat and dog muscle (Bolme & Fuxe, 1970), direct evidence for their existence in primate and human muscle is still lacking. Their existence in man has been inferred from pharmacological antagonism of vasodilatation thought to arise from cholinergic stimulation in response to mental and exercise stressors. Saunders et al. (1989) reported that contralateral forearm vasodilatation during 2 min of isometric handgrip was abolished by atropine, but was not affected by propranolol. Therefore they argued that β-adrenergic-mediated vasodilatation could be ruled out and sympathetic-cholinergic vasodilatation was implicated. However, since there was a marked pressor response to the handgrip exercise (as expected) a direct effect of shear stress could also explain their findings. Reed et al. (2000) demonstrated that contralateral handgrip carried out to fatigue over several minutes provoked skeletal muscle vasodilatation after blockade of the sympathetic nerves. This response was shown to be partially attenuated by either propranolol or l-NMMA and when administered together, they virtually eliminated it. Thus they concluded that locally released nitric oxide in conjunction with circulating catecholamines, stimulating β2-receptors, was likely to mediate the response (Joyner & Halliwill, 2000). Once again potential shear stress effects (see above) induced by the pressor response to sustained handgrip exercise mean that it is difficult to infer whether release of nitrosyl factors was locally or neurally mediated.
Following the initial increase in conductance at exercise onset we found that continued isometric exercise produced a progressive decrease in conductance. As there was no difference between the conductance decrease produced by Vol and Stim it appears that muscle afferent activation caused progressive vasoconstriction independently of central command. During sham stimulation and arterial occlusion without exercise there was no progressive decrease in conductance at the time at which this was seen upon exercise. Clearly sufficient metabolite accumulation is necessary for activation of afferents within the active muscle and for progressive augmentation of reflex sympathetic outflow (Mark et al. 1985). This is likely to take longer than 15 s in the predominantly slow-twitch fibre human calf muscle (Carrington et al. 1995). The maintenance of the decrease in vascular conductance below pre-contraction levels during PECO, mirroring the blood pressure rise at this time, is consistent with sustained muscle chemoreflex-mediated vasoconstriction (Seals, 1989).
A possible limitation to our study is that the technique of venous occlusion plethysmography measures not only muscle blood flow but also that of all tissues of the limb surrounded by the gauge (e.g. skin and bone). At exercise onset and thereafter we found very small changes in skin conductance at sites over the tibia and the gastrocnemius and a vasoconstriction in foot sites (arch of sole and dorsum). Occlusion of the circulation to the foot made little difference to the changes in conductance observed. Furthermore a recent study (Saad et al. 2001) reported no change in the non-glaborous skin blood flow over the tibia during isometric leg extension. Therefore the transient increase in lower limb conductance observed at the onset of exercise in the non-active limb is likely to be accounted for by changes in muscle blood flow.
In summary this study has shown an early increase in conductance of non-active limb calf muscle followed by a progressive decrease during both voluntary and electrically evoked exercise of the contralateral limb. This in part supports previous studies. However, due to experimental differences in the timing of the measurements made in these previous studies and the effect this had on the calculation of vascular indices, we believe an important transient conductance change was missed. Further our experimental model benefits from several important design features which help to control the variables that would otherwise confound the interpretation of the vasodilatation we see at exercise onset. These are, the absence of: (1) inadvertent muscle activation; (2) shear stress increase due to blood pressure rise; (3) central fluid shifts and related reflex-mediated sympathetic withdrawal; and (4) muscle afferent activation in sham exercise (and probable delayed activation in Stim and Vol).
We conclude that the increased conductance we observed is independent of central command and muscle force and metabolite generation. It can be activated in response to peripheral sensations associated with expected exercise but not in anticipation of such signals. The explanation of our results might involve sympathetic withdrawal related to mental stress. However, a central pathway, which directly activates a vasodilator mechanism in passive calf muscle, remains a possibility.
Acknowledgments
We gratefully acknowledge the advice of Dr M. D. Brown regarding the limb blood flow measures and her helpful comments on the manuscript. We also thank D. McIntyre for writing the script files for Spike 2.
References
- Bolme P, Fuxe K. Adrenergic and cholinergic nerve terminals in skeletal muscle vessels. Acta Physiol Scand. 1970;78:52–59. doi: 10.1111/j.1748-1716.1970.tb04638.x. [DOI] [PubMed] [Google Scholar]
- Carrington CA, White MJ, Harridge SDR, Goodman M, Cummins P. The relationship between the pressor response to involuntary isometric exercise and the contractile protein profile of the active muscle in man. Eur J Appl Physiol. 1995;72:81–85. doi: 10.1007/BF00964119. [DOI] [PubMed] [Google Scholar]
- Carrington CA, White MJ. Exercise-induced muscle chemoreflex modulation of spontaneous baroreflex sensitivity in man. J Physiol. 2001;536:957–962. doi: 10.1111/j.1469-7793.2001.00957.x. [DOI] [PMC free article] [PubMed] [Google Scholar]
- Cotzias C, Marshall JM. Vascular and electromyogrphic responses evoked in forearm muscle by isometric contraction of the contralateral forearm. Clin Auton Res. 1993;3:21–30. doi: 10.1007/BF01819139. [DOI] [PubMed] [Google Scholar]
- Eklund B, Kaijser L, Knutton E. Blood flow in rest (contralateral) arm and leg during isometric contraction. J Physiol. 1974;240:111–124. doi: 10.1113/jphysiol.1974.sp010602. [DOI] [PMC free article] [PubMed] [Google Scholar]
- Fisher JP, Carrington CA, White MJ. Haemodynamic responses to voluntary and stimulated isometric exercise in man. J Physiol. 2002;543.P:45P. [Google Scholar]
- Fisher WJ, White MJ. Training-induced adaptations in the central command and peripheral reflex components of the pressor response to isometric exercise of the human triceps surae. J Physiol. 1999;520:621–628. doi: 10.1111/j.1469-7793.1999.00621.x. [DOI] [PMC free article] [PubMed] [Google Scholar]
- Fisher JP, White MJ. Lower limb vascular conductance increases at the onset of voluntary and evoked isometric contraction of the contralateral calf muscles. J Physiol. 2001;536.P:152P. doi: 10.1113/jphysiol.2002.031476. [DOI] [PMC free article] [PubMed] [Google Scholar]
- Gaffney FA, Sjogaard G, Saltin B. Cardiovascular and metabolic responses to static contraction in man. Acta Physiol Scand. 1990;138:249–258. doi: 10.1111/j.1748-1716.1990.tb08844.x. [DOI] [PubMed] [Google Scholar]
- Gamble J, Christ F, Gartside IB. The effect of passive tilting on microvascular parameters in the human calf: a strain gauge plethysmography study. J Physiol. 1997;498:541–552. doi: 10.1113/jphysiol.1997.sp021880. [DOI] [PMC free article] [PubMed] [Google Scholar]
- Halliwill JR, Lawer LA, Eickhoff TJ, Dietz NM, Nauss LA, Joyner MJ. Forearm sympathetic withdrawal and vasodilatation during mental stress in humans. J Physiol. 1997;504:211–220. doi: 10.1111/j.1469-7793.1997.211bf.x. [DOI] [PMC free article] [PubMed] [Google Scholar]
- Herr MD, Imadojemu V, Kunselman AR, Sinoway LI. Characteristics of the human mechanoreflex during quadriceps contractions in humans. J Appl Physiol. 1999;86:767–772. doi: 10.1152/jappl.1999.86.2.767. [DOI] [PubMed] [Google Scholar]
- Johnson SW, Lynn PA, Miller S, Reed GAL. Miniture skin-mounted preamplifier for measurement of surface electromyographic potentials. Med Biomed Eng Comp. 1977;15:710–711. doi: 10.1007/BF02457936. [DOI] [PubMed] [Google Scholar]
- Joyner MJ, Dietz NM, Shepherd JT. From Belfast to Mayo and beyond: the use and future of plethysmography to study blood flow in human limbs. J Appl Physiol. 2001;91:2431–2441. doi: 10.1152/jappl.2001.91.6.2431. [DOI] [PubMed] [Google Scholar]
- Joyner MJ, Halliwill JR. Sympathetic vasodilatation in human limbs. J Physiol. 2000;526:471–480. [PubMed] [Google Scholar]
- Kozlowski S, Brzeinska Z, Nazar K, Kowalski W, Franczyk M. Plasma catecholamines during sustained isometric exercise. Clin Sci Mol Med. 1973;45:723–731. doi: 10.1042/cs0450723. [DOI] [PubMed] [Google Scholar]
- Lind AR, Taylor SH, Humphreys PW, Kennelly BM, Donald KW. The circulatory effects of sustained voluntary muscle contraction. Clin Sci. 1964;27:229–244. [PubMed] [Google Scholar]
- Mark AL, Victor RG, Nerhed C, Wallin BG. Microneurographic studies of the mechanisms of sympathetic nerve responses to static exercise in humans. Circ Res. 1985;57:461–469. doi: 10.1161/01.res.57.3.461. [DOI] [PubMed] [Google Scholar]
- Patterson GC, Whelan RF. Reactive hyperaemia in the human forearm. Clin Sci. 1955;14:197–211. [PubMed] [Google Scholar]
- Ray CA, Rea RF, Clary MP, Mark AL. Muscle sympathetic nerve responses to static leg exercise. J Appl Physiol. 1992;73:1523–1529. doi: 10.1152/jappl.1992.73.4.1523. [DOI] [PubMed] [Google Scholar]
- Reed AS, Tschakovsky ME, Minson CT, Halliwill JR, Torp KD, Nauss LA, Joyner MJ. Skeletal muscle vasodilatation during sympathoexcitation is not neurally mediated in humans. J Physiol. 2000;525:253–262. doi: 10.1111/j.1469-7793.2000.t01-1-00253.x. [DOI] [PMC free article] [PubMed] [Google Scholar]
- Rusch NJ, Shephard RJ, Webb C, Vanhoutte PM. Different behaviours of the resistance vessels of the human calf and forearm during contralateral isometric exercise, mental stress, and abnormal respiratory movements. Circ Res. 1981;48:I118–130. [PubMed] [Google Scholar]
- Saad AR, Stephens DP, Bennett LA, Charkoudian N, Kosiba WA, Johnson JM. Influence of isometric exercise on blood flow and sweating in glabrous and nonglabrous human skin. J Appl Physiol. 2001;91:2487–2492. doi: 10.1152/jappl.2001.91.6.2487. [DOI] [PubMed] [Google Scholar]
- Saunders JS, Mark AL, Ferguson DW. Evidence for cholinergically mediated vasodilatation at the beginning of isometric exercise in humans. Circulation. 1989;79:815–824. doi: 10.1161/01.cir.79.4.815. [DOI] [PubMed] [Google Scholar]
- Seals DR. Influence of muscle mass on sympathetic neural activation during isometric exercise. J Appl Physiol. 1989;67:1801–1806. doi: 10.1152/jappl.1989.67.5.1801. [DOI] [PubMed] [Google Scholar]
- Siggaard-Anderson J. Venous occlusion plethysmography on the calf. Evaluation of diagnosis and results in vascular surgery. Dan Med Bull. 1970;17(suppl.1):1–66. [PubMed] [Google Scholar]
- Taylor AJ, Joyner MJ, Chase PB, Seals DR. Differential control of forearm and calf vascular resistance during one-leg exercise. J Appl Physiol. 1989;67:1791–1800. doi: 10.1152/jappl.1989.67.5.1791. [DOI] [PubMed] [Google Scholar]
- Taylor WF, Johnson JM, Kosiba WA, Kwan CM. Graded cutaneous vascular responses to dynamic leg exercise. J Appl Physiol. 1988;64:1803–1809. doi: 10.1152/jappl.1988.64.5.1803. [DOI] [PubMed] [Google Scholar]
- Victor RG, Bertocci LA, Pryor SL, Nunnally RL. Sympathetic nerve discharge is coupled to muscle cell pH during exercise in humans. J Clin Invest. 1988;82:1301–1305. doi: 10.1172/JCI113730. [DOI] [PMC free article] [PubMed] [Google Scholar]
- Whitney RJ. The measurement of volume changes in human limbs. J Physiol. 1953;121:1–27. doi: 10.1113/jphysiol.1953.sp004926. [DOI] [PMC free article] [PubMed] [Google Scholar]