

Abstract
We have characterized the dependence on membrane potential (Vm) and calcium current (ICa) of calcium-induced calcium release (CICR) from the junctional-SR (j-SR, in the subsarcolemmal (SS) space) and non-junctional-SR (nj-SR, in the central (CT) region of the cell) of cat atrial myocytes using whole-cell voltage-clamp together with spatially resolved laser-scanning confocal microscopy. Subsarcolemmal and central [Ca2+]i transient amplitudes and ICa had a bell-shaped dependence on Vm, but [Ca2+]i reached a maximum at more negative Vm (-10 to 0 mV) than ICa (+10 mV). Termination of ICa after a brief depolarization (2.5 to 22.5 ms) immediately interrupted only the SS [Ca2+]i transient, leaving the development of the CT [Ca2+]i transient unaffected. Block of SR function with 20 μm ryanodine and 2 μm thapsigargin, revealed that > 90 % of the control [Ca2+]i transient amplitude was attributable to active SR Ca2+ release through ryanodine receptors (RyRs). The gain of SR Ca2+ release was highest in the SS space at negative test potentials and was less pronounced in the CT region. Inhibition of Na+-Ca2+ exchange resulted in prolonged and higher amplitude [Ca2+]i transients, elevated resting [Ca2+]i, accelerated propagation of CICR, decreased extrusion of Ca2+ and an increase in j-SR Ca2+ load. Increasing the cytosolic Ca2+ buffer capacity by internal perfusion with 1 mm EGTA limited SR Ca2+ release to the SS region, indicating that Ca2+ release from nj-SR is initiated by diffusion of Ca2+ from the cell periphery and propagating CICR. Junctional-SR Ca2+ release occurred at discrete sites whose order of activation and amplitude of release varied from beat to beat. In conclusion, during normal excitation-contraction coupling in cat atrial myocytes, only Ca2+ release from the j-SR is directly activated by Ca2+ entering via ICa. Elevation of SS [Ca2+]i is required to provide the cytosolic Ca2+ gradient needed to initiate regenerative and propagating CICR from nj-SR.
In mammalian cardiac myocytes the release of Ca2+ from the sarcoplasmic reticulum (SR) during normal excitation-contraction (E-C) coupling is activated by a small amount of Ca2+ entering the cell (ICa) through voltage-dependent L-type Ca2+ channels (dihydropyridine receptors, DHPRs) in a process known as calcium-induced calcium release (CICR; Fabiato, 1983). There is a high degree of amplification of the Ca2+ entry signal through Ca2+ release from the SR via CICR. Calcium-induced calcium release, however, does not occur in an all-or-none fashion and can be graded with the magnitude of ICa (for reviews see Callewaert, 1992; Wier & Balke, 1999; Bers, 2001). How such a large amount of Ca2+ can be released in response to a small influx without itself triggering uncontrolled release was resolved with the discovery of spatially restricted Ca2+ signalling. The ‘local control model’ of E-C coupling was first proposed by Stern (1992), whereby Ca2+ influx through individual membrane Ca2+ channels (unitary iCa) into the diadic cleft activates release from a cluster of closely associated SR release channels (ryanodine receptors, RyRs). Ca2+ release from each RyR cluster is (largely) independent from the others because of spatial separation. The visualization of localized elementary SR Ca2+ release events, termed Ca2+ sparks (Cheng et al. 1993), was consistent with activation of individual clusters of RyRs (Parker et al. 1996; Lipp & Niggli, 1996; Blatter et al. 1997; Bridge et al. 1999; Lukyanenko et al. 2000). This discovery provided the empirical basis that whole-cell [Ca2+]i signals in cardiomyocytes reflect the temporal and spatial summation of individual local Ca2+ release events, or sparks (Lopez-Lopez et al. 1994; Cannell et al. 1994, 1995; Cheng et al. 1995, 1996). In response to membrane depolarization, additional clusters of RyRs are recruited as more DHPRs open to provide the triggering Ca2+ influx signal.
Several experimental studies using voltage-clamp techniques combined with spatially averaged fluorescence measurements of [Ca2+]i have provided the following key observations of local control during E-C coupling in ventricular myocytes. First, the similar bell-shaped membrane potential-dependence of ICa, contraction and [Ca2+]i transient amplitude are classic hallmarks of CICR in cardiac myocytes (McDonald et al. 1975; London & Krueger, 1986; Cannell et al. 1987; Beuckelmann & Wier, 1988; Callewaert et al. 1988; duBell & Houser, 1989). Second, the amplitude of SR Ca2+ release peaks at a membrane potential more negative than the peak of ICa, the macroscopic Ca2+ influx current (Cannell et al. 1987; Wier et al. 1994). This is attributable to a larger unitary Ca2+ influx at negative potentials where the driving force for Ca2+ entry is higher, providing a more effective trigger for RyR activation. Third, the gain of release (i.e. the amplification of Ca2+ entry by Ca2+ release) is highest at negative test potentials and declines steadily with progressive depolarization (Wier et al. 1994). Thus, it is unlikely that the global [Ca2+]i increase due to macroscopic ICa regulates SR Ca2+ release. Fourth, it was possible to terminate rapidly the rising phase of SR Ca2+ release by stopping ICa (Cannell et al. 1987, 1995; Bers et al. 1990; Cleeman & Morad, 1991; Wier et al. 1994), indicating that RyR activation is closely linked to Ca2+ influx (Cannell et al. 1995; Lopez-Lopez et al. 1995; Santana et al. 1996; Collier et al. 1999). In spite of this tight regulation of Ca2+ release channel activation, under conditions of Ca2+ overload of the SR, cardiac cells can still develop all-or-none type of Ca2+ release in the form of Ca2+ waves (Wier et al. 1987; Takamatsu & Wier, 1990; Wier & Blatter, 1991; Lipp & Niggli, 1993; Trafford et al. 1993). This form of propagating CICR can occur in the absence of action potentials. Ca2+ waves originate at one or several subcellular locations, typically occur repetitively and propagate at constant velocities. They result in spontaneous contractions and have been implicated in certain types of arrhythmia.
An important feature of ventricular myocytes central to the study of E-C coupling and local control is the specific ultrastructural arrangement of DHPRs in conjunction with RyRs, not only at the external sarcolemma, but also along the t-tubules (Lewis Carl et al. 1995; Scriven et al. 2000). This subcellular morphology is responsible for the relatively uniform and homogeneous appearance of electrically evoked [Ca2+]i transients (Cheng et al. 1993, 1994) as the result of synchronized activation of SR Ca2+ release in ventricular myocytes (for a direct comparison between atria and ventricles of the same species see e.g. Berlin, 1995; Hüser et al. 2000b; Blatter et al. 2002). Under conditions of reduced trigger Ca2+, however, inhomogeneities of SR Ca2+ release become evident also in ventricular myocytes (e.g. Cannell et al. 1994; Lopez-Lopez et al. 1994; Cheng et al. 1995).
In contrast to ventricular cells, atrial myocytes are largely devoid of a t-tubular system but have both junctional SR (j-SR) in the periphery and non-junctional SR (nj-SR) in more central, i.e. distant from the sarcolemma, regions of the cell (McNutt & Fawcett, 1969; Lewis Carl et al. 1995). Based on fluorescence membrane staining, cat atrial myocytes have been shown to lack t-tubules (Hüser et al. 1996; Kockskämper et al. 2001). Immunolocalization studies, however, revealed that cat atrial myocytes contain RyRs in the cell periphery as well as in the cell interior, where they are organized in a sarcomeric pattern (Kockskämper et al. 2001). The presence of RyRs at nj-SR membranes has been shown for various species, including rat (Mackenzie et al. 2001), rabbit (Lewis Carl et al. 1995) and human atria (Hatem et al. 1997).
These differences in subcellular architecture are reflected in the spatial and temporal organization of SR Ca2+ release from atrial myocytes. Previous studies using laser-scanning confocal microscopy have suggested that there is active Ca2+ release from both the j-SR and nj-SR of atrial myocytes. [Ca2+]i transients, however, exhibit a pronounced delay in more interior regions of the cell, resulting in characteristic inhomogeneities of the spatio-temporal pattern of [Ca2+]i during E-C coupling (Berlin, 1995; Hüser et al. 1996; Kockskämper et al. 2001; Mackenzie et al. 2001; Tanaka et al. 2001; Blatter et al. 2002, 2003; Woo et al. 2002), a phenomenon that is not observed in ventricular myocytes of the same species (Berlin, 1995; Hüser et al. 2000b; Blatter et al. 2002). Despite the striking differences in [Ca2+]i transients during E-C coupling in atrial vs. ventricular myocytes, the subcellular differences in regulation of RyR Ca2+ release underlying these gradients, particularly the role of membrane potential, ICa and the propagation of Ca2+ release into the centre of the atrial myocytes, are poorly understood.
The goal of this study, therefore, was to apply electrophysiological and Ca2+ imaging methods to characterize in detail the regulation of Ca2+ release from j-SR and nj-SR in cat atrial myocytes. Specifically, we sought (1) to determine the role of membrane voltage and ICa in regulation of Ca2+ release from j-SR and nj-SR, (2) to present a detailed quantitative characterization of the spatio-temporal pattern of atrial [Ca2+]i transients during E-C coupling, address (3) the consequences of inhibition of the sarcolemmal Na+-Ca2+ exchange (NCX) for release from the two types of SR and (4) the effect of altering cytoplasmic Ca2+ buffer capacity on atrial E-C coupling. From these results we evaluate the applicability of the ‘local control model’ of E-C coupling to atrial myocytes, and propose that only Ca2+ release from j-SR is tightly controlled by the influx of Ca2+ through voltage-dependent sarcolemmal calcium channels. Ca2+ release from nj-SR, conversely, is not directly activated by ICa. Once peripheral Ca2+ release from j-SR has been initiated, elevated peripheral [Ca2+]i activates Ca2+ release from adjacent nj-SR which propagates from the periphery towards the centre of the cells via CICR, i.e. by a mechanism that is similar to Ca2+ wave propagation in ventricular myocytes. Preliminary reports of this study have been published in abstract form (Sheehan & Blatter, 2000; Sheehan et al. 2001a, b).
Methods
Cell isolation and experimental solutions
Adult mongrel cats of either sex were anaesthetized with sodium pentobarbital (50 mg kg−1, i.p.). The procedure used for isolation of atrial myocytes from cat hearts was approved by the Institutional Animal Care and Use Committee of Loyola University Chicago, Stritch School of Medicine. Following thoracotomy hearts were quickly excised, mounted on a Langendorff apparatus, and retrogradely perfused with collagenase-containing solution at 37 °C according to the method described previously (Wu et al. 1991). Myocytes were used 1-6 h after isolation. The cells were bathed in a Tyrode solution of the following composition (mm): NaCl, 135; KCl, 4; MgCl2, 1; CaCl2, 1.5; dextrose, 10; Hepes, 10; pH adjusted to 7.3 with NaOH ([NaOH] = ≈5 mm). In voltage-clamp experiments KCl was replaced by CsCl. Fifteen millimolar 2,3-butanedione monoxime (BDM) was added to the extracellular solution to minimize motion artifacts, except in experiments where the pipette solution contained EGTA. In experiments where SR Ca2+ release and reuptake was inhibited, cells were pre-incubated with ryanodine (20 μm) and thapsigargin (2 μm) for a minimum of 30 min. In sodium substitution experiments, extracellular Na+ was replaced with Li+ on an equimolar basis. In Na+-free experiments, pH was adjusted with LiOH. All experiments were carried out at room temperature (20-22 °C).
Electrophysiology
Atrial myocytes were plated on glass coverslips forming the bottom of the experimental chamber. The chamber was placed on the stage of an inverted microscope (Axiovert 100, Carl Zeiss, Germany) equipped with a 40× objective lens (Plan-Neofluar, oil-immersion, NA = 1.3, Carl Zeiss). Cells were continuously superfused with Tyrode solution throughout the experiment. Whole-cell patch-clamp recordings (Hamill et al. 1981) were performed in the ruptured patch configuration using an Axopatch 200A patch-clamp amplifier (Axon Instruments, Union City, CA, USA) and PCLAMP6 software (Axon Instruments) for generation of the voltage protocols and membrane current recordings. The composition of the pipette solution was (mm): Cs-glutamate, 130; Hepes, 10; CsCl, 20; MgCl2, 0.33; MgATP, 4; pH adjusted to 7.3 with CsOH. The pipette solution also contained 100 μm of the Ca2+ indicators Fluo-3 or Fluo-4 (see below). In some experiments 1 mm EGTA and 455 μm CaCl2 were added to the pipette solution to obtain a free [Ca2+]i of 100 nm. Membrane currents were low-pass filtered at 1 kHz during acquisition and digitized at 2 kHz. Patch pipettes were fabricated from borosilicate glass capillary tubing (Sutter Instrument Co., Novato, CA, USA). Pipettes were fire polished and had a resistance of 1.5-3 MΩ when filled with pipette solution. To reproducibly load the SR with Ca2+, a train (0.83 Hz) of four depolarizing pulses (100 ms) from a holding potential (Vh) of −40 mV to +10 mV was applied before each test depolarization. Contaminating membrane currents were eliminated by the substitution of Cs+ for K+ in both the extracellular and pipette solutions, and applying a −40 mV holding potential (Vh) during recording to inactivate sodium current. Between experimental recordings the cells were held at −70 mV. L-type Ca2+ currents (ICa) were quantified by measuring the difference between peak current and steady-state current at the end of the depolarization pulse. No further corrections for leak and contaminating currents were made. ICa is expressed as current density (pA pF−1). Membrane capacitance (Cm) was determined for each cell by applying a 5 mV hyperpolarizing pulse from −80 mV. The capacitance current decay was fitted with a monoexponential function. Membrane capacitance was calculated according to Cm = τ(I/ΔV), where τ is the time constant of the exponential fit, I is the input current and ΔV is the amplitude of the voltage pulse.
Intracellular calcium measurements
In voltage-clamp experiments atrial myocytes were loaded with pentapotassium salts of the Ca2+ indicators Fluo-3 or Fluo-4 (Molecular Probes, Eugene, OR, USA) through the recording pipette (100 μm). In field-stimulation experiments cells were loaded with Fluo-3 by exposure to 1 ml standard Tyrode solution containing 20 μm Fluo-3 acetoxymethyl-ester (Fluo-3 AM; Molecular Probes, Eugene, OR, USA) and 20 μl of a Pluronic F-127 stock solution (0.2 g ml−1 Pluronic F-127 dissolved in DMSO) for 20 min at room temperature. A minimum of 15 min was allowed for de-esterification of the indicator. The Ca2+ indicators were excited with the 488 nm line of an argon ion laser attached to the microscope via a confocal laser-scanning unit (LSM 410, Carl Zeiss). Emitted Fluo-3 and Fluo-4 fluorescence was measured at wavelengths > 515 nm. Linescan images (2.1-4.4 ms line−1) were recorded simultaneously with membrane currents. All linescan images were recorded from a central focal plane. The scanned line was oriented in the transverse direction, i.e. perpendicular to the longitudinal axis of the cell except where indicated. [Ca2+]i images were calculated according to the formula (Cannell et al. 1994):
where R is the fluorescence (F) normalized to resting (F0) fluorescence (R = F/F0). Kd is the dissociation constant for the Ca2+-dye complex. Values of 1.1 μm were taken for the Kd of Fluo-3 (Harkins et al. 1993) and Fluo-4 (Thomas et al. 2000). [Ca2+]rest was taken as 100 nm (Lipp et al. 1990; Hüser et al. 1996, 2000a, b).
Data presentation and statistical analysis
Results are reported as means ± standard error of the mean (s.e.m.) for the indicated number (n) of cells. Statistical significance was evaluated using a non-parametric 2-tailed Mann-Whitney U test.
Results
Characteristics of cat atrial [Ca2+]i transients
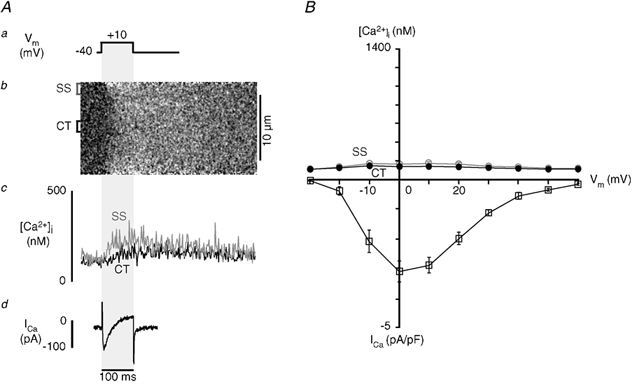
The goal of the present study was to gain detailed insight into the mechanisms of Ca2+ release from j-SR and nj-SR in atrial myocytes during E-C coupling. For this purpose we characterized membrane Ca2+ current, [Ca2+]i transients and Ca2+ release flux originating from these two ultrastructurally different regions using simultaneous whole-cell voltage-clamp current recordings and laser-scanning confocal microscopy. Figure 1 shows the typical response of an atrial myocyte to the application of a 100 ms depolarizing pulse from −40 mV to +10 mV (Fig. 1A). Panel B shows the macroscopic Ca2+ current (ICa) triggered by the step depolarization. The linescan image (Fig. 1C) illustrates the spatio-temporal pattern of [Ca2+]i during membrane depolarization. The laser-scanning line was positioned perpendicular to the longitudinal axis of the cell (transverse scan; Fig. 1D) to record simultaneously SS and CT [Ca2+]i. Elevation of [Ca2+]i began at the periphery of the cell immediately upon depolarization and the initiation of Ca2+ influx, but remained low in the centre at that time. The [Ca2+]i increase subsequently propagated to the centre of the cell where it peaked with a delay of about 45 ms in relation to peak [Ca2+]i in the cell periphery. These spatially inhomogeneous intracellular [Ca2+] gradients during voltage-clamp depolarizations were observed in 35 atrial myocytes. Similar [Ca2+]i transients have been described previously during action potential-stimulated [Ca2+]i increases in these cells, and it was suggested that they were due to a diffusion-mediated mechanism of propagating CICR (Hüser et al. 1996). The time course of [Ca2+]i was averaged over the section of the linescan image representing the entire width of the cell (Fig. 1E, whole line). The peak whole-cell [Ca2+]i amplitude was near 500 nm. Peak elevation of [Ca2+]i was followed by a slow (several 100 ms) decline of [Ca2+]i to resting levels. Spatially resolved subcellular [Ca2+]i transients (Fig. 1F) calculated by averaging the fluorescence intensity over 1.5 μm wide sections of the linescan image, revealed differences in [Ca2+]i in the subsarcolemmal and central regions. Subsarcolemmal [Ca2+]i rose rapidly, peaked at about 800 nm and decayed more rapidly than the whole-cell [Ca2+]i transient. In contrast, CT [Ca2+]i rose more slowly to a broad peak of only about 350 nm. As a result of the different time courses of SS and CT [Ca2+]i transients, the CT [Ca2+]i transient reached its peak after the SS [Ca2+]i transient had already declined to half or less of its maximum.
Figure 1. Ca2+ influx and SR [Ca2+]i release in atrial myocytes.
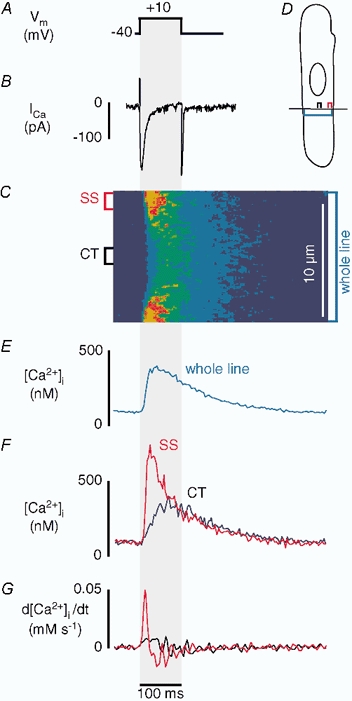
Simultaneous measurements of ICa and subcellular (SS and CT) [Ca2+]i transients recorded from a voltage-clamped atrial myocyte during a depolarizing pulse (100 ms) from a holding potential of −40 mV to a test potential of +10 mV. From top to bottom are shown the voltage protocol (A), macroscopic inward Ca2+ current (ICa) (B), linescan image showing the spatial and temporal patterns of [Ca2+]i change during stimulation (C). For confocal linescan imaging the scanned line was positioned perpendicular to the longitudinal axis of the cell at a central focal plane (D). [Ca2+]i was measured with the Ca2+ indicator Fluo-3. E shows [Ca2+]i averaged over the section of the line which represents the entire width of the cell. F shows the local [Ca2+]i transients. [Ca2+]i was averaged over 1.5 μm sections of the linescan in the subsarcolemmal (SS, red) and central (CT, black) regions indicated to the left of the linescan image. G shows the first derivative (d[Ca2+]i/dt) of the local [Ca2+]i transients.
In the majority of cells CT [Ca2+]i remained at levels just below SS [Ca2+]i. Nevertheless, in some cells CT [Ca2+]i peaked at higher levels than the declining SS [Ca2+]i transient, thus reversing the intracellular [Ca2+] gradient (data not shown; see also Hüser et al. 1996). The amplitudes of the SS and CT [Ca2+]i transients varied from cell to cell, possibly due to the position of the linescan in relation to the location of specific Ca2+ release sites (see also Fig. 8, below). An increase in CT [Ca2+]i, however, was never observed in the absence of an elevation of SS [Ca2+]i. The first derivative of the [Ca2+]i transient (d[Ca2+]i/dt) was calculated for each of the SS and CT traces and represents an approximation of the underlying release flux of Ca2+ from the SR (Sipido & Wier, 1991). This simple measure of release flux assumes that endogenous Ca2+ buffering, Ca2+ reuptake into the SR and extrusion from the cell are spatially homogeneous, and that ICa and NCX make minimal contributions to the [Ca2+]i transient. In the example shown (Fig. 1G), d[Ca2+]i/dt was about five times higher in the SS region than in the CT region, indicating a substantially higher rate of increase of [Ca2+]i in the cell periphery as compared with the changes of [Ca2+]i in the cell centre.
Figure 8. Order of activation of individual j-SR Ca2+ release sites.
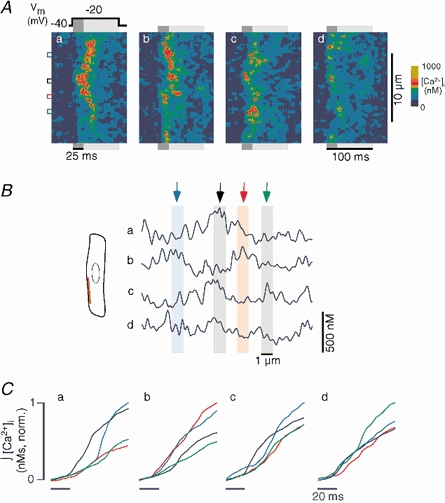
A, four linescan images (a-d) of intracellular [Ca2+]i recorded during four consecutive stimulations of an atrial myocyte. The scanned line (red line in B) was positioned parallel to the longitudinal axis of the cell to record Ca2+ signals from j-SR release sites. The cell was voltage-clamped and internally perfused with 1 mm of the mobile Ca2+ buffer EGTA (intracellular free [Ca2+]i set to ≈100 nm). The cell was stimulated at a frequency of 0.625 Hz by applying depolarizing voltage steps (100 ms) from a holding potential of −40 mV to a test potential of −20 mV (panel a, top). The coloured boxes to the left mark regions of interest of 1 μm width, centred over individual j-SR Ca2+ release sites. B, [Ca2+]i profiles averaged over the first 25 ms of the depolarization pulse (dark grey bars in A). The coloured arrows and bars mark the same sites as in panel A. C, normalized time integral of [Ca2+]i from the same regions of interest marked in A. The integral started 20 ms before the depolarization pulse was applied. Colours as in A and B.
Relationship between membrane potential, ICa and [Ca2+]i
Figure 2Aa-c shows a series of subcellular [Ca2+]i transient traces, their derivatives (d[Ca2+]i/dt), and macroscopic ICa recorded during successive depolarizations of a single atrial myocyte to illustrate the relationship between membrane potential, Ca2+ entry and SR Ca2+ release. Depolarizing pulses were 100 ms in duration from a holding potential of −40 mV to test potentials of −10 mV (a), +10 mV (b) and +30 mV (c). Upon depolarization to −10 mV (a), peak ICa was well developed and was near half of its maximum (see also Fig. 2B). Importantly, even though ICa was not maximal, both SS and CT [Ca2+]i were very close to their maximum amplitudes, suggesting that at −10 mV near maximal SR Ca2+ release could be activated. Furthermore, d[Ca2+]i/dt in the SS and CT regions were within a few per cent of their respective maxima. When the membrane was depolarized to +10 mV (b), ICa was at its highest amplitude, typical for influx through L-type voltage-dependent Ca2+ channels (e.g. Rose et al. 1992). The amplitudes of both SS and CT [Ca2+]i transients, however, were smaller than at −10 mV. Subsarcolemmal d[Ca2+]i/dt was smaller as well, indicating a reduced Ca2+ release flux. Figure 2Ac shows that macroscopic ICa was relatively large when the membrane was depolarized to +30 mV. In contrast, the amplitudes of the SS and CT [Ca2+]i transients were clearly smaller than those reached at −10 mV, even though ICa was very similar.
Figure 2. Voltage dependence of ICa and [Ca2+]i.
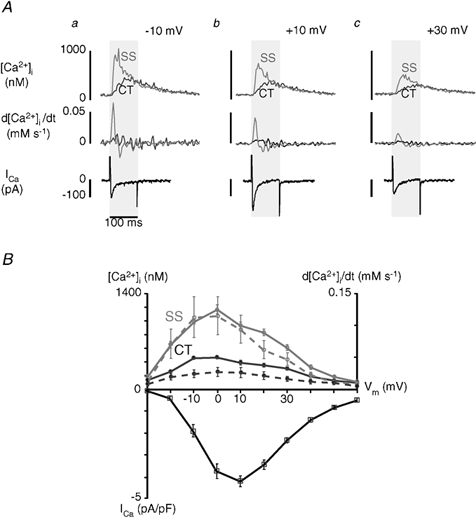
A, simultaneous measurements of local [Ca2+]i and ICa in a single voltage-clamped atrial myocyte. Cells were depolarized from a holding potential of −40 mV to test potentials as indicated (a-c). Pulse duration was 100 ms. Each test pulse was preceded by four conditioning pulses to +10 mV (100 ms, 0.83 Hz) to reproducibly load the SR with Ca2+. Upper and middle panels show subsarcolemmal (SS, grey traces) and central (CT, black traces) [Ca2+]i transients and d[Ca2+]i/dt, respectively. The bottom panel shows ICa for test potentials of −10 mV (a), +10 mV (b) and +30 mV (c). Local [Ca2+]i signals were measured as described for Fig. 1. B, top: voltage dependence of local [Ca2+]i transients (continuous lines) and d[Ca2+]i/dt (dashed lines). d[Ca2+]i and d[Ca2+]i/dt representing the SS space are shown in grey, whereas the black traces refer to the CT region. d[Ca2+]i/dt is taken as a measure of local Ca2+ release fluxes from j-SR and nj-SR. Bottom: voltage dependence of peak ICa (I-V curve). The data (□) represent mean ± s.e.m. obtained from eight myocytes. ICa was normalized to cell capacitance and is expressed as current density (pA pF−1).
The relationship between membrane potential (Vm) and SS and CT [Ca2+]I, as well as ICa, are summarized in Fig. 2B (means ± s.e.m., n = 8 myocytes). The average SS [Ca2+]i transient amplitudes (solid grey line) had a steep, bell-shaped dependence on Vm, reaching a maximum at 0 mV. The relationship between Vm and CT [Ca2+]i was similarly bell-shaped but was much shallower (solid black line). Although both SS [Ca2+]i and CT [Ca2+]i are similarly correlated with Vm, the magnitude of SS [Ca2+]i is substantially larger than CT [Ca2+]i. ICa exhibited the typical bell-shaped current-voltage relationship for influx through L-type voltage-dependent Ca2+ channels, with the maximum current at +10 mV. Taken together, these results demonstrate that while both SS and CT [Ca2+]i appear to be graded with the magnitude of Ca2+ influx, ICa is more effective at triggering release at negative potentials where the driving force for Ca2+ entry is high. The occurrence of maximum release at potentials more negative than the peak of Ca2+ influx has been demonstrated in ventricular myocytes (Cannell et al. 1987) as evidence of local control of SR Ca2+ release (Stern, 1992; Wier et al. 1994). In ventricular myocytes, this phenomenon has been interpreted to reflect the activation of individual release units of ryanodine receptors by a rapid increase in localized [Ca2+]i in the diadic cleft due to unitary Ca2+ current entry through a voltage-dependent L-type Ca2+ channel. The situation appears to be strikingly similar for the activation of Ca2+ release from j-SR in atrial myocytes. The much shallower apparent voltage dependence of the CT [Ca2+]i transient amplitude suggested that ICa had a less direct effect on Ca2+ release in this subregion of the myocyte.
The derivative of the [Ca2+]i transient (d[Ca2+]i/dt), a measure of Ca2+ release flux from the SR generating the cytosolic [Ca2+] transient, also had a pronounced bell-shaped dependence on membrane potential in both the SS and CT regions (dashed lines in Fig. 2B), similar to the [Ca2+]i transient amplitudes. The relationship between membrane voltage and d[Ca2+]i/dt had a broader peak, with the maximum at 0 mV, indicating that the highest rates of rise of [Ca2+]i occurred at potentials where the [Ca2+]i transient amplitudes were highest. Taken together these results support the idea that the local control model definitely applies to j-SR Ca2+ release in atrial cells, as it is closely related to membrane depolarization and subsequent Ca2+ influx. Although both SS [Ca2+]i and CT [Ca2+]i are correlated with ICa, the magnitude of SS [Ca2+]i is much larger than CT [Ca2+]i. This suggests that nj-SR Ca2+ release is governed by a mechanism that is not solely dependent upon, possibly even independent of, ICa. This question was specifically addressed in the following set of experiments.
Dependence of Ca2+ release from j-SR and nj-SR on ICa duration
It has been shown in ventricular myocytes (Cannell et al. 1987, 1995; Bers et al. 1990; Cleeman & Morad, 1991; Wier et al. 1994) that short depolarizing voltage pulses curtailed the [Ca2+]i transient by rapidly stopping Ca2+ influx and thus interrupting CICR from the SR. These findings confirmed the close link between membrane Ca2+ influx and RyR activation and were taken as strong evidence for local control of SR Ca2+ release in ventricular myocytes. We have applied similar experimental protocols to determine the effect of Ca2+ influx termination on subcellular [Ca2+]i transients in atrial myocytes, and to establish the specific role of ICa in activation of j-SR and nj-SR Ca2+ release.
We applied brief depolarizing voltage step pulses (as short as 2.5 ms) from a holding potential of −40 mV to +10 mV to elicit maximal inward current. All test pulses were preceded by a train of depolarizing pulses (100 ms) to load the SR reproducibly with Ca2+. The test pulse was terminated by either repolarizing the cell to the holding potential (-40 mV) or further depolarizing (+100 mV) beyond the reversal potential for Ca2+ and therefore abolishing the driving force for Ca2+ entry via ICa. Figure 3A shows the effect of application of 20 and 80 ms depolarizing pulses on [Ca2+]i transients in the same cell. During the 80 ms pulse (black traces in Fig. 3A), the SS [Ca2+]i transient peaked at a typical time of about 35 ms after the start of the depolarization and began to decline before the end of the pulse. In the same cell, application of a shorter 20 ms pulse (grey traces) terminated ICa during the rising phase of the [Ca2+]i transient. As a result, the rise of SS [Ca2+]i was stopped instantaneously and the [Ca2+]i transient began to decline as soon as the membrane was repolarized. This finding was very similar to the results found, but without spatial information, in the ventricle (Cannell et al. 1987, 1995; Bers et al. 1990; Cleeman & Morad, 1991; Wier et al. 1994), thus providing strong evidence for j-SR Ca2+ release activation by unitary Ca2+ entry through closely associated L-type Ca2+ channels, or ‘local’ control. In marked contrast the CT [Ca2+]i signal (bottom panel) continued to rise after repolarization (20 ms pulse) and was nearly indistinguishable from the transient elicited with the 80 ms pulse, suggesting a regenerative process of activation.
Figure 3. Effect of brief membrane depolarization on local SR Ca2+ release.
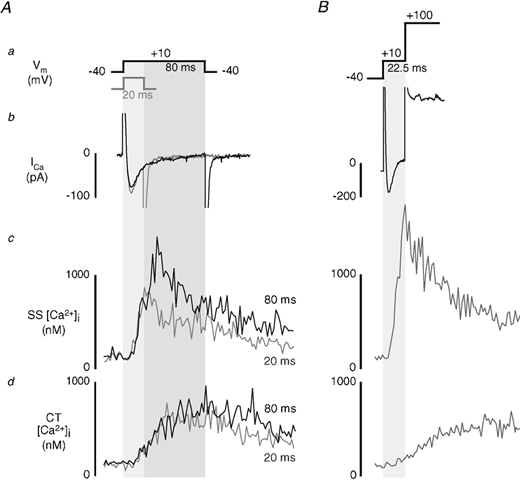
A, simultaneous measurements of ICa and subsarcolemmal (SS) and central (CT) [Ca2+]i transients during depolarizing pulses of 20 ms (grey traces) and 80 ms (black traces) to +10 mV from a holding potential of −40 mV. B, effect of brief (22.5 ms) voltage clamp pulse to +10 mV on SS and CT [Ca2+]i transients. Ca2+ entry via ICa was terminated by further depolarization of the membrane to +100 mV after application of the test pulse. Different cell than shown in A.
To exclude the possibility of triggering significant Ca2+ release by Ca2+ tail currents during repolarization (Barcenas-Ruis & Wier, 1987; Cannell et al. 1987; Beuckelmann & Wier, 1988), Ca2+ influx was also stopped by depolarizing the membrane potential to +100 mV (Fig. 3B). Further depolarization to +100 mV after a brief (22.5 ms) test pulse to +10 mV immediately terminated ICa. In addition, SS [Ca2+]i stopped rising as the membrane was depolarized to +100 mV, suggesting that release of Ca2+ from j-SR was stopped. Similar to the example utilizing repolarization, [Ca2+]i in the CT region developed more slowly and continued to rise after the pulse was terminated. Similar results where SS Ca2+ release but not CT Ca2+ release could be interrupted were obtained with test pulses between 2.5 and 25 ms (n = 21 myocytes). Control experiments showed that depolarization of the membrane potential to +100 mV without a preceding brief pulse to +10 mV did not result in an increase in [Ca2+]i, excluding the possibility of Ca2+ release due to ‘reverse’ mode sodium-calcium exchange Ca2+ entry (data not shown). In summary these data clearly show that SS Ca2+ release from j-SR is tightly controlled by Ca2+ entering via ICa, similar to ventricular cells. Strikingly, development of the CT [Ca2+]i transient is independent of pulse duration, ICa, and the truncation of j-SR Ca2+ release, providing compelling evidence for a regenerative, active release process in the nj-SR that is initiated by sufficient release from the j-SR.
While the above experiments established key features of j-SR and nj-SR Ca2+ release, we conducted additional experiments and analyses to elucidate the quantitative contribution of ICa to the atrial [Ca2+]i transient, and to characterize the kinetics and gain of Ca2+ release from j-SR and nj-SR, the role of NCX and altered cytoplasmic Ca2+ buffering capacity, and the spatial organization and activation kinetics of j-SR Ca2+ release sites.
Contribution of ICa to the [Ca2+]i transient
Ca2+ influx through L-type Ca2+ channels not only provides the signal for ryanodine receptor activation and j-SR Ca2+ release, but also contributes to the [Ca2+]i transient itself. To determine the contribution of Ca2+ influx to the total [Ca2+]i transient, cells were incubated (> 30 min) with ryanodine (Ry; 20 μm) and thapsigargin (Tg; 2 μm) to block Ca2+ release and reuptake into the SR. Figure 4A shows from top to bottom the voltage-clamp protocol (a), linescan image (b), SS (grey) and CT (black) [Ca2+]i transients (c), and whole-cell membrane current ICa (d) recorded from a Ry/Tg-treated atrial myocyte during whole-cell depolarization from −40 to +10 mV (100 ms). Ryanodine and thapsigargin abolished the major portion (90-95 %) of the [Ca2+]i transient observed in control experiments (Fig. 2B), both in the SS and CT regions of the cell. In the example shown the amplitudes of the remaining [Ca2+]i transients in the SS and CT regions were 95 nm and 70 nm above resting [Ca2+]i, respectively. The rising phase of the SS [Ca2+]i transient was slower than in the absence of Ry and Tg. The CT [Ca2+]i transient started later than the SS [Ca2+]i transient but [Ca2+]i rose at about the same rate. The SS [Ca2+]i transient started to decay immediately after the membrane was repolarized, with CT [Ca2+]i following with a small delay. The decay of [Ca2+]i in all regions of the cell was slowed, as reuptake of Ca2+ to the SR was blocked by thapsigargin and [Ca2+]i was lowered solely by extrusion from the cell.
Figure 4. Contribution of ICa to local [Ca2+]i signals during E-C coupling.
SR Ca2+ release and uptake were disabled in atrial myocytes by incubation with 20 μm ryanodine and 2 μm thapsigargin prior to voltage-clamp measurements. A, from top to bottom are shown the voltage-clamp protocol (a), the linescan image (b) of changes of [Ca2+]i during depolarization to +10 mV from a holding potential of −40 mV, subsarcolemmal (SS, grey) and central (CT, black) [Ca2+]i transients (c) and ICa (d). B, voltage dependence of CT and SS [Ca2+]i and ICa in the presence of ryanodine and thapsigargin. For comparison reasons SS and CT [Ca2+]i transients are drawn on the same scale as the control transients (shown in Fig. 2B).
The peak amplitude of ICa was not significantly different from ICa measured under control conditions (Ry + Tg: −3.11 ± 0.33 pA pF−1, n = 7 cells; control: −4.23 ± 0.25 pA pF−1, n = 8 cells, P > 0.2), suggesting that activation of L-type Ca2+ current was relatively unaffected. The time constant of inactivation of ICa at a test potential of +10 mV increased significantly (P < 0.002) from 12.9 ± 1.1 ms (control) to 26.4 ± 3.4 ms (Ry + Tg). This is consistent with the lower amplitude of the [Ca2+]i transient resulting in a reduction of Ca2+-dependent inactivation of ICa. The voltage dependences of ICa and the SS and CT [Ca2+]i transients after ryanodine and thapsigargin treatment are summarized in Fig. 4B. The voltage dependence of peak ICa was shifted slightly to the left, reaching a maximum at 0 mV. The relationship of [Ca2+]i in both the SS and CT regions to membrane potential was still slightly bell-shaped, reaching maximal levels in the range of −10 to +20 mV. Nonetheless, the essentially flat relationship between [Ca2+]i and membrane potential is in stark contrast to the relationship in the presence of a functional SR (Fig. 2B).
These results emphasize, once again, that the normal atrial [Ca2+]i transient is the result of active CICR from the j-SR and nj-SR, while in the presence of Ry and Tg the remaining [Ca2+]i signal reflects Ca2+ influx and simple diffusion throughout the cytoplasm.
Kinetic characteristics of local [Ca2+]i signals in atrial myocytes
Several aspects of the kinetic characteristics of Ca2+ release from j-SR and nj-SR in atrial myocytes were quantified (Fig. 5) to elucidate further differences in Ca2+ release in these two regions. The data were derived from the same data set as shown in Fig. 2 (n = 8 cells).
Figure 5. Kinetic characteristics of subcellular [Ca2+]i transients and SR Ca2+ release.
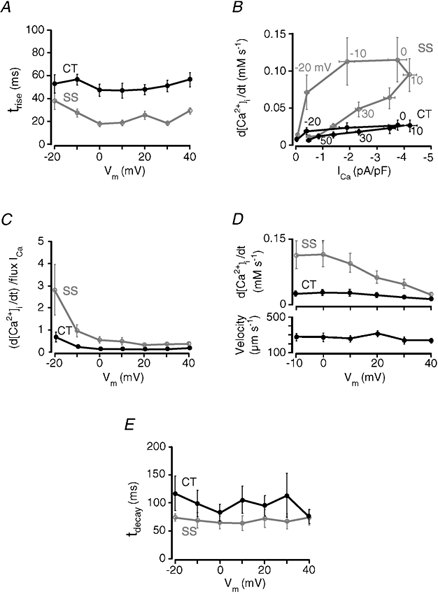
A, rate of rise of [Ca2+]i in subsarcolemmal (SS, grey trace) and central (CT, black trace) regions of atrial myocytes as a function of membrane potential. Rate of rise of [Ca2+]i is expressed by the time constant τ, calculated from a mono-exponential fit to the rising phase of the local [Ca2+]i transients. B, the first derivatives (d[Ca2+]i/dt) of SS and CT [Ca2+]i transients were plotted as a function of ICa density (pA pF−1). Individual data points represent average d[Ca2+]i/dt for a given test potential, as indicated. Vertical error bar: s.e.m. of d[Ca2+]i/dt at a particular test potential. Horizontal error bar: s.e.m. for ICa at a particular test potential. C, gain of SR Ca2+ release flux from j-SR (SS) and nj-SR (CT) as a function of membrane potential. Gain is expressed as the rate of change of SS and CT [Ca2+]i (d[Ca2+]i/dt), divided by the flux of Ca2+ ions entering via ICa (for details see text). D, propagation velocity of CICR from the cell periphery (j-SR) to the cell centre as a function of membrane potential (bottom). Velocity was measured from the linescan [Ca2+]i images where the line had been placed perpendicular to the longitudinal axis of the cell at a central axial focal plane. Top: average Ca2+ release flux (d[Ca2+]i/dt) from j-SR (SS) and nj-SR (CT) in relation to membrane voltage. E, rate of decline of [Ca2+]i in SS and CT regions of atrial myocytes as a function of membrane potential. Rate of decline of [Ca2+]i is expressed by the time constant τ, calculated from a mono-exponential fit to the decaying phase of the local [Ca2+]i transients. All data presented in panels A-E are from the same set of eight atrial myocytes shown in Fig. 2. All data points represent means ± s.e.m.
In Fig. 5A the time constant of a mono-exponential fit to the rising phase of the local [Ca2+]i transients (τrise) is plotted as a function of membrane potential. The voltage range of −20 to +40 mV was chosen because at these test potentials the [Ca2+]i levels were high enough to allow for a reliable fitting procedure. τrise was consistently faster in the SS region (grey trace; average τrise over entire voltage range: 24.2 ± 1.6 ms, n = 8 cells) than in the CT region (black trace; average τrise = 51.1 ± 2.1 ms, P < 0.005).
Figure 5B and C illustrates the gain of Ca2+ release from the j-SR and the nj-SR, i.e. the degree of amplification of trigger signal (Ca2+ entry via ICa) by the amount of Ca2+ released from the SR. In Fig. 5B Ca2+ release flux (expressed as the first derivative of the local [Ca2+]i transients, d[Ca2+]i/dt) is plotted as a function of L-type Ca2+ current density (ICa/membrane capacity; pA pF−1). The figure shows that SS Ca2+ release flux is not only substantially larger than CT Ca2+ release flux (see also Fig. 2B) but clearly is more influenced by the triggering membrane current. The figure also shows that for more negative test potentials (-10 to −20 mV) a much smaller current is capable of eliciting similar Ca2+ release fluxes (cf. 0 and +10 mV test potentials). Alternatively, the same macroscopic ICa is more effective at triggering release at negative potentials where the unitary iCa is high due to the large driving force for Ca2+ entry, which leads to a large local increase of [Ca2+]i, even though the Po of the L-type Ca2+ channel is low (e.g. Rose et al. 1992). For SR Ca2+ release from nj-SR the dependence of release flux on membrane current is shallow and much less influenced by membrane potential. Thus, the gain of SR Ca2+ release is highest in SS regions at membrane potentials between −20 and −10 mV, i.e. where unitary currents through DHPRs are largest and not the macroscopic ICa (Fig. 2B).
Figure 5C shows the gain of j-SR and nj-SR Ca2+ release as a function of membrane potential. Gain in this case was calculated for both SR regions as the ratio of release flux d[Ca2+]i/dt divided by Ca2+ flux attributable to ICa (see Sipido & Wier, 1991). Gain was always higher at more negative potentials, a phenomenon which was most pronounced in the SS space. Here the relationship between release flux and Ca2+ influx was steepest at negative potentials from −20 to −10 mV and then progressively declined over the membrane potential range from −10 mV to +40 mV, a situation reminiscent of ventricular myocytes (Wier et al. 1994). Although their voltage dependence was similar, SS gain was much higher than CT for all voltages, with the greatest difference at negative potentials, again reflecting the close relationship of the j-SR Ca2+ release to ICa.
In Figure 5D, the velocity of propagation of the rise of [Ca2+]i from the edge (SS space) to the centre of the cell is illustrated as a function of membrane potential (bottom) and compared with the j-SR and nj-SR Ca2+ release fluxes (top). Velocity was nearly constant over the voltage range for which velocities could be measured reliably (-10 to +40 mV). The average propagation velocity over all voltages was 269 ± 15 μm s−1. Over the same voltage range there was a five-fold decline of the j-SR Ca2+ release flux (d[Ca2+]i/dt) from its maximum at −10 mV to the minimum at +40 mV. In comparison, in Ry/Tg-treated cells (Fig. 4), where [Ca2+]i rose by diffusion only the apparent ‘propagation velocity’ was much slower (161 ± 42 μm s−1). This result again supports the idea that, although the rate and amplitude of Ca2+ release are graded to voltage-dependent Ca2+ influx, the process of activation of successive release sites from the periphery to the centre of the cell becomes largely independent of the magnitude of initial j-SR Ca2+ release. Once j-SR Ca2+ release is of sufficient magnitude to support activation of adjacent release sites, CICR from nj-SR proceeds inward at constant velocity, independent of membrane potential and SS Ca2+ release flux.
Quantitative analysis of the decline kinetics of the local [Ca2+]i transients revealed that the average time constant of decay of the [Ca2+]i transients (τdecay) was faster for j-SR Ca2+ release than for nj-SR release (Fig. 5E) and was rather independent of test potentials. On average τdecay was 69.6 ± 4.9 ms in the SS space and 98.8 ± 9.0 ms in the CT region (n = 8 cells). The differences between the SS and CT regions are probably due to the lack of Ca2+ extrusion mechanisms in the centre of the cell where lowering of [Ca2+]i occurs through sequestration of Ca2+ into the SR.
Contribution of Na+-Ca2+ exchange to subcellular E-C coupling
During E-C coupling, the decline of the [Ca2+]i transient results from reuptake of Ca2+ into the SR and extrusion across the cell membrane. In cardiac myocytes the latter occurs mainly via sarcolemmal NCX. Therefore we tested the effects of partial and complete inhibition of NCX on E-C coupling and action potential-induced [Ca2+]i transients originating from j-SR and nj-SR. Inhibition of NCX was achieved by reducing or removing extracellular sodium. The effect on [Ca2+]i transients was expected to be greater in the SS region (grey traces) than in the CT region (black traces) due to proximity of the NCX to the sarcolemma. All extracellular solutions contained 2 mm Ca2+. Cells were allowed to equilibrate at rest for 4 min after application of each test solution with reduced or no Na+. After 4 min, electrical stimulation resumed and [Ca2+]i was recorded after the amplitude of the [Ca2+]i transient had reached a steady state (typically after 8-10 beats). Between exposures to reduced [Na+]o, cells were stimulated for at least 2 min in normal Tyrode solution ([Na+]o = 140 mm). Figure 6a shows subcellular steady-state [Ca2+]i transients (represented as F/F0) and the corresponding linescan image under control conditions ([Na+]o = 140 mm). Subsequently the same cell was exposed to a solution in which [Na+]o was reduced by 67.5 mm and replaced by the same amount of Li+ (Fig. 6B). In lowered [Na+]o the peak of the [Ca2+]i transients became broader in both subcellular regions. The amplitude of both [Ca2+]i transients increased as compared with control conditions, but the differences were not statistically different (see panel D). The increase of the transient amplitude was more pronounced in the SS than in the CT region. When extracellular Na+ was completely substituted with Li+ (panel C) resting [Ca2+]i increased, the subcellular [Ca2+]i transients lengthened further, and the SS and CT [Ca2+]i transient amplitudes increased significantly. These results are summarized in Fig. 6D, showing the average SS (grey bars) and CT (black bars) [Ca2+]i transient amplitudes (F/F0) under control conditions ([Na+]o = 140 mm; n = 26), reduced [Na+]o ([Na+]o = 72.5 mm, [Li+]o = 67.5 mm, n = 10), and [Na+]o = 0 ([Li+]o = 140 mm, n = 8). There were no statistically significant differences in the [Ca2+]i transient amplitudes when [Na+]o was partially substituted with Li+ (average values ± s.e.m.: SS, F/F0 = 6.26 ± 0.79; CT, F/F0 = 5.20 ± 0.58) compared with control (SS, F/F0 = 5.32 ± 0.43, P > 0.25; CT, F/F0 = 4.56 ± 0.32, P > 0.25). However, when [Na+]o was completely substituted with 140 mm Li+, [Ca2+]i increased significantly in both the SS space (F/F0 = 8.81 ± 1.22; P < 0.01) and the CT space (F/F0 = 6.86 ± 0.80; P < 0.01) compared with control conditions. The effects of removal of extracellular Na+ on [Ca2+]i were reversible. Furthermore, the reduction of extracellular Na+ also caused a shortening of the delay between peripheral and central rise of [Ca2+]i reaching a minimum in the complete absence of extracellular Na+.
Figure 6. Effect of reduced extracellular [Na+] on subcellular [Ca2+]i signals.
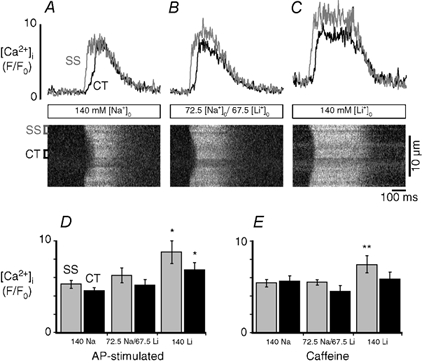
Local [Ca2+]i transients (top) and linescan images (bottom) recorded in different [Na+]o. Action potential-induced [Ca2+]i transients were elicited by electrical field stimulation with 2 ms voltage pulses of suprathreshold amplitude applied through parallel platinum bath electrodes. A, [Ca2+]i transients under control conditions ([Na+]o = 140 mm) (SS, grey traces; CT, black traces). B, the same cell was stimulated in reduced [Na+]o (72.5 mm) and in the absence of extracellular sodium (C). Na+ was replaced by Li+ in equimolar amounts. [Ca2+]o = 2 mm. The amplitudes of the action potential-induced [Ca2+]i transients are summarized for each condition in D. E shows the amplitudes of [Ca2+]i transients stimulated by 10 mm caffeine. Statistical significance: *P < 0.01; **P < 0.05.
We also explored the possibility that inhibition of Ca2+ extrusion could lead to an increased Ca2+ content of the SR and through this mechanism could contribute to the observed higher [Ca2+]i transient amplitudes. To evaluate this possibility, SR Ca2+ load was assessed by rapid application of 10 mm caffeine. Caffeine was applied under identical conditions as the [Ca2+]i transients shown in Fig. 6A-C were recorded. Figure 6E shows the average caffeine-induced [Ca2+]i transient amplitudes recorded in the SS and CT space. There was no statistically significant change in the caffeine-induced [Ca2+]i transient amplitude when Na+ was partially substituted with Li+ ([Na+]o = 72.5 mm, [Li+]o = 67.5 mm; SS, F/F0 = 5.50 ± 0.58; CT, F/F0 = 4.50 ± 0.42; n = 4) compared with control ([Na+]o = 140 mm; SS, F/F0 = 5.41 ± 0.40; CT, F/F0 = 5.61 ± 0.58; P > 0.2; n = 9). When Na+ was completely substituted with Li+ ([Li+]o = 140 mm), however, the caffeine-induced [Ca2+]i transient increased significantly in the SS space (SS, F/F0 = 7.39 ± 0.19, P < 0.05 compared with control; n = 4) but not in the CT region (F/F0 = 5.84 ± 0.44; P > 0.2). Together, these data suggest that partial inhibition of plasmalemmal NCX and cytosolic Ca2+ extrusion had a relatively small effect on E-C coupling in atrial myocytes, which consisted of a larger peripheral elevation of [Ca2+]i resulting in a higher trigger signal for Ca2+ release from j-SR and an increased Ca2+ gradient directed towards the centre of the cell. Full inhibition of NCX enhanced peripheral j-SR Ca2+ release even further through an additional mechanism, i.e. through increased loading of the j-SR with Ca2+.
Effect of intracellular Ca2+ buffering on Ca2+ release from nj-SR
If propagation of CICR to the central regions of the cell is mediated by diffusion of Ca2+ from peripheral Ca2+ release sites to nj-SR release sites, it follows that inhibition of Ca2+ diffusion by increasing cytoplasmic Ca2+ buffering capacity would prevent propagating CICR and the spread of release. Figure 7 illustrates the effect of increasing cytosolic Ca2+ buffering on intracellular Ca2+ release. Voltage-clamped atrial myocytes were internally perfused with 1 mm of the Ca2+ buffer EGTA (free [Ca2+]i ≈100 nm) through the patch pipette. As shown in Fig. 7A, upon depolarization to 0 mV from a holding potential of −40 mV (Fig. 7Aa) ICa (Fig. 7Ab) was evoked and a distinct [Ca2+]i transient was elicited in the SS region (Fig. 7Ad), appearing as bright regions at the edges of the transverse linescan image (Fig. 7Ac). This increase was attributable to Ca2+ release from the j-SR, as it was virtually abolished by treatment with 20 μm ryanodine and 2 μm thapsigargin (Fig. 7B). In contrast to control conditions (cf. Fig. 1), there was no evidence for Ca2+ release propagation to the centre of the cell, nor was isolated Ca2+ release from nj-SR ever observed in the absence of propagating CICR. Application of caffeine under these conditions, however, caused release from nj-SR (data not shown), indicating that the inability of membrane depolarization to trigger Ca2+ release in the CT region was not due to depletion of the nj-SR. ICa inactivation was slower in the presence of Ry and Tg due to the absence of j-SR Ca2+ release and reduced Ca2+-dependent inactivation of ICa. Figure 7Ad and Bd shows local [Ca2+]i traces averaged over 1.5 μm in the SS (grey) and CT (black) regions, with and without Ry and Tg present. The results are summarized in Fig. 7Ae and Be. The average amplitude of the local [Ca2+]i transients following perfusion with EGTA were 410 ± 51 nm in the SS region and 137 ± 9 nm in the CT region (n = 6). After exposure to Ry and Tg, the average SS [Ca2+]i transient peaked at 138 ± 3 (nm), whereas CT [Ca2+]i rose on average only to 106 ± 1 nm (n = 3). These results further support the idea that Ca2+ release from the nj-SR is not directly activated by ICa, but rather requires a sufficient increase of [Ca2+]i in the SS space, followed by diffusion-mediated propagation of release from nj-SR.
Figure 7. Effect of cytosolic Ca2+ buffering on Ca2+ release from j-SR and nj-SR.
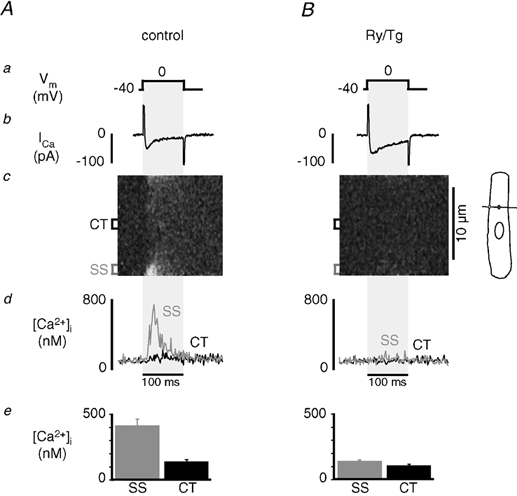
A, effect of enhanced cytosolic Ca2+ buffering on [Ca2+]i. Shown are from top to bottom the depolarization protocol (a), ICa (b), linescan image (transverse linescan orientation) of intracellular [Ca2+]i (c), SS (grey trace) and CT (black trace) [Ca2+]i transients (d) and average amplitudes of peak subcellular [Ca2+]i (e). Voltage-clamped atrial myocyte internally perfused with 1 mm of the mobile Ca2+ buffer EGTA. Intracellular free [Ca2+]i set to ≈100 nm. Ca2+ release was triggered by membrane depolarization from −40 mV to 0 mV for 100 ms. B, same cell as in A after bath application of 20 μm ryanodine and 2 μm thapsigargin.
Beat-to-beat variations in the order of activation of j-SR Ca2+ release sites
More detailed information on the activation pattern of j-SR release sites was obtained from successive linescan images from the SS space. For this purpose the scanning line was positioned parallel to the longitudinal axis of the cell immediately beneath the sarcolemma (Fig. 8). Myocytes were whole-cell voltage-clamped with 1 mm EGTA and 100 nm free [Ca2+] in the pipette solution. The cells were stimulated repetitively (0.625 Hz) with 100 ms depolarizing pulses from a holding potential of −40 mV to −20 mV. Figure 8Aa-d shows four consecutive [Ca2+]i images revealing individual j-SR Ca2+ release sites. Release sites were identified as regions with circumscribed peaks of high [Ca2+]i surrounded by ‘valleys’ of low [Ca2+]i during depolarizations. Release of Ca2+ was found at stable locations, four of which are indicated by the blue, black, red and green boxes to the left of panel a. The distance between individual sites was ≈2 μm or multiples thereof (in four myocytes a total of 51 release sites were analysed; the average distance between neighbouring sites was 1.95 ± 0.07 μm). Figure 8B illustrates the spatial profile of Ca2+ release averaged over the first 25 ms of the depolarization pulse. The coloured arrows mark the position of the regions of the linescan image shown by the coloured boxes in Fig. 8A. It is clear that different sites activate first following each successive depolarization. For example, in profile a, the black region peaks first, but in profile b the red region peaks first closely followed by the blue region. This is illustrated in a different way in Fig. 8C, which shows the normalized time integrals of [Ca2+]i averaged over the 1 μm regions of interest marked by the coloured boxes in Fig. 8A for each of the four images, a-d. In Fig. 8Ca, the black trace rises first with a steep slope indicating a high amplitude of Ca2+ release. The blue trace, which is initially low, eventually rises to approximately the same level with a delay of about 20 ms. Panel b shows that the blue and red traces both rise first indicating that the blue and red sites released Ca2+ early during the pulse, consistent with the [Ca2+]i profile in Fig. 8Bb. Figure 8Cc shows that release from the black region preceded all other release sites. Finally, in Fig. 8Cd, Ca2+ release is lower overall (cf. Fig. 8Ad) and release from the red site, which was leading in panel b, is clearly lagging behind. Taken together the data show that in cat atrial myocytes, Ca2+ release from j-SR occurred at specific sites whose locations were stable during consecutive beats. Their order of activation, the latency of release and the amount of Ca2+ released at an individual site, however, showed pronounced beat-to-beat variability (n = 13 myocytes). There was no evidence of ‘eager’ release sites (Mackenzie et al. 2001; see Discussion) consistently activated early during the pulse.
In summary, we have established that the release of Ca2+ from j-SR in cat atrial myocytes is consistent with the hypothesis of control by a local increase in [Ca2+]i due to unitary Ca2+ influx through closely associated voltage-dependent Ca2+ channels. Subsarcolemmal Ca2+ release flux correlated strongly with voltage-dependent changes in Ca2+ current and could be immediately terminated by interrupting ICa. Ca2+ release from nj-SR, however, appears to be regulated in a different manner. Non-junctional-SR Ca2+ release continued when ICa was interrupted and could be abolished by increased intracellular buffering, indicating that the increase in [Ca2+]i required for activation of nj-SR RyRs is provided by Ca2+ diffusion from neighbouring release sites and propagating CICR, with no evidence of direct activation by ICa.
Discussion
In this study we have quantified the spatially resolved characteristics of CICR during E-C coupling in cat atrial myocytes in terms of their dependence on membrane voltage and ICa. With combined voltage-clamp and [Ca2+]i imaging experiments we demonstrated that only j-SR Ca2+ release is under direct control of Ca2+ influx through L-type Ca2+ channels in accordance with the local control model (Stern, 1992; Rios & Stern, 1997). Furthermore, this is the first direct demonstration that the CT [Ca2+]i transient is due to active Ca2+ release from nj-SR and not simple diffusion. Non-junctional-SR Ca2+ release is not triggered directly by Ca2+ influx, but requires j-SR Ca2+ release in the subsarcolemmal space and transverse propagation of CICR into the cell interior. The latter mechanism of E-C coupling differs from E-C coupling in ventricular myocytes and is reminiscent of regenerative propagating Ca2+ waves (for references see Wier & Blatter, 1991).
Subcellular features of Ca2+ signalling in atrial myocytes: evidence for direct control of j-SR Ca2+ release by ICa
Confocal microscopy revealed that the [Ca2+]i transient during E-C coupling is spatially relatively uniform in ventricular myocytes (Cheng et al. 1993; Berlin, 1995; Hüser et al. 2000b; Blatter et al. 2002; but see also Cannell et al. 1994; Lopez-Lopez et al. 1994; Cheng et al. 1995), whereas in atrial cells distinct intracellular gradients of [Ca2+]i release were observed (Berlin, 1995; Hüser et al. 1996; Hatem et al. 1997; Kockskämper et al. 2001; Mackenzie et al. 2001; Tanaka et al. 2001; Blatter et al. 2002, 2003; Woo et al. 2002; see also Fig. 1 this study), suggesting fundamental subcellular differences in Ca2+ signalling. The spatially homogeneous Ca2+ release from the SR in ventricular cells is due to the close proximity of DHPRs and RyRs throughout the entire cell (Lewis Carl et al. 1995; Scriven et al. 2000). It has been shown that SR Ca2+ release units (composed of clusters of RyRs) are activated by unitary Ca2+ influx current (iCa). The temporal and spatial summation of Ca2+ release from individual release units shapes the intracellular [Ca2+]i transient during E-C coupling (Lopez-Lopez et al. 1994; Cannell et al. 1994, 1995; Cheng et al. 1995, 1996). Because of the distinct voltage dependence, most trigger Ca2+ enters via L-type Ca2+ channels, although a small contribution from T-type Ca2+ currents (Sipido et al. 1998; Zhou & January, 1998) cannot be excluded for negative membrane potentials. Such a mechanism has been demonstrated in atrial pacemaker cells (Hüser et al. 2000a). In the experiments shown here the contribution is likely to be very small because cells were depolarized from a holding potential of −40 mV, where most T-type Ca2+ channels are inactivated.
The intracellular [Ca2+]i inhomogeneities and gradients during E-C coupling in atrial myocytes are attributable to their specific subcellular morphology. Atrial myocytes of different species possess only a very rudimentary t-tubular system or are completely devoid of it (e.g. McNutt & Fawcett, 1969). Previous studies in this laboratory have shown that cat atrial myocytes lack t-tubules (Hüser et al. 1996), but contain RyRs in both the j-SR and nj-SR (Kockskämper et al. 2001). By combining confocal linescan imaging of [Ca2+]i with whole-cell current recordings we have established evidence, with spatial resolution, defining the characteristics and supporting the proposed mechanisms of j-SR (SS region) and nj-SR (CT region) Ca2+ release.
A definitive way to establish the control of j-SR Ca2+ release by plasma membrane Ca2+ influx was to test the effects of terminating Ca2+ influx on Ca2+ release. Ca2+ release in the SS region could be stopped immediately (Fig. 3A and B) by either repolarizing the membrane (i.e. deactivation of ICa), or by further depolarizing it to +100 mV, which abolished the driving force for Ca2+ entry via ICa and the possibility of prolonging Ca2+ release by Ca2+ tail currents (Barcenas-Ruiz & Wier, 1987; Cannell et al. 1987; Beuckelmann & Wier, 1988). This result is very similar to earlier findings in ventricular myocytes (Cleeman & Morad, 1991; Wier et al. 1994; Cannell et al. 1995; but see also earlier work by Cannell et al. 1987; Bers et al. 1990) where it has been interpreted as strong experimental evidence for local control of Ca2+ release. Thus, the ‘classical’ local control model, where a small amount of Ca2+ influx through sarcolemmal Ca2+ channels triggers release from individual Ca2+ release units (clusters of RyRs), is sufficient to explain the mechanism of SR Ca2+ release from j-SR in atrial myocytes. Propagation of Ca2+ release from j-SR towards the CT region, however, was unaffected by early termination of Ca2+ influx once propagation had begun, proceeding independently of membrane depolarization and j-SR Ca2+ release. Further evidence that the CT [Ca2+]i transient in these experiments (Fig. 3B) is not due to simple Ca2+ diffusion from the periphery is drawn from the fact that the propagation velocity was essentially the same (245 μm s−1 in the example shown) as the average propagation velocity under control conditions (Fig. 5D) and about twice as fast when CT [Ca2+]i rose by diffusion alone (Ry/Tg experiments, Fig. 2). Taken together this clearly demonstrates the presence of active, regenerative release from nj-SR in the centre of the atrial cells.
Additional support for separate SS and CT Ca2+ release mechanisms was revealed by their relationship to the amplitude of the membrane current. From ventricular muscle it is known that the gain of SR Ca2+ release is variable (Wier et al. 1994), i.e. the amplification of Ca2+ release flux in relation to membrane current flux is highest at negative potentials and declines as the test potential becomes more positive. In atrial myocytes the gain of Ca2+ release from j-SR showed a behaviour similar to that of ventricular myocytes. Ca2+ release flux was steeply dependent on ICa (Fig. 5B) and showed a marked hysteresis, indicating that at negative potentials ICa is more effective in eliciting release than the same magnitude of current at positive potentials. The gain of j-SR Ca2+ release (Fig. 5C) was consistently highest at negative potentials (-20 mV), and decreased at more positive potentials. Ca2+ release flux from nj-SR was nearly the same for all ICa, and the gain of release, while slightly higher at −20 mV, was much less dependent on membrane potential. These differences strongly suggest that Ca2+ release from the two types of SR, although both are activated by CICR, relied on very different sources of trigger Ca2+. The data also suggest that a tight functional link between j-SR and the sarcolemma is essential for both the initial release of Ca2+ from j-SR and the subsequent propagation of activity through nj-SR release sites.
Perfusion of the atrial myocytes with 1 mm EGTA through the patch pipette allowed visualization of individual Ca2+ release sites along the SS space, similar to those observed during action potential-induced [Ca2+]i transients in the same tissue (Kockskämper et al. 2001). These sites were spaced in a sarcomeric fashion, presumably representing clusters of RyRs that are in close proximity to the sarcolemma and DHPRs. The order of activation (i.e. the latency of SR Ca2+ release in relation to membrane depolarization) of individual sites varied significantly during consecutive electrical stimulations, suggesting that Ca2+ release from these sites was triggered by stochastic openings of sarcolemmal DHPRs. In addition, the amplitude of Ca2+ release also revealed a substantial beat-to-beat variability. This pattern of activation order is in contrast to the situation in rat atrial myocytes (Mackenzie et al. 2001), which showed distinct ‘eager’ j-SR Ca2+ release sites that consistently activated in reproducible order. In rat atrial myocytes, ‘eager’ sites showed a [Ca2+]i increase early on upon stimulation and had the highest frequencies of spontaneous Ca2+ sparks. Based on these observations the authors speculated that the strict activation sequence of the subsarcolemmal ‘eager’ release sites may be due to a higher intrinsic Ca2+ sensitivity of those sites and their close coupling to adjacent DHPRs (Mackenzie et al. 2001).
Mechanism of Ca2+ release from the nj-SR
There is a striking similarity between Ca2+ release from nj-SR in atrial cells and propagating Ca2+ waves that have been observed in cardiac cells under conditions of SR Ca2+ overload, including cat atrial myocytes (unpublished observations). Such Ca2+ waves typically originate at one or more locations in the cell, are repetitive and propagate at a constant velocity. Propagation velocity of CICR in atrial cells during normal E-C coupling was also found to be relatively constant over the range of membrane potentials tested (Fig. 5D) and independent of the amplitude of the [Ca2+]i transient, but was faster than Ca2+ waves in ventricular myocytes under SR Ca2+ overload conditions (e.g. Takamatsu & Wier, 1990).
In atrial myocytes during normal E-C coupling, nj-SR Ca2+ release is relatively insensitive towards variability in duration and magnitude of SS Ca2+ release and propagates reliably and independently of SS [Ca2+]i once it has been initiated. The highly regenerative nature of Ca2+ release from nj-SR thus assures stability and fidelity of atrial contraction. The initiation of nj-SR Ca2+ release, however, occurred only and exclusively after Ca2+ release from j-SR. This absolute requirement of peripheral Ca2+ release ensures that under physiological conditions atrial contraction is still controlled by membrane voltage and action potential-induced depolarization. When diffusion of Ca2+ from j-SR release sites towards the nj-SR was blocked by the use of the mobile cytosolic Ca2+ buffer EGTA internally perfused through the patch electrode (Fig. 7), ICa was capable of triggering release in the restricted space of the j-SR peripheral couplings but was unable to activate release in the neighbouring nj-SR.
This is in contrast to recent findings in rat atrial myocytes. Under normal Ca2+ loading conditions of the SR RyRs of the nj-SR are not or only weakly activated during E-C coupling unless nj-SR Ca2+ load is increased (Mackenzie et al. 2001). Furthermore, rat atrial myocytes have been shown to exhibit both a fast and a slow component of central Ca2+ release, which are differentially regulated by ICa (Woo et al. 2002). The specific mechanism, however, through which this fast component of Ca2+ release from nj-SR is regulated by ICa remains elusive. In addition, in rat atrial myocytes, curtailing ICa also reduces SR Ca2+ release (Woo et al. 2002), but does not cause the abrupt stop of SS Ca2+ release observed in cat atrial cells (Fig. 3). In contrast to rat myocytes, in cat atria SS Ca2+ release appears to be the sole trigger signal for the activation of Ca2+ release from the nj-SR during E-C coupling.
Conclusion
In cat atrial myocytes two forms of CICR co-exist during normal E-C coupling. Ca2+ release is initiated first from j-SR located in the subsarcolemmal region of the cell. This Ca2+ release is triggered by Ca2+ influx (ICa) through L-type Ca2+ channels and shows all the key features of local control as described for E-C coupling in ventricular myocytes. In contrast, Ca2+ release from nj-SR is not initiated directly by ICa, but instead requires a substantial elevation of [Ca2+]i in the SS space, proceeds once initiated with little dependence on membrane Ca2+ influx (or the continuation of j-SR release) via propagating CICR and can be abolished by buffering the rise in [Ca2+]i needed to maintain the diffusional gradient for propagation. Propagation of CICR from nj-SR behaves in a regenerative fashion and is reminiscent of Ca2+ waves observed in ventricular cells under Ca2+ overload conditions. In this way, in the atria, the signal for Ca2+ release and subsequent contraction is transmitted reliably from the sarcolemma through the myocyte in the absence of t-tubules.
Acknowledgments
We thank Drs D. M. Bers, J. Kockskämper, S. L. Lipsius and K. R. Sipido for critically reading the manuscript. The expert technical assistance of Rachel L. Gulling and Holly R. Gray is gratefully acknowledged. This work was supported by grants from the NIH (HL51941, HL62231) and the AHA (95002520). K.A.S. was supported by an Arthur J. Schmitt Dissertation Fellowship (Loyola University Chicago) and a Lilly Graduate Student Fellowship in Cardiovascular Research (Loyola University Chicago & Eli Lilly and Company, Indianapolis).
References
- Barcenas-Ruiz L, Wier WG. Voltage dependence of intracellular [Ca2+]i transients in guinea pig ventricular myocytes. Circ Res. 1987;61:148–154. doi: 10.1161/01.res.61.1.148. [DOI] [PubMed] [Google Scholar]
- Berlin JR. Spatiotemporal changes of Ca2+ during electrically evoked contractions in atrial and ventricular cells. Am J Physiol. 1995;269:H1165–1170. doi: 10.1152/ajpheart.1995.269.3.H1165. [DOI] [PubMed] [Google Scholar]
- Bers DM. Excitation-Contraction Coupling and Cardiac Contractile Force. 2. Dordrecht, The Netherlands: Kluwer Academic Publishers Group; 2001. [Google Scholar]
- Bers DM, Lederer WJ, Berlin JR. Intracellular Ca transients in rat cardiac myocytes: role of Na-Ca exchange in excitation-contraction coupling. Am J Physiol. 1990;258:C944–954. doi: 10.1152/ajpcell.1990.258.5.C944. [DOI] [PubMed] [Google Scholar]
- Beuckelmann DJ, Wier WG. Mechanism of release of calcium from sarcoplasmic reticulum of guinea-pig cardiac cells. J Physiol. 1988;405:233–255. doi: 10.1113/jphysiol.1988.sp017331. [DOI] [PMC free article] [PubMed] [Google Scholar]
- Blatter LA, Hüser J, Rios E. Sarcoplasmic reticulum Ca2+ release flux underlying Ca2+ sparks in cardiac muscle. Proc Natl Acad Sci USA. 1997;94:4176–4181. doi: 10.1073/pnas.94.8.4176. [DOI] [PMC free article] [PubMed] [Google Scholar]
- Blatter LA, Kockskämper J, Sheehan KA, Zima AV, Hüser J, Lipsius SL. Local calcium gradients during excitation-contraction coupling and alternans in atrial myocytes. J Physiol. 2003;546:19–31. doi: 10.1113/jphysiol.2002.025239. [DOI] [PMC free article] [PubMed] [Google Scholar]
- Blatter LA, Sheehan KA, Kockskämper J. Subcellular calcium signalling in cardiac cells revealed with fast two-dimensional confocal imaging. Proc SPI E. 2002;4626:453–463. [Google Scholar]
- Bridge JH, Ershler PR, Cannell MB. Properties of Ca2+ sparks evoked by action potentials in mouse ventricular myocytes. J Physiol. 1999;518:469–478. doi: 10.1111/j.1469-7793.1999.0469p.x. [DOI] [PMC free article] [PubMed] [Google Scholar]
- Callewaert G. Excitation-contraction coupling in mammalian cardiac cells. Cardiovasc Res. 1992;26:923–932. doi: 10.1093/cvr/26.10.923. [DOI] [PubMed] [Google Scholar]
- Callewaert G, Cleeman L, Morad M. Epinephrine enhances Ca2+ current-regulated Ca2+ release and Ca2+ reuptake in rat ventricular myocytes. Proc Natl Acad Sci USA. 1988;85:2009–2013. doi: 10.1073/pnas.85.6.2009. [DOI] [PMC free article] [PubMed] [Google Scholar]
- Cannell MB, Berlin JR, Lederer WJ. Effect of membrane potential changes on the calcium transient in single rat cardiac muscle cells. Science. 1987;238:1419–1423. doi: 10.1126/science.2446391. [DOI] [PubMed] [Google Scholar]
- Cannell MB, Cheng H, Lederer WJ. Spatial non-uniformities in [Ca2+] during excitation-contraction coupling in cardiac myocytes. Biophys J. 1994;67:1942–1956. doi: 10.1016/S0006-3495(94)80677-0. [DOI] [PMC free article] [PubMed] [Google Scholar]
- Cannell MB, Cheng H, Lederer WJ. The control of calcium release in heart muscle. Science. 1995;268:1045–1049. doi: 10.1126/science.7754384. [DOI] [PubMed] [Google Scholar]
- Cheng H, Cannell MB, Lederer WJ. Propagation of excitation-contraction coupling into ventricular myocytes. Pflügers Arch. 1994;428:415–417. doi: 10.1007/BF00724526. [DOI] [PubMed] [Google Scholar]
- Cheng H, Cannell MB, Lederer WJ. Partial inhibition of Ca2+ current by methoxyverapamil (D600) reveals spatial nonuniformities in [Ca2+]i during excitation-contraction coupling in cardiac myocytes. Circ Res. 1995;76:236–241. doi: 10.1161/01.res.76.2.236. [DOI] [PubMed] [Google Scholar]
- Cheng H, Lederer WJ, Cannell MB. Calcium sparks: elementary events underlying excitation-contraction coupling in heart muscle. Science. 1993;262:740–744. doi: 10.1126/science.8235594. [DOI] [PubMed] [Google Scholar]
- Cheng H, Lederer WJ, Cannell MB. Calcium sparks and [Ca2+]i waves in cardiac myocytes. Am J Physiol. 1996;270:C148–159. doi: 10.1152/ajpcell.1996.270.1.C148. [DOI] [PubMed] [Google Scholar]
- Cleeman L, Morad M. Analysis of role of Ca2+ in cardiac excitation-contraction coupling: Evidence from simultaneous measurements of intracellular Ca2+ contraction and Ca2+ current. J Physiol. 1991;432:283–312. doi: 10.1113/jphysiol.1991.sp018385. [DOI] [PMC free article] [PubMed] [Google Scholar]
- Collier ML, Thomas AP, Berlin JR. Relationship between L-type Ca2+ current and unitary sarcoplasmic reticulum Ca2+ release events in rat ventricular myocytes. J Physiol. 1999;516:117–128. doi: 10.1111/j.1469-7793.1999.117aa.x. [DOI] [PMC free article] [PubMed] [Google Scholar]
- Dubell WH, Houser SR. Voltage and beat dependence of Ca2+ transient in feline ventricular myocytes. Am J Physiol. 1989;257:H746–759. doi: 10.1152/ajpheart.1989.257.3.H746. [DOI] [PubMed] [Google Scholar]
- Fabiato A. Calcium-induced release of calcium from the cardiac sarcoplasmic reticulum. Am J Physiol. 1983;245:C1–14. doi: 10.1152/ajpcell.1983.245.1.C1. [DOI] [PubMed] [Google Scholar]
- Hamill OP, Marty A, Neher E, Sakmann B, Sigworth FJ. Improved patch-clamp techniques for high-resolution current recording from cells and cell-free membrane patches. Pflügers Arch. 1981;391:85–100. doi: 10.1007/BF00656997. [DOI] [PubMed] [Google Scholar]
- Harkins AB, Kurebayashi N, Baylor SM. Resting myoplasmic free calcium in frog skeletal muscle fibers estimated with fluo-3. Biophys J. 1993;65:865–881. doi: 10.1016/S0006-3495(93)81112-3. [DOI] [PMC free article] [PubMed] [Google Scholar]
- Hatem SN, Benardeau A, Rucker-Martin C, Marty I, De Chamisso P, Villaz M, Mercardier J-J. Different compartments of sarcoplasmic reticulum participate in the excitation-contraction coupling process in human atrial myocytes. Circ Res. 1997;80:345–353. doi: 10.1161/01.res.80.3.345. [DOI] [PubMed] [Google Scholar]
- Hüser J, Blatter LA, Lipsius SL. Intracellular Ca2+ release contributes to automaticity in cat atrial pacemaker cells. J Physiol. 2000a;524:415–422. doi: 10.1111/j.1469-7793.2000.00415.x. [DOI] [PMC free article] [PubMed] [Google Scholar]
- Hüser J, Lipsius SL, Blatter LA. Calcium gradients during excitation-contraction coupling in cat atrial myocytes. J Physiol. 1996;494:641–651. doi: 10.1113/jphysiol.1996.sp021521. [DOI] [PMC free article] [PubMed] [Google Scholar]
- Hüser J, Wang YG, Sheehan KA, Cifuentes F, Lipsius SL, Blatter LA. Functional coupling between glycolysis and excitation-contraction coupling underlies alternans in cat heart cells. J Physiol. 2000b;524:795–806. doi: 10.1111/j.1469-7793.2000.00795.x. [DOI] [PMC free article] [PubMed] [Google Scholar]
- Kockskämper J, Sheehan KA, Bare DJ, Lipsius SL, Mignery GA, Blatter LA. Activation and propagation of Ca2+ release during excitation-contraction coupling in atrial myocytes. Biophys J. 2001;81:2590–2605. doi: 10.1016/S0006-3495(01)75903-6. [DOI] [PMC free article] [PubMed] [Google Scholar]
- Lewis Carl S, Felix K, Caswell AH, Brandt NR, Ball WJ, Jr, Vaghy PL, Meissner G, Ferguson DG. Immunolocalization of sarcolemmal dihydropyridine receptor and sarcoplasmic reticular triadin and ryanodine receptor in rabbit ventricle and atrium. J Cell Biol. 1995;129:673–682. doi: 10.1083/jcb.129.3.673. [DOI] [PMC free article] [PubMed] [Google Scholar]
- Lipp P, Niggli E. Microscopic spiral waves reveal positive feedback in subcellular calcium signaling. Biophys J. 1993;65:2272–2276. doi: 10.1016/S0006-3495(93)81316-X. [DOI] [PMC free article] [PubMed] [Google Scholar]
- Lipp P, Niggli E. A hierarchical concept of cellular and subcellular Ca2+-signalling. Prog Biophys Mol Biol. 1996;65:265–296. doi: 10.1016/s0079-6107(96)00014-4. [DOI] [PubMed] [Google Scholar]
- Lipp P, Pott L, Callewaert G, Carmeliet E. Simultaneous recording of indo-1 fluorescence and Na+/Ca2+ exchange currents reveals two components of Ca2+ release sarcoplasmic reticulum of cardiac atrial myocytes. FEBS Lett. 1990;275:181–184. doi: 10.1016/0014-5793(90)81467-3. [DOI] [PubMed] [Google Scholar]
- London B, Krueger JW. Contraction in voltage-clamped, internally perfused single heart cells. J Gen Physiol. 1986;88:475–505. doi: 10.1085/jgp.88.4.475. [DOI] [PMC free article] [PubMed] [Google Scholar]
- Lopez-Lopez JR, Shacklock PS, Balke CW, Wier WG. Local, stochastic release of Ca2+ in voltage-clamped rat heart cells: visualization with confocal microscopy. J Physiol. 1994;480:21–29. doi: 10.1113/jphysiol.1994.sp020337. [DOI] [PMC free article] [PubMed] [Google Scholar]
- Lopez-Lopez JR, Shacklock PS, Balke CW, Wier WG. Local calcium transients triggered by single L-type calcium channel currents in cardiac cells. Science. 1995;268:1042–1045. doi: 10.1126/science.7754383. [DOI] [PubMed] [Google Scholar]
- Lukyanenko V, Gyorke I, Subramanian S, Smirnov A, Wiesner TF, Gyorke S. Inhibition of Ca2+ sparks by ruthenium red in permeablized rat ventricular myocytes. Biophys J. 2000;79:1273–1284. doi: 10.1016/S0006-3495(00)76381-8. [DOI] [PMC free article] [PubMed] [Google Scholar]
- McDonald TF, Nawrath H, Trautwien W. Membrane currents and tension in cat ventricular muscle treated with cardiac glycosides. Circ Res. 1975;37:674–682. doi: 10.1161/01.res.37.5.674. [DOI] [PubMed] [Google Scholar]
- Mackenzie L, Bootman MD, Berridge MJ, Lipp P. Predetermined recruitment of calcium release sites underlies excitation-contraction coupling in rat atrial myocytes. J Physiol. 2001;530:417–429. doi: 10.1111/j.1469-7793.2001.0417k.x. [DOI] [PMC free article] [PubMed] [Google Scholar]
- McNutt NS, Fawcett DW. The ultrastructure of the cat myocardium. II. Atrial muscle. J Cell Biol. 1969;42:46–67. doi: 10.1083/jcb.42.1.46. [DOI] [PMC free article] [PubMed] [Google Scholar]
- Parker I, Zang WJ, Wier WG. Ca2+ sparks involving multiple Ca2+ release sites along Z-lines in rat heart cells. J Physiol. 1996;497:31–38. doi: 10.1113/jphysiol.1996.sp021747. [DOI] [PMC free article] [PubMed] [Google Scholar]
- Rios E, Stern MD. Calcium in close quarters: Microdomain feedback in excitation-contraction coupling and other biological phenomena. Annu Rev Biophys Biomol Struct. 1997;26:47–82. doi: 10.1146/annurev.biophys.26.1.47. [DOI] [PubMed] [Google Scholar]
- Rose WC, Balke CW, Wier WG, Marban E. Macroscopic and unitary properties of physiological ion flux through L-type Ca2+ channels in guinea-pig heart. J Physiol. 1992;456:267–284. doi: 10.1113/jphysiol.1992.sp019336. [DOI] [PMC free article] [PubMed] [Google Scholar]
- Santana LF, Cheng H, Gomez AM, Cannell MB, Lederer WJ. Relation between the sarcolemmal Ca2+ current and Ca2+ sparks and local control theories for cardiac excitation-contraction coupling. Circ Res. 1996;78:166–171. doi: 10.1161/01.res.78.1.166. [DOI] [PubMed] [Google Scholar]
- Scriven DRL, Dan P, Moore EDW. Distribution of proteins implicated in excitation-contraction coupling in rat ventricular myocytes. Biophys J. 2000;79:2682–2691. doi: 10.1016/S0006-3495(00)76506-4. [DOI] [PMC free article] [PubMed] [Google Scholar]
- Sheehan KA, Bare DJ, Mignery GA, Blatter LA. Inhomogeneity of spontaneous Ca2+ sparks in cat atrial myocytes. Biophys J. 2001a;80:63a. doi: 10.1016/S0006-3495(01)75903-6. [DOI] [PMC free article] [PubMed] [Google Scholar]
- Sheehan KA, Blatter LA. Local control of e-c coupling in cat atrial myocytes. Biophys J. 2000;78:375a. [Google Scholar]
- Sheehan KA, Kockskämper J, Blatter LA. Local Ca2+ signals during e-c coupling in cat atrial myocytes. Biophys J. 2001b;80:598a. doi: 10.1016/S0006-3495(01)75903-6. [DOI] [PMC free article] [PubMed] [Google Scholar]
- Sipido KR, Carmeliet E, Van De Werf F. T-type Ca2+ current as a trigger for Ca2+ release from the sarcoplasmic reticulum in guinea-pig ventricular myocytes. J Physiol. 1998;508:439–451. doi: 10.1111/j.1469-7793.1998.439bq.x. [DOI] [PMC free article] [PubMed] [Google Scholar]
- Sipido KR, Wier WG. Flux of Ca2+ across the sarcoplasmic reticulum of guinea-pig cardiac cells during excitation-contraction coupling. J Physiol. 1991;435:605–630. doi: 10.1113/jphysiol.1991.sp018528. [DOI] [PMC free article] [PubMed] [Google Scholar]
- Stern MD. Theory of excitation-contraction coupling in cardiac muscle. Biophys J. 1992;63:497–517. doi: 10.1016/S0006-3495(92)81615-6. [DOI] [PMC free article] [PubMed] [Google Scholar]
- Takamatsu T, Wier WG. Calcium waves in mammalian heart: quantification of origin, magnitude, waveform and velocity. FASEB J. 1990;4:1519–1525. doi: 10.1096/fasebj.4.5.2307330. [DOI] [PubMed] [Google Scholar]
- Tanaka H, Masumiya H, Sekine T, Kase J, Kawanishi T, Hayakawa T, Miyata S, Sato Y, Nakamura R, Shigenobu K. Involvement of Ca2+ waves in excitation-contraction coupling of rat atrial cardiomyocytes. Life Sci. 2001;70:715–726. doi: 10.1016/s0024-3205(01)01436-9. [DOI] [PubMed] [Google Scholar]
- Thomas G, Tovey SC, Collins TJ, Bootman MD, Berridge MJ, Lipp P. A comparison of fluorescent Ca2+ indicator properties and their use in measuring elementary and global Ca2+ signals. Cell Calcium. 2000;28:213–223. doi: 10.1054/ceca.2000.0152. [DOI] [PubMed] [Google Scholar]
- Trafford AW, O'Neill SC, Eisner DA. Factors affecting the propagation of locally activated systolic Ca transients in rat ventricular myocytes. Pflügers Arch. 1993;425:181–183. doi: 10.1007/BF00374521. [DOI] [PubMed] [Google Scholar]
- Wier WG, Balke CW. Ca2+ release mechanisms, Ca2+ sparks, and local control of excitation-contraction coupling in normal heart muscle. Circ Res. 1999;85:770–776. doi: 10.1161/01.res.85.9.770. [DOI] [PubMed] [Google Scholar]
- Wier WG, Blatter LA. Ca2+-oscillations and Ca2+-waves in mammalian cardiac and vascular smooth muscle cells. Cell Calcium. 1991;12:241–254. doi: 10.1016/0143-4160(91)90024-9. [DOI] [PubMed] [Google Scholar]
- Wier WG, Cannell MB, Berlin JR, Marban E, Lederer WJ. Cellular and subcellular heterogeneity of [Ca2+]i in single heart cells revealed by fura-2. Science. 1987;235:325–328. doi: 10.1126/science.3798114. [DOI] [PubMed] [Google Scholar]
- Wier WG, Egan TM, Lopez-Lopez JR, Balke CW. Local control of excitation-contraction coupling in rat heart cells. J Physiol. 1994;474:463–471. doi: 10.1113/jphysiol.1994.sp020037. [DOI] [PMC free article] [PubMed] [Google Scholar]
- Woo S-H, Cleemann L, Morad M. Ca2+ current-gated focal and local Ca2+ release in rat atrial myocytes: evidence from rapid 2-D confocal imaging. J Physiol. 2002;543:439–453. doi: 10.1113/jphysiol.2002.024190. [DOI] [PMC free article] [PubMed] [Google Scholar]
- Wu J, Vereecke J, Carmeliet E, Lipsius SL. Ionic currents activated during hyperpolarization of single right atrial myocytes from cat heart. Circ Res. 1991;68:565–574. doi: 10.1161/01.res.68.4.1059. [DOI] [PubMed] [Google Scholar]
- Zhou Z, January CT. Both T-type and L-type Ca2+ channels can contribute to excitation-contraction coupling in cardiac Purkinje cells. Biophys J. 1998;74:1830–1839. doi: 10.1016/S0006-3495(98)77893-2. [DOI] [PMC free article] [PubMed] [Google Scholar]