Abstract
The carotid body plays a crucial role in cardiorespiratory regulation. In the present study we investigated the effect of osmotic changes on cytoplasmic calcium concentration ([Ca2+]c) and pH (pHi) of isolated chemoreceptor cells of the rat carotid body. In CO2/HCO3−-buffered medium, reduction of osmolality from the control level of 300 mosmol kg−1 to 250–285 mosmol kg−1 resulted in a rise in [Ca2+]c, as measured with Indo-1, whereas elevation of osmolality to 350 mosmol kg−1 had no effect. The Ca2+ response required extracellular Ca2+ and was reduced by application of the L-type Ca2+ channel antagonist nifedipine (10 μm). The hyposmosis-induced Ca2+ response could be prevented by application of niflumic acid (300 μm), an inhibitor of the swelling-activated Cl− channel. In whole-cell patch-clamp experiments niflumic acid abolished the swelling-activated Cl− current but only slightly depressed the Ca2+ current. The inhibition of Ca2+ current by niflumic acid does not account for its action in preventing of hyposmosis-induced Ca2+ response, which seems to be initiated by Cl−-mediated depolarisation. Withdrawal of CO2/HCO3− also prevented the Ca2+ response. Reduction of the osmotic concentration by 50 mosmol kg−1 induced a small but sustained decrease in pHi, while elevation by 50 mosmol kg−1 had an inverse effect, as measured fluorimetrically with carboxy SNARF-1. Our conclusion is that in the rat chemoreceptor cell the activation of Cl− channels, e.g. by hyposmotic challenge, induces depolarisation, which, in turn, activates voltage-gated Ca2+ channels.
The peripheral chemoreceptor carotid and aortic bodies detect changes in arterial PO2, PCO2, pH and [K+] and play important roles both in the short-term and long-term control of the cardiorespiratory system. The carotid body comprises the neural crest-derived chemoreceptor (type I) cells and the glial-like supporting (type II) cells. Although the mechanism of chemosensing has not yet been fully discovered, it has been known to involve membrane depolarisation, activation of high-threshold voltage-gated Ca2+ channels, elevation of cytoplasmic calcium concentration ([Ca2+]c) and neurotransmitter release (for review see Gonzalez et al. 1994).
Reduced extracellular osmolality results in increased cell volume. Most cell types respond to this noxious event with regulatory volume decrease, a protective mechanism involving the cell-specific activation of various transport processes (for review see Lang et al. 1998). Among others, Cl− channels are known to be activated upon hyposmotic cell swelling and the ensuing efflux of both organic osmolytes and Cl− counteracts swelling (for review see Jentsch & Gunther, 1997; Okada, 1997; Fürst et al. 2002). However, the activation of Cl− channels may result not only in regulatory volume changes, but also in changes of membrane potential. Two early reports showed that osmotic stimuli may change the activity of the carotid sinus nerve (Gallego & Belmonte, 1979; Gallego et al. 1979), while more recently hyposmosis-induced activation of an outwardly rectifying Cl− current was found in the chemoreceptor cells of the rat (Carpenter & Peers, 1997). While membrane potential was not examined in this latter study, our previous observation suggested that an increased anion conductance exerted a depolarising effect in these cells (Petheo et al. 2001). In the present experiments we studied the role of Cl− conductance in the cellular effects of osmotic changes and found that osmotic changes influence both [Ca2+]c and pHi in type I cells of the rat carotid body. Even moderate hyposmosis induces a Ca2+ signal and swelling-activated Cl− channels play a crucial role in initiating the response.
Methods
Cell isolation
Experiments were performed on chemoreceptor cells isolated from the carotid bodies of two or three 10- to 20-day-old Wistar rats. Rats were killed with a lethal dose of sodium pentobarbital (375-600 mg (kg body weight)−1). The head together with the neck was cut off within 1-2 min and placed in ice cold saline. The carotid bodies were removed and incubated in low-Ca2+ (0.2 mm) phosphate-buffered saline containing collagenase (2 mg ml−1, Type 1, Sigma) and trypsin (2 mg ml−1, Difco Laboratories, Detroit, USA) at 37 °C for 17 min. The carotid bodies were teased apart with forceps, then digested for a further 5 min. Following trituration, the cells were centrifuged at 200 g for 10 min. The pellet was resuspended in culture medium (see Solutions below; 50 μl per carotid body). Twenty-five microlitre aliquots of cell suspension were plated onto the centre of poly-d-lysine-coated 35 mm Petri dishes or 22 mm glass cover slips. Two hours were allowed for adhesion in an incubator (5 % CO2, 37 °C), and then 1.5 ml of culture medium was added to the Petri dishes. Cells were cultured for 6-36 h. Experiments were performed on single chemoreceptor cells, which remained phase bright and became polygonal in culture, with a diameter of 10-15 μm, and in some cases on clusters of two to eight such cells. In order to test viability and chemosensitivity, hypercapnic acidosis (20 % CO2, pH 6.8) was applied at the beginning of each experiment when [Ca2+]c was measured and only cells showing a marked and completely reversible [Ca2+]c response were chosen for further measurements.
The experiments were performed with the approval of the Animal Care and Ethics Committee of the Semmelweis University (No. 17-3/98). All procedures used conformed with the UK Animals (Scientific Procedures) Act 1986.
Fluorimetric measurements of
Cells plated on glass coverslips were loaded with Indo-1 acetoxymethyl esther (2 μm, TefLabs, Austin, TX, USA) in cell culture medium for 45-60 min under 5 % CO2 at 37 °C. For fluorimetric measurements the coverslips were transferred to the bottom of a 2 ml Perspex chamber, and placed on the stage of an inverted microscope (Diaphot 300, Nikon, Tokyo, Japan) fitted with an oil-immersion objective (× 100, NA 1.3, Nikon). The chamber contained ≈100 μl of incubation medium, which was exposed to a permanent flow of a prehumidified gas mixture containing 5 % CO2 and 20 % O2 in N2. Solution changes were carried out within 40 s by infusing 1 ml of the new solution pre-equilibrated with the same gas mixture. The excess volume was continuously removed by a suction pump. Fluorescence was monitored in modified Tyrode solution, buffered with bicarbonate at about 28 °C, using the xenon arc lamp of a Deltascan fluorimeter (PTI, South Brunswick, NJ, USA). The cells were illuminated at 355 nm, while fluorescence emitted at 400 nm (F400) and 500 nm (F500) was collected over 0.5 s intervals with photomultiplier tubes (model 712, PTI) and digitally sampled at 10 Hz. The ratio (R) of F400/F500 was then calculated.
Using in situ calibration (Buckler & Vaughan-Jones, 1993), we obtained values for Rmin (ratio after chelating Ca2+), Rmax (ratio at saturating [Ca2+]c) and β (the ratio of 500 nm emitted light at zero and saturating [Ca2+]c) of 1.00 ± 0.03, 8.24 ± 0.24 and 4.29 ± 0.05, respectively. For converting R values into absolute values of [Ca2+]c we used the following equation:
where KD was assumed to be 250 nm (Grynkiewicz et al. 1985). (Autofluorescence was negligible at both wavelengths.) In view of the known divergence of values determined by in situ calibration from the true [Ca2+]c (Baker et al. 1994; Wang & Zhou, 1999), R values were not routinely converted to absolute values of [Ca2+]c.
Fluorimetric measurements of pHi
pHi was measured with the dual-emission pH-sensitive fluoroprobe carboxy SNARF-1, using the ratio mode. The cells were loaded with carboxy SNARF-1 acetoxymethyl esther (10 μm, Molecular Probes, Eugene, OR, USA) in bicarbonate-buffered modified Tyrode solution for 15 min under 5 % of CO2 at 26-28 °C. The excitation wavelength was 540 nm and the ratio of fluorescence emitted at 580 and 640 nm was then calculated. For calibration, the standard nigericin technique was applied (Thomas et al. 1979). To prevent any contamination with nigericin, a different cell chamber was used during the calibration process and nigericin was applied directly into the external solution in the chamber, instead of through the perfusion tubes.
Patch-clamp recording
Voltage-clamp whole-cell experiments were performed using an RK-400 (Biologic Science Instruments, Claix, France) patch-clamp amplifier. Pipettes were pulled from borosilicate glass tubing (1B120F-4; World Precision Instruments, Inc., USA) using a P-87 puller (Sutter Instrument Co., USA). Pipette resistance was 5-9 MΩ when filled with intracellular solutions. Cells were locally perfused by a gravity-driven perfusion system from a linear array of five or ten microcapillary plastic tubes located about 0.1 mm from the cell. All patch-clamp experiments were performed at room temperature (28 °C). Currents were low-pass filtered at 1 kHz (-3 dB, 5-pole Bessel filter) and sampled at 2 kHz for measuring chloride currents and at 8 kHz for measuring calcium currents using a Digidata 1200 interface board (Axon Instruments). Data storage was performed using pCLAMP 6 software (Axon Instruments), while analysis was carried out with pCLAMP 8.0 running on a PC/AT computer. Current data were not leak corrected. The mean membrane capacitance of chemoreceptor cells was 4.7 ± 1 pF (n = 29) and was compensated in each case with the built-in circuit of the amplifier. No compensation was applied for series resistance error. The bath was earthed using an Ag-AgCl pellet. The junction potential never exceeded ±4 mV and was not corrected for. The Ca2+ current usually displayed run-down, with a mean value of 3.3 ± 0.7 % (90 s)−1 (n = 9). No correction was applied for run-down.
Solutions
The culture medium contained Dulbecco's MEM (GibcoBRL) and Ham’ s F-12 (GibcoBRL) (1:1) supplemented with 10 % heat-inactivated fetal calf serum (Protein GMK, Gödöll’‘o, Hungary), 100 IU ml−1 penicillin, 100 μg ml−1 streptomycin and 84 U l−1 insulin (Gibco-BRL).
Osmotically different test solutions for fluorimetric measurements were prepared from modified bicarbonate-buffered Tyrode solution containing (mm): 92 NaCl, 23 NaHCO3, 4.5 KCl, 2.5 CaCl2, 1 MgCl2, 11 glucose, equilibrated with 5 % CO2 and 20 % O2 in N2 (measured osmotic concentration: 249 ± 2 mosmol kg−1, pH 7.40 ± 0.02). The osmolality of the solutions was then changed by the addition of sucrose to attain final osmolalities of 275, 285, 300 or 350 mosmol kg−1. Three hundred mosmol kg−1 was taken as the control level. Osmolality was measured with a freezing-point osmometer (MicroOsmometer 3MO, Advanced Instruments, Norwood, MA, USA). Hypercapnic acidosis was achieved by increasing the CO2 content of the gas mixture to 20 % (pH 6.80 ± 0.02).
For measuring calcium currents, pipette solutions contained (mm): 10 TEA-Cl, 110 CsCl, 0.5 CaCl2, 2 BAPTA (estimated free [Ca2+] ≈100 nm), 4 Na2ATP, 0.3 Na2GTP, 5 sodium phosphocreatine, 5 MgCl2, 10 Hepes, (pH 7.3, adjusted with CsOH), and bath solutions contained (mm): 122 NaCl, 10 TEA-Cl, 4.5 CsCl, 2.5 CaCl2, 1 MgCl2, 10 glucose, 10 Hepes (pH 7.4, adjusted with NaOH). For measuring chloride currents, the pipette solution consisted of (mm): 132 CsCl, 2 MgCl2, 1 CaCl2, 11 EGTA, 2 Na2ATP, 11 Hepes (pH 7.3 with CsOH, 309 mosmol kg−1, estimated free [Ca2+] ≈10 nm), the bath solution contained (mm): 70 NaCl, 45 TEA-Cl, 5 CsCl, 6 MgCl2, 0.2 CaCl2, 5 Hepes, 50 or 0 sucrose (pH 7.4 with NaOH, 310 mosmol kg−1 in isosmotic and 260 mosmol kg−1 in hyposmotic media). Chemicals were from Sigma, unless otherwise stated.
Data handling and statistics
Data are presented as means ± s.e.m. and n stands for the number of tested cells, obtained from at least two independent cell cultures. Cells showing a monotonic rise in ratio value in Indo-1 fluorescence measurements were excluded (5 cells out of 66). In about a quarter of the cells niflumic acid induced a sustained rise in [Ca2+]c, and these cells were also excluded from the analysis. Two-way ANOVA for repeated measurements and Student's paired t test were used as statistical tests. For post hoc comparisons Tukey's Honest Significant Difference test was chosen. A value of P < 0.05 was considered statistically significant.
Results
Effects of osmotic changes on [Ca2+]c
To examine the effect of osmotic changes on [Ca2+]c we decreased or increased the osmotic concentration by 50 mosmol kg−1 for periods of 10 min. Figure 1A and B illustrates the Ca2+ response first to a test stimulus of hypercapnic acidosis and then to a decrease in osmotic concentration from the control level of 300 mosmol kg−1 to 250 mosmol kg−1. All tested cells showed a marked Ca2+ response with a rise in peak R value of 1.54 ± 0.12 (P < 0.001, n = 19) that, according to the equation of Grynkiewicz et al. (1985), would correspond to a rise in [Ca2+]c from 52 ± 6 to 389 ± 31 nm. Though the response declined over time in each case, the time course of the response was not uniform. In eight cells [Ca2+]c remained elevated by at least 50 nm and/or repetitive Ca2+ spikes were observed (Fig. 1A). Eleven cells showed transient response, and [Ca2+]c returned close to baseline within 10 min (Fig. 1B). Elevation of osmolality by 50 mosmol kg−1 exerted no apparent influence on [Ca2+]c during the 10 min observation period (n = 11, Fig. 1C). To evaluate the osmosensitivity of chemoreceptor cells to more physiological decreases in osmolality, we reduced the osmotic concentration from the control level of 300 mosmol kg−1 to 250, 275 and 285 mosmol kg−1, in a random sequence. The effect of each different hyposmotic concentration was examined for 100 s. Each of the six examined cells responded to both 250 mosmol kg−1 (with an increase in R value of 1.86 ± 0.27) and 275 mosmol kg−1 (R value increased by 1.33 ± 0.29, P < 0.05). Four out of the six cells also responded to the 15 mosmol kg−1 decrease (R value increased by 1.36 ± 0.19, P < 0.05) (Fig. 2). It is clear that the smallest reduction in osmotic concentration tested, i.e. 15 mosmol kg−1, was effective in eliciting a cytoplasmic Ca2+ response in a fraction of the cells.
Figure 1. Effect of osmotic changes on [Ca2+]c in cultured chemoreceptor cells obtained from rat carotid bodies.
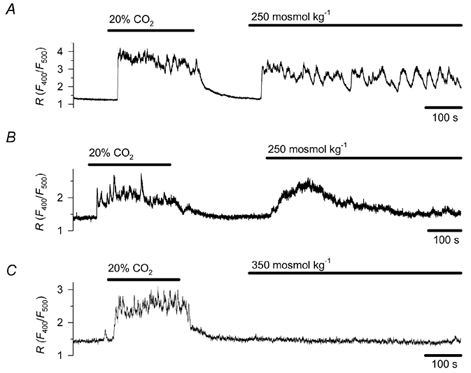
Decreasing osmolality from the control level of 300 mosmol kg−1 to 250 mosmol kg−1 induced a sustained (A, n = 8) or transient rise (B, n = 11) in [Ca2+]c, while elevating osmolality to 350 mosmol kg−1 (C, n = 11) had no effect. The osmotic concentration was adjusted by changing the sucrose concentration. [Ca2+]c was estimated by fluorimetry in cells preloaded with Indo-1. [Ca2+]c is indicated by the ratio (R) of emitted light at 400 and 500 nm, respectively. Hypercapnic acidosis (20 % CO2, pH 6.8) was applied as a test stimulus.
Figure 2. Effect of different decreases in osmolality on .
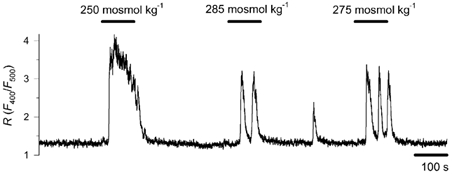
Cytoplasmic Ca2+ concentration was monitored in cells exposed to solutions of 250, 275 and 285 mosmol kg−1 in a random sequence. A representative record is shown for 6 cells. Decreases in osmolality to 250 and 275 mosmol kg−1 induced a [Ca2+]c rise in each of the 6 tested cells, while 285 mosmol kg−1 evoked a response in 4 cells.
Effect of Ca2+ removal and nifedipine on hyposmosis-induced Ca2+ response
To elucidate whether the hyposmosis-induced Ca2+ signal is brought about by an influx of extracellular Ca2+ and/or Ca2+ release from intracellular stores, we examined how the removal of extracellular Ca2+ influences the effect of hyposmosis. In a Ca2+-free incubation medium, containing 0.5 mm EGTA, exposure to 250 mosmol kg−1 had no effect on [Ca2+]c (n = 5). When control and Ca2+-free media were alternated during hyposmotic challenge, a return to physiological Ca2+ concentration restored the Ca2+ signal (n = 4, Fig. 3A).
Figure 3. The role of extracellular Ca2+ and voltage-activated Ca2+ influx in the hyposmosis-induced Ca2+ response.
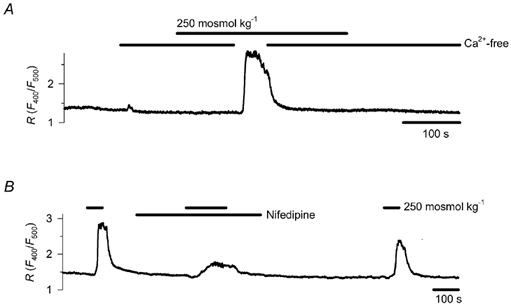
A, cells incubated in Ca2+-free medium (containing 0.5 mm EGTA) failed to respond to a reduction in osmotic concentration from 300 to 250 mosmol kg−1, but the transient restoration of control Ca2+ concentration restored the cytoplasmic Ca2+ signal (representative record for 4 cells). B, effect of 10 μm nifedipine on the Ca2+ signal elicited by a reduction in osmotic concentration from 300 to 250 mosmol kg−1 (representative record for 4 cells).
Next we wanted to test whether Ca2+ influx from the extracellular fluid was due to voltage activation of Ca2+ channels. Chemoreceptor cells obtained from the carotid body of rats express only high-voltage-activated Ca2+ channels, predominantly L-type and, to a lesser extent, N-type channels (Fieber & McCleskey, 1993; eSilva & Lewis, 1995; Peers et al. 1996). Therefore, we applied the L-type Ca2+ channel inhibitor nifedipine (10 μm). The drug induced a 67 ± 7 % inhibition of the hyposmosis-induced Ca2+ signal (reduction of peak R value from 1.54 ± 0.06 to 0.51 ± 0.13, n = 4, P < 0.001, Fig. 3B). This indicates that depolarisation activates the plasmalemmal Ca2+ channels during the hyposmosis-induced Ca2+ response.
Effects of niflumic acid
Our previous work has already raised the possibility that in rat type I cells an increased Cl− conductance results in depolarisation (Petheo et al. 2001). The chemoreceptor cell exhibits a chloride current that can be activated by hyposmotic challenge (Carpenter & Peers, 1997), and therefore we now studied whether activation of this current by hypotonic challenge could account for the induction of the voltage-dependent Ca2+ response. The current can be blocked by the voltage-independent inhibitor niflumic acid, which we applied at a concentration of 300 μm (Carpenter & Peers, 1997). The Ca2+ signal was induced again by decreasing the osmotic concentration from the control value of 300 mosmol kg−1 to 250 mosmol kg−1. Niflumic acid completely prevented the Ca2+ response in 9 out of the 11 cells tested, and in the other two cells the response was inhibited by 82 and 50 %. The inhibitory effect of niflumic acid was reversible (Fig. 4).
Figure 4. Effect of niflumic acid on the hyposmosis-induced Ca2+ response.
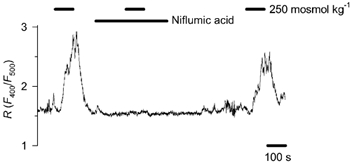
A representative record for 9 cells shows that niflumic acid (300 μm), an inhibitor of the swelling-activated chloride channel, prevented the Ca2+ response to a reduction in osmotic concentration from 300 to 250 mosmol kg−1. In two other cells the drug did not prevent the Ca2+ response, but strongly reduced it.
To examine whether niflumic acid prevented the Ca2+ response by inhibiting the swelling-activated Cl− conductance and the ensuing depolarisation or acted directly on a Ca2+ entry mechanism, we studied the effect of niflumic acid on the voltage-activated Ca2+ conductance in patch-clamp experiments. Whole-cell Ca2+ currents were evoked by the application of 200 ms depolarising steps every 15 s from – 80 mV to the estimated value of the chloride equilibrium potential (ECl), i.e. −2 mV (Fig. 5A). Current amplitudes were averaged for the period between 10 and 30 ms of the depolarising step. Niflumic acid (300 μm) reduced the current. Steady-state inhibition was usually reached in 1 min and ranged between 7 and 37 % of control at the 90th second of the application (n = 8, Fig. 5B). The effect of the drug was reversible in each case, although complete recovery was observed in two cells only, presumably due to current run-down. In parallel patch-clamp experiments nifedipine (10 μm) reduced the current by 62 ± 7 % (n = 3, Fig. 5C).
Figure 5. Effect of niflumic acid and nifedipine on voltage-activated Ca2+ current.
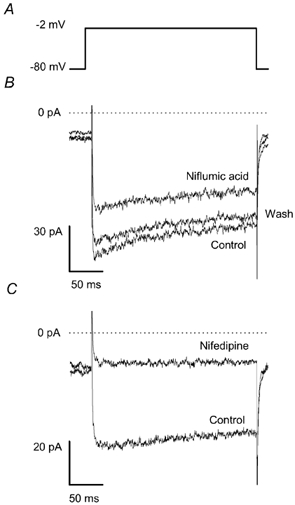
The chemoreceptor cells were examined using the patch-clamp technique in the whole-cell voltage-clamp configuration. A shows the voltage protocol. The cells were held at – 80 mV and every 15 s a step depolarisation was applied to – 2 mV (estimated value of ECl). B, voltage-activated current under control conditions, 90 s after adding niflumic acid (300 μm) and 90 s after washing out the drug (n = 8). C, voltage-activated current under control conditions and 90 s after adding 10 μm nifedipine (n = 3).
Since niflumic acid induced only a slight inhibition of voltage-activated Ca2+ currents, this effect does not account for the abolishment of the hyposmosis-induced Ca2+ response. Provided that niflumic acid inhibits the swelling-activated Cl− conductance, the prevention of the Ca2+ signal could be accounted for by the prevention of Cl− efflux-mediated depolarisation of the cell.
Swelling-activated chloride current
Rat chemoreceptor cells express a chloride channel that can be activated by hyposmotic solution and cAMP (Carpenter & Peers, 1997). To ensure that the hyposmotic challenge activated this chloride channel in our cells, we performed patch-clamp experiments using the whole-cell voltage-clamp configuration. To reduce potassium currents, K+ was replaced with Cs+ both in the pipette and in the bath solutions, and TEA was also applied in the bath. To minimise Ca2+ currents, a low concentration of Ca2+ and a high concentration of Mg2+ were used in the bath (see Methods). Estimated ECl was 1 mV. Using a voltage protocol consisting of a −100 mV step from a holding potential of 0 mV for 2 s, followed by a 2 s voltage ramp up to 60 mV, every 15 s (Fig. 6A, upper panel), a hyposmotic challenge (260 mosmol kg−1) activated a current in 15 out of the 17 cells examined (Fig. 6A, middle panel). Maximal current (283 ± 61 pA; n = 14) developed within 3.5 ± 0.5 min. Thereafter, current run-down could be observed in about half of the cells. The current displayed a slightly outwardly rectifying profile during the ramp, and reversed at 1 ± 2 mV (n = 15), identical to ECl. Niflumic acid (300 μm) produced an almost complete inhibition without any conspicuous voltage dependency (n = 9, Fig. 6A, bottom panel). Figure 6C depicts the effect of hyposmotic solution and niflumic acid on the current measured at −100 mV. These characteristics of the current are very similar to the swelling-activated current described by Carpenter & Peers (1997) and provide evidence that hyposmosis activates a chloride conductance in our cells as well. Following the inhibition of the swelling-activated conductance, in nearly half of the cells examined an inward current could also be detected during hyperpolarisation. The current displayed characteristics similar to a ClC-2-like Cl− current previously described in the rat chemoreceptor cell (Petheo et al. 2001). This current activated slowly and the time-dependent component, measured at the end of the −100 mV-step, was 8 ± 2 pA (n = 8, Fig. 6B). The intensity of this current was negligible compared to that of the swelling-activated current, and its presence could not be examined without the application of niflumic acid.
Figure 6. Swelling-activated chloride current.
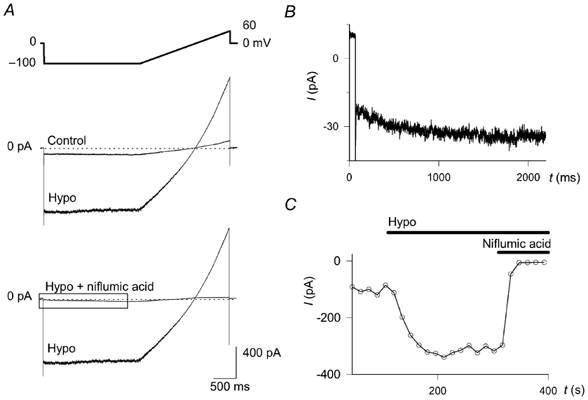
The chemoreceptor cells were examined with the patch-clamp technique in the whole-cell voltage-clamp configuration. A, the upper panel shows the voltage protocol. Step hyperpolarisations from a holding potential of 0 to – 100 mV were applied every 15 s for 2 s, followed by a ramp depolarisation up to 60 mV within 2 s. The effect of decreasing osmolality from 310 (Control) to 260 mosmol kg−1 (Hypo) and that of subsequently applied niflumic acid (300 μm) are shown in the middle and bottom panels, respectively (n = 17 and 9, respectively). The current trace enclosed by the box in the lower panel is shown enlarged in B. B, the hyperpolarisation-activated current can be seen after inhibiting the swelling activated current with niflumic acid (300 μm). C, the kinetics of the effect of hyposmosis (Hypo). The current intensity, averaged between 40 and 60 ms after applying the hyperpolarising step (i.e. before the time-dependent activation, shown in B) is shown as function of time.
In several cells after breaking the patch, an increase in current occurred in isotonic bath solution. Niflumic acid induced an almost complete inhibition of this current and the increase accelerated when hyposmosis was applied, suggesting that the current passed through the same channel as the swelling-activated current. The mechanisms behind this phenomenon were not examined.
Effect of osmotic changes on pHi
Changes in osmolality affect pHi in several cell types, and since changes in the pHi of chemoreceptor cells may have a role in signal transduction, we next investigated the effect of osmotic changes on pHi. Figure 7A and B shows the influence of osmotic changes on pHi. Decreasing osmolality from 300 to 250 mosmol kg−1 brought about acidification, by a reduction in pHi from 7.29 ± 0.03 to 7.24 ± 0.03 (n = 5, P < 0.001). The intracellular acidosis was sustained during the whole period of hyposmosis (Fig. 7A). Increasing the osmolality by 50 mosmol kg−1 resulted in sustained intracellular alkalinisation, with an increase in pHi from 7.27 ± 0.03 to 7.34 ± 0.03 (n = 4, P < 0.05, Fig. 7B). The effect was completely reversible in both cases.
Figure 7. Effect of osmotic changes on pHi.
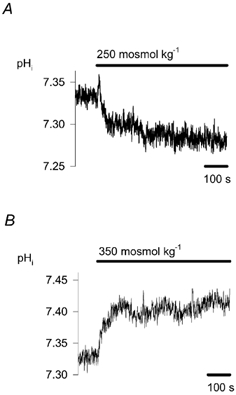
The effect on pHi of decreasing (A, n = 5) or increasing (B, n = 4) osmolality by 50 mosmol kg−1 from 300 mosmol kg−1 is shown. pHi was measured fluorimetrically with carboxy SNARF-1.
Osmosensitivity of type I cells is lacking in the absence of CO2/HCO3−
As our data show, hyposmosis induces marked elevation of [Ca2+]c in CO2/HCO3−-buffered medium. To study whether osmosensitivity depends on the presence of CO2/HCO3− in the ambient medium, we decreased the osmotic concentration from 300 to 250 mosmol kg−1 both in the presence and after the removal of CO2/HCO3−. In the CO2/ HCO3−-free solution pH was buffered with 5 mm Hepes. All the cells responded to hyposmosis prior to CO2/HCO3− removal, but no response was detected in the absence of CO2/HCO3− in five out of six cells tested (Fig. 8). The addition of 5 mm Hepes to the CO2/HCO3− buffer did not effect the Ca2+ response to hyposmosis (n = 6, Fig. 8).
Figure 8. The role of CO2/ HCO3− buffer in hyposmosis-induced Ca2+ response.
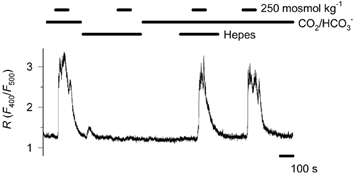
Following replacement of the CO2/HCO3− buffer with 5 mm Hepes, application of 250 mosmol kg−1 failed to induce a Ca2+ response in 5 out of 6 cells tested. Hepes, added to the CO2/HCO3− buffer, did not influence the Ca2+ response (n = 6).
Discussion
The two paired chemoreceptor organs, the carotid and aortic bodies, play an essential role in the control of respiration and circulation. Although they are not assumed to participate in osmoregulation, there are a few reports indicating that osmotic changes modify the function of these chemoreceptors. Yet neither the precise mechanism of the osmotically induced response of the chemoreceptor cells nor the significance of this response have been elucidated. The purpose of our study was to analyse the effects of osmotic changes in the chemoreceptor cell of the rat carotid body.
Increased plasma osmolality has been shown to depress respiratory responses to hypercapnia (Senay, 1969) in man. While no correlation was found between blood osmolality and ventilation in the rat (O'Connor & Jennings, 2001), hyposmosis stimulated and hyperosmosis depressed respiration in the dog (Anderson & Jennings, 1988; Anderson et al. 1990). In the same species, thermal panting was reduced by the intracarotid infusion of hypertonic saline (Baker & Dawson, 1985). Although these experiments show that respiration may be influenced by osmotic changes, the involvement of the carotid body in mediating these effects on ventilation has not been studied. We are aware of very few reports on the effect of osmotic stimuli on the carotid body. Studies, performed in the cat by the same authors, gave opposing results, depending on experimental conditions. Superfusion of the excised carotid body with hyposmotic solution induced hyperpolarisation of the chemoreceptor cells and reduced the discharge frequency of the carotid sinus nerve (Gallego et al. 1979). In situ perfusion of the carotid body with hyposmotic solution increased the discharge frequency of the nerve (Gallego & Belmonte, 1979). This latter effect was attributed to the direct effect of hyposmosis on vascular tone and hence the blood flow in the carotid body, which, in turn, influenced nerve activity. In the rat, a patch-clamp study revealed the hyposmosis-induced activation of an outwardly rectifying Cl− current (Carpenter & Peers, 1997), suggesting a role for osmotic factors in the control of the chemoreceptor cells in rodents.
Hyposmosis-induced Ca2+ response
In the present paper we first examined the responsiveness of cultured chemoreceptor cells, obtained from the rat carotid body, to osmotic stimuli. We observed that a hyposmotic challenge in CO2/HCO3−-buffered medium induced a Ca2+ response, even if the osmotic concentration was reduced by no more than 15 mosmol kg−1. Several cell types counteract osmotically induced swelling by the process of regulatory volume decrease; they extrude osmolytes and water, thereby decreasing their volume. A Ca2+ signal is often associated with regulatory volume decrease (McCarty & O'Neil, 1992). Termination of the Ca2+ response may thus indicate the restitution of cell volume by efficient volume regulating mechanisms. In the present study the Ca2+ signal was over within a few minutes in half of the cells, while in other cells [Ca2+]c displayed either a gradual decline to a suprabasal level within the 10 min observation period or repetitive Ca2+ spikes were observed. Although the reason for such heterogeneous kinetics has still to be elucidated, it may reflect a variation in the efficiency of the volume regulatory mechanisms in individual cells.
Having demonstrated that hyposmosis induces a Ca2+ response, we examined the underlying cellular mechanisms. Since swelling-induced [Ca2+]c elevation may originate both from extra- and intracellular sources (for review see Pasantes-Morales & Mulia, 2000), first we studied the source of the Ca2+ response. Although intracellular Ca2+ stores in chemoreceptor cells play a minor or no role in the stimulus-induced Ca2+ response (Vicario et al. 2000; Mokashi et al. 2001), we checked whether the swelling could induce Ca2+ release from intracellular stores. The Ca2+ response to a hyposmotic challenge was absolutely dependent on the presence of extracellular Ca2+, indicating that the ensuing Ca2+ signal was of extracellular origin. (A contribution of Ca2+-induced Ca2+ release from internal stores to the signal cannot be ruled out.) Next we examined whether Ca2+ influx from the extracellular fluid was brought about by the activation of voltage-operated Ca2+ channels. The rat chemoreceptor cells display only high-threshold, mainly L-type, and to a lesser extent, N-type Ca2+ current (Fieber & McCleskey, 1993; eSilva & Lewis, 1995; Peers et al. 1996). Nifedipine markedly attenuated the hyposmosis-evoked Ca2+ signal, clearly indicating that the effect of cell swelling was mediated through depolarisation.
Osmotically induced pHi changes
Transporters involved in regulatory volume changes may also influence pHi (McCarty & O'Neil, 1992). Among such transporters, Na+-H+ and Cl−-HCO3− antiporters, as well as the Na+-HCO3− symporter, are all known to contribute to pH homeostasis in the chemoreceptor cell (Buckler & Vaughan-Jones, 1994). In view of these data we also studied the effect of osmotic changes on pHi. We observed that the cells displayed sustained acidosis in hyposmotic medium, and conversely, sustained alkalosis under hyperosmotic conditions. In view of the participation of the Cl−-HCO3− antiporter in pH regulation and the role of Cl− channels in cell volume regulation, we next examined the significance of Cl− transport in the response of the chemoreceptor cell to hyposmosis
The role of Cl− channels in Ca2+ signalling
We examined the role of Cl− channels in the activation of voltage-operated Ca2+ channels using application of channel inhibitors. In preliminary fluorimetrical experiments, using Fluo-3, 1 mm anthracene-9-carboxylic acid (9-AC), an inhibitor of the inward-rectifying pH-sensitive Cl− current, exerted only a slight, if any, inhibitory effect on the hyposmosis-induced Ca2+ response (authors' unpublished data). In contrast to the effect of 9-AC, niflumic acid (300 μm) prevented the Ca2+ response. Subsequent patch-clamp experiments revealed the presence of the outwardly rectifying, swelling-activated Cl− conductance. Niflumic acid induced an almost complete inhibition of the outwardly rectifying current and unmasked a small hyperpolarisation-activated current, which probably corresponded to the ClC-2-like Cl− current previously characterised in these cells (Petheo et al. 2001). Based on the effect of niflumic acid, we concluded that Cl−-mediated depolarisation triggered the hyposmosis-induced Ca2+ response. Niflumic acid is a potent and widely used Cl− channel inhibitor, but it must be kept in mind that chloride channel blockers may also exert side-effects on Ca2+ entry mechanisms. 5-Nitro-2-(3-phenylpropylamino) benzoic acid (NPPB), which is related to niflumic acid, has been reported to depress Ba2+ current through L-type Ca2+ channels (Doughty et al. 1998), and niflumic acid may block capacitative Ca2+ currents (Reinsprecht et al. 1995). In our experiments, niflumic acid depressed voltage-activated Ca2+ currents by 17-37 % only. These data show the weak inhibitory effect of niflumic acid on voltage-activated Ca2+ channels. If the extent of inhibition of the voltage-activated Ca2+ current and the hyposmosis-induced Ca2+ signal by niflumic acid is compared with that induced by nifedipine, the lack of correlation between the two effects is obvious. Nifedipine inhibited the Ca2+ current twice as effectively as niflumic acid, yet it could not prevent, just reduce Ca2+ response. Niflumic acid, on the other hand, abolished the hyposmosis-induced Ca2+ response. The conclusion can be drawn that hyposmosis activates niflumic acid-sensitive Cl− channels, Cl− efflux depolarises the cell and this depolarisation, in turn, activates nifedipine-sensitive and -insensitive Ca2+ channels.
Cl−-mediated depolarisation
The expression of carbonic anhydrase and the Cl−-HCO3− antiporter (Iturriaga et al. 1991; Buckler & Vaughan-Jones, 1994) as well as Cl− channels (Stea & Nurse, 1989; Carpenter & Peers, 1997; Petheo et al. 2001) in the rat chemoreceptor cell have been firmly documented. The functional significance of anion transporters and channels in the carotid body has also been demonstrated. Application of the anion exchange blocker 4,4′-diisothiocyanostilbene-2,2′-disulphonic acid (DIDS) or the anion channel blocker 9-AC decreased the baseline activity of the carotid sinus nerve and its response to both hypoxic and hypercapnic stimuli in the cat (Iturriaga et al. 1998). N-Phenylanthracilic acid, another anion channel inhibitor, and 9-AC exerted an inhibitory effect on catecholamine secretion and nerve activity induced by anoxia in the rat (Panisello & Donnelly, 1998).
Until recently three anion currents have been characterised in rat chemoreceptor cells. A large-conductance voltage-insensitive chloride channel was described by Stea & Nurse (1989, 1991). This current was inhibited by high concentrations of 9-AC, whereas stilbene derivatives, like NPPB did not have any influence. Due to the high bicarbonate permeability (PHCO3/PCl = 0.7), the channel was presumed to affect chemoreceptor function by providing a basal bicarbonate efflux. We are not aware of any other report on such a channel in the rat chemoreceptor cell and we also failed to detect any macroscopic anion current with characteristics corresponding to this channel. The explanation for this discrepancy may be methodological: in the experiments of Stea and Nurse the cells were obtained from younger animals and cultured for much longer than in ours.
We have described a macroscopic, relatively small chloride current with marked inward rectification (Petheo et al. 2001). The current amplitude increased in response to acidosis and decreased in response to alkalosis in the physiologically relevant pH range (7.0-7.8) and could be inhibited by 9-AC. The characteristics of this current suggested that it might arise from the activity of the Cl− channel termed ClC-2. The role of the current was revealed by the effect of 9-AC on resting pHi and the membrane potential (Vm). Application of 9-AC increased pHi showing that the current contributes to the resting acid load. The drug also evoked hyperpolarisation, suggesting that a resting Cl− conductance could account for the positive shift of resting Vm from EK. In the present work we also observed a current during the hyperpolarising step, following inhibition of the swelling-activated current. ClC-2 proved to be activated by osmotically induced cell swelling, when it was overexpressed in Xenopus laevis oocytes (Strange et al. 1996; Okada, 1997), but the activation of endogenous ClC-2 upon hypotonic challenge is a matter of debate (Strange, 2002; Fürst et al. 2002). Our preliminary experiments revealed a minor or no role of ClC-2 in the hyposmosis-induced Ca2+ response in rat chemoreceptor cells. Considering the small amplitude of this current, as well as the inefficiency with which 9-AC inhibits swelling-induced Ca2+ signal, a role for ClC-2 in hyposmosis-induced depolarisation seems to be unlikely.
A third type of chloride current was characterised by Carpenter & Peers (1997). This current exhibits a weakly outwardly rectifying current-voltage profile and is activated by cAMP or hypotonic swelling. Niflumic acid inhibits the current in a voltage-independent manner, while DIDS is more potent at positive voltages. The channel corresponding to this current is probably the volume-sensitive organic osmolyte and anion channel (VSOAC), also known as the volume expansion-sensing outwardly rectifying (VSOR) anion channel (Strange et al. 1996; Okada, 1997). Cl− channels usually stabilise or restore resting membrane potential and Carpenter and Peers, although they did not measure membrane potential, also presumed that the current stabilises Vm or hyperpolarises membrane. In this regard, however, it has to be recalled that the Cl− current depolarises cells which accumulate Cl−. Known examples for such a mechanism are smooth muscle cells (Chipperfield & Harper, 2000) or immature hippocampal pyramidal cells (Gaiarsa et al. 1995). In order to assess the role of the Cl− conductance in adjusting membrane potential, one has to estimate the equilibrium potential of the potential charge carriers, Cl− and HCO3−. Assuming that CO2 diffuses freely across the plasma membrane of the chemoreceptor cell, it can be deduced from the Henderson-Hasselbalch and Nernst equations that a pH difference of 0.1-0.3 (inside acidic) would mean an EHCO3 of −6 to −18 mV. The difference between resting Vm (-50 to −60 mV; Petheo et al. 2001) and EHCO3 maintains HCO3− efflux either through anion channels or by the Cl−-HCO3− antiporter. The exchange of cytoplasmic HCO3− with extracellular Cl− results in Cl− accumulation, which means that ECl will also be more positive than Vm. Considering that volume-sensitive Cl− channels may also be permeable to HCO3− (Rasola et al. 1992; Shindo et al. 1996; Fürst et al. 2002), activation of these Cl− channels would favour the efflux of both Cl− and HCO3−, resulting in depolarisation. The present observation, showing that the Ca2+ response depends on the presence of CO2/HCO3− buffer, supports a significant role for anion fluxes in hyposmosis-induced membrane potential changes. While our observations confirm those of Carpenter & Peers (1997), showing the presence of swelling-activated Cl− currents in chemoreceptor cells, our data also suggest that activation of these currents depolarises rather than hyperpolarises the cell. Considering that our conclusion is based on estimated rather than measured equilibrium potentials, our concept of a significant role for anion fluxes in the activation of the chemoreceptor cell should be regarded as a hypothesis.
The physiological significance of swelling-induced depolarisation of chemoreceptor cells is still to be elucidated. Among the specific stimuli of the carotid body, extracellular acidosis induces cell swelling in renal proximal tubular cells (Sullivan et al. 1990, 1991), endothelial cells (Behmanesh & Kempski, 2000) and glial cells (Staub et al. 1990). Similarly, hyperkalaemia may induce swelling in bovine adrenal glomerulosa cells (Hayama et al. 1993). In the view of these observations, we plan to study in chemoreceptor cells the volume changes evoked by various physiological stimuli, and whether such changes exert a feedback action on the biological response.
Acknowledgments
We thank Dr Judit Makara for valuable discussions. The skilful technical assistance of Ms Anikó Rajki and Ms Erzsébet Horváth and medical student Attila Róka is highly appreciated. This work was supported by the Hungarian National Science Foundation (OTKA T 032270) and the National Research and Development Program (NKFP 1/044/2001).
References
- Anderson JW, Jennings DB. Osmolality, NaCl dietary intake, and regulation of ventilation by CO2. Am J Physiol. 1988;255:R105–112. doi: 10.1152/ajpregu.1988.255.1.R105. [DOI] [PubMed] [Google Scholar]
- Anderson JW, Sarda IR, Jennings DB. Acute changes in osmolality and renin and respiratory control of arterial PCO2 and [H+] Respir Physiol. 1990;80:1–16. doi: 10.1016/0034-5687(90)90002-g. [DOI] [PubMed] [Google Scholar]
- Baker AJ, Brandes R, Schreur JH, Camacho SA, Weiner MW. Protein and acidosis alter calcium-binding and fluorescence spectra of the calcium indicator indo-1. Biophys J. 1994;67:1646–1654. doi: 10.1016/S0006-3495(94)80637-X. [DOI] [PMC free article] [PubMed] [Google Scholar]
- Baker MA, Dawson DD. Inhibition of thermal panting by intracarotid infusion of hypertonic saline in dogs. Am J Physiol. 1985;249:R787–791. doi: 10.1152/ajpregu.1985.249.6.R787. [DOI] [PubMed] [Google Scholar]
- Behmanesh S, Kempski O. Mechanisms of endothelial cell swelling from lactacidosis studied in vitro. Am J Physiol Heart Circ Physiol. 2000;279:H1512–1517. doi: 10.1152/ajpheart.2000.279.4.H1512. [DOI] [PubMed] [Google Scholar]
- Buckler KJ, Vaughan-Jones RD. Effects of acidic stimuli on intracellular calcium in isolated type I cells of the neonatal rat carotid body. Pflugers Arch. 1993;425:22–27. doi: 10.1007/BF00374499. [DOI] [PubMed] [Google Scholar]
- Buckler KJ, Vaughan-Jones RD. Role of intracellular pH and [Ca2+]i in acid chemoreception in type-I cells of the carotid body. Adv Exp Med Biol. 1994;360:41–55. doi: 10.1007/978-1-4615-2572-1_5. [DOI] [PubMed] [Google Scholar]
- Carpenter E, Peers C. Swelling- and cAMP-activated Cl− currents in isolated rat carotid body type I cells. J Physiol. 1997;503:497–511. doi: 10.1111/j.1469-7793.1997.497bg.x. [DOI] [PMC free article] [PubMed] [Google Scholar]
- Chipperfield AR, Harper AA. Chloride in smooth muscle. Prog Biophys Mol Biol. 2000;74:175–221. doi: 10.1016/s0079-6107(00)00024-9. [DOI] [PubMed] [Google Scholar]
- Doughty JM, Miller AL, Langton PD. Non-specificity of chloride channel blockers in rat cerebral arteries: block of the L-type calcium channel. J Physiol. 1998;507:433–439. doi: 10.1111/j.1469-7793.1998.433bt.x. [DOI] [PMC free article] [PubMed] [Google Scholar]
- eSilva MJ, Lewis DL. L- and N-type Ca2+ channels in adult rat carotid body chemoreceptor type I cells. J Physiol. 1995;489:689–699. doi: 10.1113/jphysiol.1995.sp021083. [DOI] [PMC free article] [PubMed] [Google Scholar]
- Fieber LA, McCleskey EW. L-type calcium channels in type I cells of the rat carotid body. J Neurophysiol. 1993;70:1378–1384. doi: 10.1152/jn.1993.70.4.1378. [DOI] [PubMed] [Google Scholar]
- Fürst J, Gschwentner M, Ritter M, Botta G, Jakab M, Mayer M, Garavaglia L, Bazzini C, Rodighiero S, Meyer G, Eichmuller S, Woll E, Paulmichl M. Molecular and functional aspects of anionic channels activated during regulatory volume decrease in mammalian cells. Pflugers Arch. 2002;444:1–25. doi: 10.1007/s00424-002-0805-1. [DOI] [PubMed] [Google Scholar]
- Gaiarsa JL, McLean H, Congar P, Leinekugel X, Khazipov R, Tseeb V, Ben Ari Y. Postnatal maturation of gamma-aminobutyric acidA and B-mediated inhibition in the CA3 hippocampal region of the rat. J Neurobiol. 1995;26:339–349. doi: 10.1002/neu.480260306. [DOI] [PubMed] [Google Scholar]
- Gallego R, Belmonte C. The effects of blood osmolality changes on cat carotid body chemoreceptors in vivo. Pflugers Arch. 1979;380:53–58. doi: 10.1007/BF00582612. [DOI] [PubMed] [Google Scholar]
- Gallego R, Eyzaguirre C, Monti-Bloch L. Thermal and osmotic responses of arterial receptors. J Neurophysiol. 1979;42:665–680. doi: 10.1152/jn.1979.42.3.665. [DOI] [PubMed] [Google Scholar]
- Gonzalez C, Almaraz L, Obeso A, Rigual R. Carotid body chemoreceptors: from natural stimuli to sensory discharges. Physiol Rev. 1994;74:829–898. doi: 10.1152/physrev.1994.74.4.829. [DOI] [PubMed] [Google Scholar]
- Grynkiewicz G, Poenie M, Tsien RY. A new generation of Ca2+ indicators with greatly improved fluorescence properties. J Biol Chem. 1985;260:3440–3450. [PubMed] [Google Scholar]
- Hayama N, Wang W, Robinson TV, Kramer RE, Schneider EG. Osmolality and potassium cause alterations in the volume of glomerulosa cells. Endocrinology. 1993;132:1230–1234. doi: 10.1210/endo.132.3.8440183. [DOI] [PubMed] [Google Scholar]
- Iturriaga R, Lahiri S, Mokashi A. Carbonic anhydrase and chemoreception in the cat carotid body. Am J Physiol. 1991;261:C565–573. doi: 10.1152/ajpcell.1991.261.4.C565. [DOI] [PubMed] [Google Scholar]
- Iturriaga R, Mokashi A, Lahiri S. Anion exchanger and chloride channel in cat carotid body chemotransduction. J Auton Nerv Syst. 1998;70:23–31. doi: 10.1016/s0165-1838(98)00019-8. [DOI] [PubMed] [Google Scholar]
- Jentsch TJ, Günther W. Chloride channels: an emerging molecular picture. Bioessays. 1997;19:117–126. doi: 10.1002/bies.950190206. [DOI] [PubMed] [Google Scholar]
- Lang F, Busch GL, Ritter M, Volkl H, Waldegger S, Gulbins E, Haussinger D. Functional significance of cell volume regulatory mechanisms. Physiol Rev. 1998;78:247–306. doi: 10.1152/physrev.1998.78.1.247. [DOI] [PubMed] [Google Scholar]
- McCarty NA, O'Neil RG. Calcium signaling in cell volume regulation. Physiol Rev. 1992;72:1037–1061. doi: 10.1152/physrev.1992.72.4.1037. [DOI] [PubMed] [Google Scholar]
- Mokashi A, Roy A, Rozanov C, Daudu P, Diguilio C, Lahiri S. Ryanodine receptor-mediated [Ca2+]i release in glomus cells is independent of natural stimuli and does not participate in the chemosensory responses of the rat carotid body. Brain Res. 2001;916:32–40. doi: 10.1016/s0006-8993(01)02860-8. [DOI] [PubMed] [Google Scholar]
- O'Connor MD, Jennings DB. Respiratory and metabolic effects of decreased osmolality in conscious rats. Can J Physiol Pharmacol. 2001;79:768–778. [PubMed] [Google Scholar]
- Okada Y. Volume expansion-sensing outward-rectifier Cl− channel: fresh start to the molecular identity and volume sensor. Am J Physiol. 1997;273:C755–789. doi: 10.1152/ajpcell.1997.273.3.C755. [DOI] [PubMed] [Google Scholar]
- Panisello JM, Donnelly DF. Chemotransduction by carotid body chemoreceptors is dependent on bicarbonate currents. Respir Physiol. 1998;112:265–281. doi: 10.1016/s0034-5687(98)00035-8. [DOI] [PubMed] [Google Scholar]
- Pasantes-Morales H, Mulia SM. Influence of calcium on regulatory volume decrease: role of potassium channels. Nephron. 2000;86:414–427. doi: 10.1159/000045829. [DOI] [PubMed] [Google Scholar]
- Peers C, Carpenter E, Hatton CJ, Wyatt CN, Bee D. Ca2+ channel currents in type I carotid body cells of normoxic and chronically hypoxic neonatal rats. Brain Res. 1996;739:251–257. doi: 10.1016/s0006-8993(96)00832-3. [DOI] [PubMed] [Google Scholar]
- Petheo GL, Molnár Z, Róka A, Makara JK, Spät A. A pH-sensitive chloride current in the chemoreceptor cell of rat carotid body. J Physiol. 2001;535:95–106. doi: 10.1111/j.1469-7793.2001.00095.x. [DOI] [PMC free article] [PubMed] [Google Scholar]
- Rasola A, Galietta LJ, Gruenert DC, Romeo G. Ionic selectivity of volume-sensitive currents in human epithelial cells. Biochim Biophys Acta. 1992;1139:319–323. doi: 10.1016/0925-4439(92)90108-y. [DOI] [PubMed] [Google Scholar]
- Reinsprecht M, Rohn MH, Spadinger RJ, Pecht I, Schindler H, Romanin C. Blockade of capacitive Ca2+ influx by Cl− channel blockers inhibits secretion from rat mucosal-type mast cells. Mol Pharmacol. 1995;47:1014–1020. [PubMed] [Google Scholar]
- Senay LC., Jr Increased blood osmolarity and its effect on respiration of dehydrating men. Pflugers Arch. 1969;309:165–175. doi: 10.1007/BF00586966. [DOI] [PubMed] [Google Scholar]
- Shindo M, Simmons NL, Gray MA. Characterization of whole cell chloride conductances in a mouse inner medullary collecting duct cell line mIMCD-3. J Membr Biol. 1996;149:21–31. doi: 10.1007/s002329900003. [DOI] [PubMed] [Google Scholar]
- Staub F, Baethmann A, Peters J, Weigt H, Kempski O. Effects of lactacidosis on glial cell volume and viability. J Cereb Blood Flow Metab. 1990;10:866–876. doi: 10.1038/jcbfm.1990.143. [DOI] [PubMed] [Google Scholar]
- Stea A, Nurse CA. Chloride channels in cultured glomus cells of the rat carotid body. Am J Physiol. 1989;257:C174–181. doi: 10.1152/ajpcell.1989.257.2.C174. [DOI] [PubMed] [Google Scholar]
- Stea A, Nurse CA. Contrasting effects of Hepes vs. HCO3−-buffered media on whole-cell currents in cultured chemoreceptors of the rat carotid body. Neurosci Lett. 1991;132:239–242. doi: 10.1016/0304-3940(91)90310-p. [DOI] [PubMed] [Google Scholar]
- Strange K. Of mice and worms: novel insights into ClC-2 anion channel physiology. News Physiol Sci. 2002;17:11–16. doi: 10.1152/physiologyonline.2002.17.1.11. [DOI] [PubMed] [Google Scholar]
- Strange K, Emma F, Jackson PS. Cellular and molecular physiology of volume-sensitive anion channels. Am J Physiol. 1996;270:C711–730. doi: 10.1152/ajpcell.1996.270.3.C711. [DOI] [PubMed] [Google Scholar]
- Sullivan LP, Wallace DP, Clancy RL, Grantham JJ. Effect of cellular acidosis on cell volume in S2 segments of renal proximal tubules. Am J Physiol. 1990;258:F831–839. doi: 10.1152/ajprenal.1990.258.4.F831. [DOI] [PubMed] [Google Scholar]
- Sullivan LP, Wallace DP, Clancy RL, Lechene C, Grantham JJ. Cellular electrolyte and volume changes induced by acidosis in the rabbit proximal straight tubule. J Am Soc Nephrol. 1991;2:1030–1040. doi: 10.1681/ASN.V251030. [DOI] [PubMed] [Google Scholar]
- Thomas JA, Buchsbaum RN, Zimniak A, Racker E. Intracellular pH measurements in Ehrlich ascites tumor cells utilizing spectroscopic probes generated in situ. Biochemistry. 1979;18:2210–2218. doi: 10.1021/bi00578a012. [DOI] [PubMed] [Google Scholar]
- Vicario I, Obeso A, Rocher A, López-Lopez JR, González C. Intracellular Ca2+ stores in chemoreceptor cells of the rabbit carotid body: significance for chemoreception. Am J Physiol Cell Physiol. 2000;279:C51–61. doi: 10.1152/ajpcell.2000.279.1.C51. [DOI] [PubMed] [Google Scholar]
- Wang SQ, Zhou ZQ. Alpha-stat calibration of indo-1 fluorescence and measurement of intracellular free calcium in rat ventricular cells at different temperatures. Life Sci. 1999;65:871–877. doi: 10.1016/s0024-3205(99)00317-3. [DOI] [PubMed] [Google Scholar]


