

Abstract
This study was undertaken to compare microsphere and laser Doppler flowmetry techniques for the measurement of cerebral blood flow, to assess the effect of probe implantation at the tip of the sensing probe and to measure brain tissue PO2 (tPO2) in response to acute hypoxia. Fetal sheep of ≈131 days gestation (n = 8) were chronically instrumented with bilateral laser Doppler probes in the parietal cortices and catheters for injection of fluorescent microspheres. Five days after surgery fetuses were subjected to 1 h periods of baseline control breathing, hypoxia and recovery. Microspheres were injected 10 min prior to and 10, 30, 50 and 120 min after initiation of hypoxia. Microspheres were counted in four 12 mm3 tissue samples from each hemisphere, the tip of the laser Doppler probe being positioned in the centre of one of the cubes. The cube containing the probe tip was also subdivided into 4 mm3 pieces of tissue. In response to hypoxia, fetal arterial PO2 declined from 21 ± 2 to 12 ± 1 Torr and brain tissue PO2 fell from 10 ± 1 to a nadir of 1 ± 1 Torr. Each method detected a significant increase in CBF that reached a maximum after 30–45 min, although the increase of flow measured by laser Doppler flowmetry was less than that measured by spheres after 10 and 30 min (P < 0.05). Microspheres did not detect altered flow at the probe tip or heterogeneity of flow in surrounding volumes of cortical tissue. In summary, laser Doppler flowmetry is a useful measure of continuous relative changes of CBF in the chronically instrumented fetal sheep. Flow compensations in acute hypoxia are not adequate to sustain O2 delivery, and other compensations, including reduced metabolic rate, are possible.
During periods of reduced oxygen availability, blood flow to the brain, heart and adrenal glands is increased at the expense of blood flow to other regions (Peeters et al. 1979). Homeostasis is also maintained by local tissue regulation of blood flow and increased oxygen extraction (Jones & Traystman, 1984). Although many circulatory, metabolic and hormonal adaptations to hypoxia have been well described, the mechanisms that regulate fetal cerebral blood flow (CBF) are incompletely understood (Ehmke, 2002).
In the adult, laser Doppler flowmetry (LDF), based on the continuous measurement of red blood cell concentration and velocity, has become widely accepted as a standard method of measuring CBF (Stern et al. 1977). Nonetheless, due partly to the inaccessibility of the chronically instrumented ovine fetus, microspheres (MS) have been the traditional method for measuring absolute blood flow to the brain and other organs. The use of labelled microspheres is restricted to a limited number of intermittent measurements (Rudolph & Heymann, 1967), and microspheres do not allow for monitoring rapid changes in CBF. We have adapted LDF for use in the chronically instrumented ovine fetus, and have demonstrated its utility as a continuous measurement of relative changes in regional CBF in response to hypoxia (Lan et al. 2000). In addition, Muller and coworkers have also implemented LDF in a study of cerebral autoregulation of the ovine fetus and have demonstrated an acceptable correlation between LDF and MS in response to hypercapnia (Muller et al. 2002).
Because of technical limitations of studying the fetus chronically in utero, it has been difficult to study continuous changes in cerebral O2 delivery and intracerebral O2 tensions (tPO2). In addition, direct in vivo measurements of tPO2 have been subject to error because of oxygen consumption at the tip of the sensing probe. Recently however, a non-O2-consuming fluorescent fibre optic probe has been developed and used to measure tPO2 in the adult brain. This probe has the potential to provide important new information concerning tPO2 in the fetus and the responses to hypoxia, an area of particular interest since even normal fetal arterial PO2 is lower than adult tPO2.
The present study was conducted to test the hypothesis that LDF is a valid measure of relative changes in cortical CBF by correlating its results with those of fluorescent microspheres before, during and after a 1 h hypoxic episode. A second purpose was to determine to what extent implantation of the LDF probe itself altered flow measurements and disturbed the uniformity of flow within the surrounding brain tissue. Finally, changes in tPO2 and cerebral O2 delivery and metabolism during hypoxia were evaluated.
Methods
Surgery and instrumentation
Animal protocols were approved by the Institutional Animal Research Committee of Loma Linda University. Seven pregnant Western ewes and their fetuses were obtained from Nebeker Ranch (Lancaster, CA, USA), and instrumented at 125–127 days of gestation (term ≈147 days). Following induction of anaesthesia with thiopental sodium (10 mg kg−1i.v.), the ewe was placed in the supine position and intubated. Anaesthesia was maintained throughout the surgical procedure with inhalation of 1.5–2.5 % halothane in oxygen. All surgical procedures were carried out under aseptic conditions. Only one fetus was instrumented in ewes carrying twins.
The maternal abdominal wall and uterus were incised and the fetal head was delivered. A scalp incision was made rostral to the coronal suture, exposing the right and left parietal bones. A 1.5 mm burr hole was drilled on the right side 5 mm lateral to the sagittal suture and 15 mm caudal to the coronal suture. The tip of the composite tPO2-laser Doppler flow probe (Fig. 1) was inserted to a depth of 5–6 mm below the dura mater into the parasagittal parietal lobe cortex, and fixed to the skull with tissue glue. The probe was supported by a custom-made probe holder, as reported previously (Lan et al. 2000). A thermocouple was placed through a burr hole 5 mm anterior to the laser Doppler probe at a depth of 5 mm. The same steps were repeated on the left side. A polyvinyl catheter was inserted into the sagittal sinus, and secured with tissue glue and latex dental dam. The catheter enabled recording of intracranial pressure and sampling of mixed venous blood from the anterior brain, including the tissue containing the LDF probe. The fetal scalp incision was closed, and the fetal head was replaced in the uterus.
Figure 1. Schematic diagram of 4-channel composite probe consisting of a laser Doppler component with separate emitting and receiving channels, a thermocouple, and a PO2 probe.
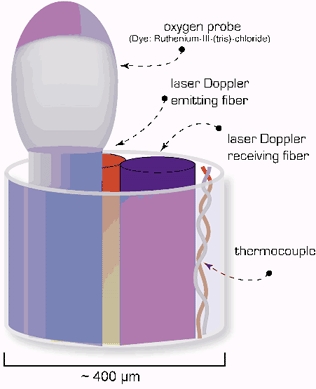
The O2 probe emits short pulses of blue LED light resulting in a fluorescent discharge of a dye on the probe surface. The fluorescence is quenched in proportion to O2 concentration in the tissue. (Adapted from Oxford Optronix Ltd, Oxylite User's Manual.)
Following instrumentation of the head, a polyvinyl catheter and thermocouple were inserted in the fetal brachiocephalic artery for arterial blood sampling and recording of blood pressure, heart rate and core body temperature. For the microsphere injections and withdrawals, catheters were also placed into the fetal brachiocephalic vein, femoral artery and femoral vein, and their tips were advanced into the superior vena cava, descending aorta, and inferior vena cava, respectively. Lastly, a polyvinyl catheter was placed in the amniotic fluid for measurement of amniotic fluid pressure and administration of antibiotics. The uterine wall was closed in layers, and catheters, probes and thermocouples were exteriorized to the ewe's left flank, and stored in a pouch attached to the maternal skin. Postoperatively, the ewe was given 900 000 U penicillin intramuscularly for 3 days, and the fetus was given 500 mg ampicillin and 40 mg gentamicin daily in the amniotic fluid until the experiments were completed. During the postoperative period (0–24 h) the ewes were monitored for signs of discomfort such as restlessness, teeth grinding, abnormal posture or respiratory rate and changes in mental alertness. Any animal that displayed these signs was treated with buprenorphine hydrochloride (Buprenex, Reckitt & Colman Products Ltd, Hull, UK, 0.005 mg kg−1i.m. every 4–6 h). Typically ewes resumed normal feeding 6–12 h following surgery. Fetal arterial blood gases were monitored daily for 5 days of postoperative recovery.
Experimental design
The protocol was designed to compare LDF and MS measurements of cerebral blood flow during three consecutive 60 min periods: control, hypoxia and recovery. Hypoxia was induced by having the ewe breathe 10–12 % O2 in nitrogen. This was administered by passing a 50:50 air:nitrogen gas mixture at 30 l min−1 through a transparent bag placed over the ewe's head. The rate of air flow to the bag was sufficient to prevent carbon dioxide and water vapour accumulation. This procedure is well established in our laboratory and is tolerated by the ewes with minimal signs of distress.
Blood sampling
Fetal arterial (0.3 ml) and sagittal sinus (0.3 ml) samples were collected and analysed for blood gases (ABL3, Radiometer, Copenhagen, Denmark) every 15 min throughout the control, hypoxia and recovery periods. An additional sample to measure blood gas was taken 5 min following the onset of hypoxia to standardize the degree of hypoxia to a fetal arterial PO2 of ≈11 Torr. Values were corrected to the body temperature of the fetus. Haemoglobin concentration and oxyhaemoglobin saturation were measured spectrophotometrically (OSM2 Hemoximeter, Radiometer).
Laser Doppler measurements of cerebral blood flow
Cortical blood flow was measured by use of a laser Doppler flowmeter (Oxford Optronics, Oxford, UK). A pulsatile signal and an in-range red blood cell mass signal indicated that the probe was sampling tissue flow. Right and left cortical blood flow, mean arterial BP, and both core body and cortical temperatures were recorded continuously. Analog outputs were digitized (sampling rate 100 Hz) and stored using an analogue to digital converter (MP100, Biopac Systems Inc., Santa Barbara, CA, USA) and data acquisition software (Acqknowledge v3.5 for Macintosh, Biopac Systems Inc.).
Intracerebral oxygen tension measurements
Continuous monitoring of intracerebral O2 tensions (tPO2) was performed using a fluorescent oxygen probe (Oxylite, Oxford Optronics). The probe provides a mean oxygen tension in tissue overlying the 400 µm diameter probe tip. The probe consisted of a 4-channel composite containing a LDF probe with separate emitting and receiving channels, a fluorescent PO2 probe, and a thermocouple, as shown in Fig.1. Unlike the Clarke electrode, this sensor does not consume O2 because it is based on the fluorescent decay time within brain tissue. The probe emits short pulses of blue LED light resulting in a fluorescent discharge that is quenched by tissue O2. The signal is received by the Oxylite system and the O2 tension using a factory precalibrated algorithm expresses PO2 in Torr. A thermocouple is included in the probe to correct for temperature.
In the present study, we compared LDF signals from the single-fibre probe used in our previous study (Biopac Systems Inc.) (Lan et al. 2000), with the 4-way composite probe described above (n = 4). Analysis of variance revealed no significant difference between the two probe types.
Fluorescent microsphere measurements
Fetal cerebral blood flow was measured using fluorescently labelled microspheres with a diameter of 15.5 ± 0.05 µm during each phase of the study (Interactive Medical Technologies (IMT), Irvine, CA, USA). Spheres were injected on five occasions: 10 min before the onset of hypoxia, again after 10, 30 and 60 min of hypoxic exposure, and finally after 60 min of recovery with the ewe breathing room air. Before the i.v. injection, the spheres were suspended in 10 % dextran with 0.05 % polyoxyethylenesorbitan monooleate (Tween 80), and mixed and vortexed for 10 s. Microspheres were injected over a 15 s period. Two-thirds of the spheres were injected into the inferior vena cava and one-third were injected into the superior vena cava (Rudolph & Heymann, 1967; Ashwal et al. 1980, 1981).
Reference blood samples were taken with a syringe pump (Harvard Apparatus, Holliston, MA, USA), from both the brachiocephalic artery and the femoral artery at a rate of 4.8 ml min−1. Sampling was begun 5–10 s before injection and continued for 90 s. Syringes containing reference blood samples were gently rolled to assure proper mixing of the microspheres, and a 1 ml aliquot of blood was taken for counting; the remainder of the blood was immediately returned to the fetus.
After the experiments were completed, the ewes and fetuses were killed with 15 ml Euthasol solution given intravenously (T61; National Laboratories Corp., Summerville, NJ, USA). At this time, an autopsy was performed to confirm both catheter and probe placement. Upon completion, the fetal carotid arteries were catheterized and the brain which still contained the fibre optic probe tips, was perfused with 300 ml saline followed by 300 ml of 4 % paraformaldehyde. The brain was then removed, weighed, and stored in agar until sectioning. Microspheres were counted in each sectioned sample of cortex and in the blood reference samples at IMT Laboratories using a flow cytometer. Briefly, tissue samples were weighed, digested with strong alkali, vortexed, sonicated and microspheres counted by cytometry. Process control microspheres were added to correct for microspheres lost during the counting procedures.
Microsphere group 1
This group of experiments was undertaken using four probe sites to examine to what extent placement of the laser Doppler probe altered CBF at the probe tip. Brain tissue was sampled in a 12 mm3 cubic region surrounding the tip of the laser Doppler probe. The cube was subdivided by free-hand sectioning into 27 smaller 4 mm3 cubes based on xyz coordinates (see Fig. 5). The tip of the laser Doppler probe was contained in X2Y2Z2, a 4 mm3 cube positioned in the centre of the larger 12 mm3 cube. Absolute flows in X2Y2Z2 were compared to flows in the surrounding 26 cubes to determine the effect of the probe on local blood flow. Flows were expressed per gram of brain tissue to remove variation due to differences in sample size. To assure that each 4 mm3 cube had a minimum of 400 microspheres, the minimum number required to obtain sufficient statistical power for the calculation of absolute flow (Rudolph & Heymann, 1967), 15 million microspheres were injected at each injection time point for this group of experiments.
Figure 5. Blood flow at the probe tip and surrounding tissue as determined by microspheres (n = 4 probe sites).
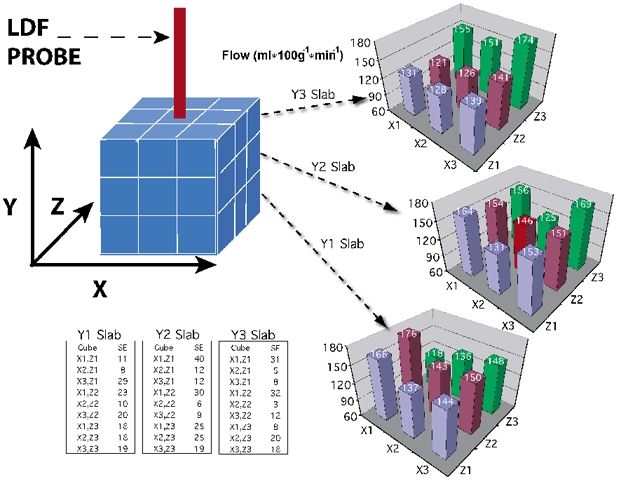
Brain cortices were sectioned into 27 cubes, 4 mm on edge with the probe in the centre cube. Significant differences in flow were not observed 5 days after probe placement. Values indicate millilitres per minute per 100 gram of tissue.
Microsphere group 2
This group of studies was undertaken in seven animals to correlate flow measurements using microspheres (MSs) with those obtained using LDF. 12 mm3 cubes were taken from the region surrounding the probe tip and from immediately surrounding regions (see Fig. 6A). Any white matter included during sectioning was carefully dissected away from each piece and discarded. Each cube was labelled, weighed, and the spheres counted. For these studies about 3 million microspheres were injected at each injection time point. LDF measurements were correlated with MS measurements in the 12 mm3 piece of cortex surrounding the probe tip. In addition, the heterogeneity of flow within the parietal cortex was examined by comparing MS measurements in all four 12 mm3 cubes sampled in from each hemisphere.
Figure 6. Comparison of blood flow as measured by spheres in eight regions of the parietal cortex (n = 7).
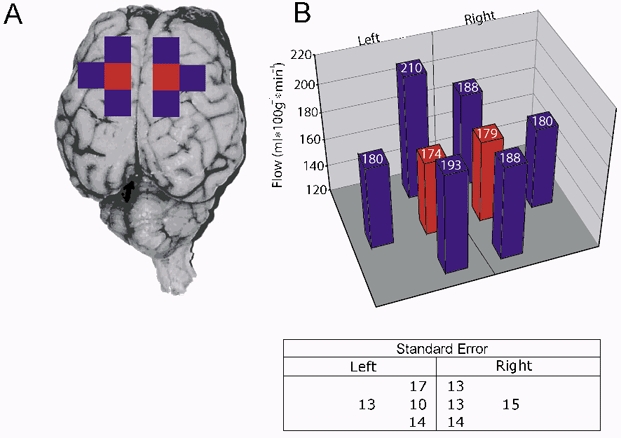
A, regions consisted of neighbouring 12 mm3 cubes from the right and left sides. Significant differences were not detected. B, values indicate millilitres per minute per 100 gram of tissue.
Data acquisition
Laser Doppler flow signals were recorded from both right and left hemispheres of the brain. Analysis of variance did not show systematic differences between hemispheres, and therefore the two results were averaged to provide a mean estimate of changes in flow by this method. Following the experiments, spikes in the laser Doppler data with an increase of > 100 % in less than 1 s were judged as movement artifact and were removed. The LDF, mean arterial blood pressure (MABP), and heart rate data were then resampled in 1 min averages and the values exported to a spreadsheet for analysis. Because LDF provides a relative, not absolute, measure of flow, CBF values for each animal were calculated as a percentage of the average LDF values during the baseline period.
Data analysis
Data were calculated as means ± s.e.m. The significance of changes in CBF from baseline levels were evaluated during hypoxia and recovery using a one-way ANOVA with repeated measures, followed by Fisher's test of least significant difference for multiple-comparisons (DATAMSTR, courtesy of R.A. Brace, University of California at San Diego). To compare the LDF and MS methods at each of the MS injection time points, LDF values were averaged over a 90 s period beginning 45 s before and ending 30 s after each injection. Both LDF and MS values were then normalized as a percentage of baseline for each animal. Differences between the means of the two methods were evaluated at each injection time point by use of two-way ANOVA with matched repeated measures, followed by Bonferroni's post hoc test (Graphpad Prism, Graphpad Software Inc., San Diego, CA, USA). The two methods were also compared by correlation analysis, recognizing error potential in both techniques (DATAMSTR).
The significance of changes in MABP, heart rate, arterial haemoglobin, oxyhaemoglobin saturation, PO2 and PCO2 from baseline values was detected using one-way ANOVA with Dunnett's post hoc test (Graphpad Prism). Statistical significance was assumed at P < 0.05. Correlation of blood flow and cerebral O2 use was performed by least-squares linear regression (DATAMSTR).
Results
Mean arterial blood pressures, heart rate and blood gas values
From a baseline of 47 ± 1 mmHg, MABP rose steadily throughout hypoxia to a peak of 56 ± 2 mmHg at 30 min, and then declined gradually throughout recovery. From a baseline average of 157 beats min−1, heart rate decreased during the first 15 min of hypoxia to a nadir of ≈130 beats min−1, and then increased progressively during recovery to 175 beats min−1. Values for arterial haemoglobin (tHb), PCO2, PO2, and O2 content are presented in Fig. 2. From a baseline of 22 ± 2 Torr, arterial PO2 decreased to 12 ± 1 Torr during hypoxia, and then returned to baseline during recovery. Arterial PCO2 did not change significantly during hypoxia and recovery. From a baseline of 7.34 ± 0.02 arterial pH decreased during hypoxia reaching a nadir of 7.15 ± 0.04 10 min into the recovery period and then returned toward baseline.
Figure 2. Fetal arterial blood gases, pH, O2 content and haemoglobin concentration.
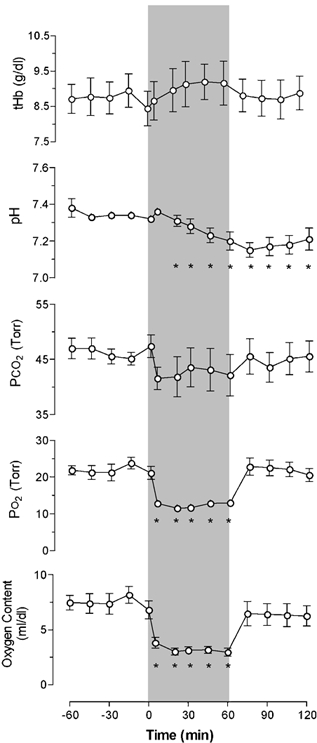
After a 1 h control period, responses to 1 h periods of hypoxia (beginning at time zero and indicated by the shaded band) and recovery are shown (n = 7). Means ± s.e.m.; *P < 0.05.
Changes in CBF and tissue PO2 during hypoxia
The changes in CBF before, during and after hypoxia are shown in Fig. 3A. Flow measured by both methods is shown as a percentage change from baseline (n = 7). During hypoxia, flow as measured by MS increased to 149 ± 8 % within the first 10 min of hypoxia, reaching a maximum of 160 ± 10 % at 30 min. At the end of the 60 min hypoxic period, MS flow was 153 ± 14 %, and at the end of recovery it had declined to 128 ± 14 % of baseline. LDF increased gradually during hypoxia, reaching a maximum of 140 ± 8 % by 45 min, and gradually returned to baseline during the first 30 min of recovery to an average of 115 ± 7 % during the final 30 min of recovery. The rise in CBF during hypoxia, as measured by LDF, was less than that measured by MS, and the differences were significantly different at 10 and 30 min of hypoxia (P < 0.05). There was no significant difference between the two methods at either the end of hypoxia or at 60 min of recovery.
Figure 3. Responses of cerebral blood flow (CBF) and cerebral PO2 to 1 h periods of hypoxia and recovery in seven near-term fetal sheep.
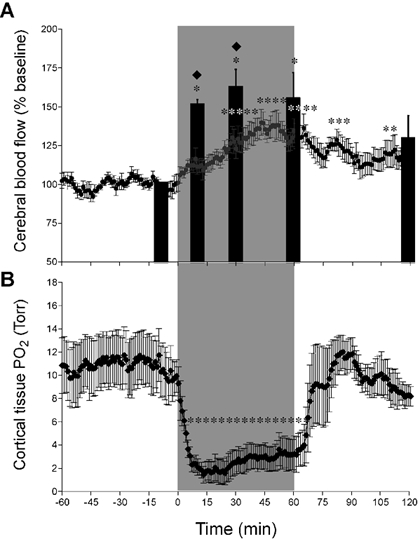
A, results shown as a percentage of baseline; * significantly different from baseline, P < 0.05. Microsphere determinations were made at −10, 10, 30, 60 and 120 min after onset of hypoxia, and results are shown as filled columns. Running 1 min averages of laser Doppler results are shown throughout the experiment. Results of the two methods differed measurably after 10 and 30 min (♦P < 0.05), but were indistinguishable after 60 and 120 min. B, O2 tension in cortical brain tissue in response to a 1 h period of moderate hypoxia followed by a 1 h period of recovery (n = 4). * Significant difference from baseline (P < 0.05). Note the markedly low levels of tPO2 soon after the onset of hypoxia and the increase thereafter in association with the progressive increase of CBF.
Changes in tPO2 and CBF are presented in Fig. 3B. Initiation of hypoxia was associated with a reduction of tPO2 from 11 ± 2 to a nadir of 1.4 ± 0.7 Torr at 13 min (P < 0.01, n = 4) and then increased gradually to average 3.1 ± 1.3 Torr during the last 15 min of the hypoxic interval. tPO2 returned to baseline levels immediately upon completion of hypoxia, and remained there throughout the recovery period. CBF as measured by LDF at the site of the fluorescent O2 probe gradually rose for the first 30 min of the hypoxic interval, during which time tPO2 increased by 1.1 Torr.
Correlation of laser Doppler flowmetry and microspheres
The correlation between LDF and MS is shown in Fig. 4. The horizontal axis shows flows measured by MS while the vertical axis shows flow measured by LDF as an average during a 90 s period at the time of the MS injection. No change in LDF flow was observed during MS injections. Both MS and LDF results were normalized as a percentage of baseline values. Regression analysis yielded the following equation: y = 0.73x + 24.7 (r = 0.89, P < 0.001). The slope of the line was less than unity, indicating that measured increases in MS flow were somewhat greater than those measured by LDF.
Figure 4. Relationship between laser Doppler flowmetry (LDF) and microsphere (MS) methods of measuring CBF.
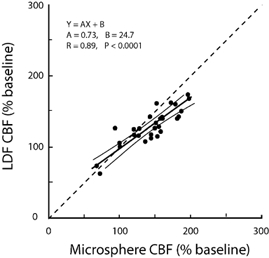
The slope of the regression was significantly less than unity (dashed line) indicating a tendency for MS to overestimate and/or LDF to underestimate increases of flow.
Alteration of flow at the probe tip
LDF measures blood flow in a 1–2 mm3 volume of tissue at the tip of the probe, as described for Microsphere group 1 in Methods. To evaluate the effect of probe insertion on measured blood flow, flows were compared in different volumes within a 12 mm3 cube of tissue containing the probe tip positioned at its centre, as shown in Fig. 5. The 12 mm3 cube was subdivided into 27 smaller 4 mm3 cubes with the probe tip in the centre cube. MS measurements of flow to each of the cubes were not significantly different, including the cube that had contained the tip of the LDF probe (Fig. 5). This result suggests that probe placement had not altered flow appreciably when examined 5 days after surgery.
Heterogeneity of flow within the cortex
To examine whether LDF measurements from the tip of the probe are representative of blood flow to the parietal cortex in general, blood flow was evaluated using MSs in four individual 12 mm3 cubes from each hemisphere, as shown in Fig. 6A. The cube containing the probe tip, represented in red, was compared with neighbouring cubes: lateral, anterior and posterior (n = 7). There was no significant difference in blood flow among the cubes, suggesting that the distribution of flow within the cortex was uniform within the errors of the method and when assessed in relatively large tissue samples (Fig. 6B).
Relationship between cerebral blood flow and oxygenation
Figure 7 shows the results of CBF, as measured using both LDF and MSs, as a function of arterial oxygen content (Ca,O2). Regression analysis of CBF vs. Ca,O2 showed that a curvilinear relationship fitted the data significantly better than a linear relationship. The equations of fit are shown. No measurable difference was found between the correlation of LDF with Ca,O2 and that of MS and Ca,O2.
Figure 7. Relationship between arterial oxygen content (Ca,O2) and cerebral blood flow (CBF), expressed as a percentage of baseline.

Data were obtained from baseline, hypoxic and recovery periods from seven fetal sheep. Regression equations for both methods are shown. Results of laser Doppler and microsphere methods were similar and showed a progressive influence of Ca,O2 as values declined below ≈4 ml dl−1.
Cerebral oxygen delivery and consumption
Cerebral O2 delivery, as calculated by MS and LDF measurements, is shown in Fig. 8A and B (n = 5). At 10, 30 and 60 min of hypoxia, O2 delivery was significantly reduced when calculated from the measurements of either method, and returned to baseline values during the recovery period. Cerebral O2 consumption calculations for both methods, as shown in Fig. 8C and D, decreased in each animal during hypoxia; however, the change was not significant.
Figure 8. O2 delivery to the brain and O2 consumption by the brain, as calculated using flows obtained with laser Doppler flowmetry (A and C) and microspheres (B and D).
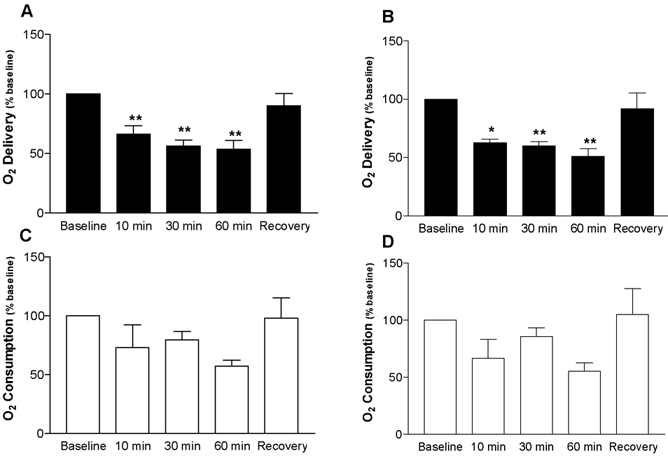
A, O2 delivery, calculated as the product of CBF, calculated as a percentage of baseline, and arterial oxygen content, decreased using data from both methods (n = 5). B, oxygen consumption, calculated as the product of CBF, calculated as a percentage of baseline and arterial - sagittal sinus O2 content also declined, but changes did not reach significance.
Discussion
The present studies disclosed several important findings. First, a reasonably good correlation was observed between the LDF and MS methods in the measurement of changes in CBF in response to hypoxia. The agreement was quite close at the ends of the hypoxic and recovery periods; nonetheless, measurable differences were noted early in the hypoxic period. Second, the placement of the laser Doppler probe did not significantly alter flow at the probe tip relative to immediate surrounding tissue. Third, non-uniformity of flow could not be detected when results were compared from the four 12 mm3 cubes of tissue taken from each parietal cortex, suggesting that flow as measured by LDF was representative of flow to the cortex. Last, using fluorescent tPO2 probes, local cortical oxygen tension has been measured for the first time in the ovine fetus without the error of O2 consumption at the tip of the sensing probe. In response to hypoxia, tPO2 declined to remarkably low levels of 1–2 Torr, with a tendency to increase somewhat to 2–3 Torr as the 1 h period of hypoxia progressed. The results, in general, were reassuring regarding the validity and usefulness of LDF and fluorescent PO2 probes in the study of chronically instrumented fetal sheep. Nonetheless, they raise new questions regarding the maintenance of O2 delivery and consumption in the fetal brain during hypoxic stress.
CBF responses to hypoxia
Fetal hypoxia leads to increases of arterial blood pressure and decreases of cerebral vascular resistance, resulting in an increase in CBF. In the present study, maximal increases in CBF during hypoxia were similar for MS and LDF, and were in agreement with previous reports (Ashwal et al. 1981; Jensen et al. 1999). However, despite similarities in the maximal response to hypoxia, the two methods differed significantly during the first 30 min of hypoxia, with LDF flow increases being appreciably less than those measured with MSs. This slow rise in CBF measured by LDF is similar to that measured in the newborn rat (Ioroi et al. 1998), but differs from the more rapid rise in adult dogs (Kutzsche et al. 1999).
Correlation of laser Doppler flowmetry and microspheres
Changes in LDF and MS flow were compared by correlation analysis, as shown in Fig. 4. Although analysis yielded a strong correlation coefficient (r = 0.89), the calculated regression slope deviated significantly from the line of identity. The deviation may be due to an underestimation of the true flow increases as measured by LDF, and/or an overestimation of true flow increases by MSs. The reason for the deviation is not known and cannot be explained from the present study.
The present finding that increases in CBF are underestimated by LDF relative to MS measurements has been observed in most previous LDF-MS correlation studies conducted in both adult (Eyre et al. 1988; Lindsberg et al. 1989; Kirkeby et al. 1995) and fetal (Muller et al. 2002) animals. Although the reason for this difference between the two methods is not known, there are a number of possibilities. The most commonly discussed reasons relate to the fact that microspheres estimate total arteriolar flow entering the brain (Kirkeby et al. 1995), whereas the LDF probe senses red blood cell motion in a relatively small volume of tissue (1–2 mm3)(Stern et al. 1977) containing numerous capillaries, venules and arterioles (Eyre et al. 1988). Studies in adult animals have demonstrated that LDF correlates well with methods that measure flow at the capillary level, such as hydrogen clearance (Skarphedinsson et al. 1988; Haberl et al. 1989) and autoradiography (Dirnagl et al. 1989). It is known that the spatial density of red blood cells increases during periods of increased blood flow, a phenomenon known as the Fahraeus effect (Pries et al. 1986; Bereczki et al. 1993; Hudetz et al. 1996; Krolo & Hudetz, 2000). Therefore, changes in MS flow may be different from changes in red blood cell flow during periods of increased flow. Arteriovenous shunting of microspheres in the baseline period is another possibility, but seems unlikely because there is no current evidence that spheres escape entrapment in the cerebral circulation. Another possibility is changes in the linearity of movement of red blood cells within the capillaries, since it is known that the spatial and temporal homogeneity of red blood cell movement in the capillaries of the brain increases with hypoxia (Gobel et al. 1990; Villringer et al. 1994; Hudetz et al. 1996, 1997; Kuschinsky, 1996). Thus flow signals from LDF might be misleadingly high during baseline periods, and increases of flow during hypoxia might not be fully appreciated (Hudetz et al. 1998). Despite the differences between LDF and MS measurements, the agreement between the methods at 60 min and during the recovery period provides strong support for the use of LDF as a useful tool in the study of fetal CBF.
Heterogeneity of flow within the cortex
One concern with the use of LDF probes implanted in the brain tissue is the possibility of vascular damage and scarring around the probe tip. The present study did not reveal evidence that probe placement altered flow relative to that in the surrounding volumes of tissue. This agrees with earlier findings wherein gliosis formation around the probe tip was not thick enough to measurably alter flows in chronically instrumented fetal sheep (Muller et al. 2002). A less invasive alternative to the insertion of probes into the tissue would be to use surface probes. Recent studies in the pig (Kirkeby et al. 1995) and fetal sheep (Muller et al. 2002) have compared probes placed on the surface of the cortex and intracerebral probes and significant differences were not found at the different locations compared with measurements using MSs.
An inherent limitation of the LDF method is that local flow measurements are usually derived from a tissue sample that is small relative to the tissue of interest. Therefore, it is possible for temporal and spatial heterogeneities in blood flow to result in a dissociation of LDF measurements and total flow to the cortex. Results of the present study suggest that LDF probes with our placement coordinates provided an accurate representation of changes in flow throughout the parietal cortex in response to hypoxia. Previous MS studies in the fetal sheep have also found spatial homogeneity of flow in the cortex during hypoxia (Ashwal et al. 1981). In addition, studies in the adult rat have demonstrated an increase in the homogeneity of flow in the cerebral cortex in response to hypoxia and hypercapnia (Gobel et al. 1990; Villringer et al. 1994; Kuschinsky, 1996; Vogel & Kuschinsky, 1996; Vogel et al. 1997). On the other hand, sampling of smaller volumes of tissue approaching capillary dimensions would be anticipated to show increasing spatial and temporal heterogeneities.
Intracerebral oxygen tensions
Non-oxygen consuming PO2 probes have determined tPO2 tensions to range from 20 to 40 Torr in the adult (Erecinska & Silver, 2001). Until the present study, fetal tPO2 has not been measured in utero using this technology, due largely to the inaccessibility of the fetal brain for chronic instrumentation. In the present study, a pronounced fall in tPO2 from ≈11 to ≈1.5 Torr was observed within 15 min after the onset of hypoxia. These remarkably low tPO2 levels were coincident with significant decreases in O2 delivery. The fact that there are significant decreases in cerebral O2 consumption is notable, since the KM of cytochrome for O2 is ≈1–3 Torr (Jones & Kennedy, 1982). Subsequently, during the last 30 min of hypoxia, tPO2 increased to ≈3 Torr. These increases in tPO2 as hypoxia progressed occurred despite any measurable increase in O2 delivery and may be an indication of adaptive decreases in cerebral oxygen consumption.
Cerebral oxygen delivery and consumption
During hypoxia O2 delivery to the brain, as calculated using both MSs and LDF, decreased 45–50 % (Fig. 8). This result is in accord with earlier studies in which fetuses were subjected to a comparable degree of hypoxia (Jones & Traystman, 1984). The decrease in O2 delivery was accompanied by a reduction in cerebral O2 consumption in each of the five animals studied, but the reduction did not reach statistical significance. This tendency for O2 consumption to decrease is in agreement with the findings of Richardson and coworkers who found less time was spent in low voltage electrocorticogram activity (higher energy requirement) during hypoxia (Richardson et al. 1992). Moreover, the rise in tPO2 during the hypoxic period, despite a lack of increase in O2 delivery, may reflect compensations such as reduced metabolic rate and increased CBF that would tend to restore the O2 delivery/O2 use ratio towards normal as the hypoxic period progresses. Further studies are required to evaluate the metabolic responses of the fetal brain that enable it to withstand such low O2 tensions without significant injury.
Conclusions
The present study provides the first real-time measurements of intracerebral PO2 and CBF in the chronically instrumented, late gestation fetal sheep. CBF increases 40–60 % in response to 60 min of acute hypoxia as measured by LDF and MS, while cortical tissue PO2 decreases from ≈11 to 1–3 Torr. Results of the two methods of CBF measurement correlate closely with one another, although MS measurements overestimate flow relative to LDF early in a hypoxic period. Intracortical placement of the LDF probe does not alter flow at the probe tip when measured 5 days after surgery. Fetal parietal cortical flow is homogeneous among 12 mm3 cubes of tissue. The combined use of LDF and intracerebral PO2 probes may be useful in understanding the cerebral adaptations to acute hypoxia that tend to maintain the oxygen supply/oxygen use ratio.
Acknowledgments
The expert technical assistance of Shannon Bragg is gratefully acknowledged. This work was supported in part by Grants from the USPHS NIH (HL 65494 to G.G.P. and HD 03708 to L.D.L.) and from the Department of the Army and the National Medical Technology Testbed (NMTB), Cooperative Agreement Number DAMD17-97-2-7016. The information does not necessarily reflect the position or policy of the government or NMTB, and no official endorsement should be inferred.
References
- Ashwal S, Majcher JS, Longo LD. Patterns of fetal lamb regional cerebral blood flow during and after prolonged hypoxia: studies during the posthypoxic recovery period. Am J Obstet Gynecol. 1981;139:365–372. doi: 10.1016/0002-9378(81)90311-2. [DOI] [PubMed] [Google Scholar]
- Ashwal S, Majcher JS, Vain N, Longo LD. Patterns of fetal lamb regional cerebral blood flow during and after prolonged hypoxia. Pediatr Res. 1980;14:1104–1110. doi: 10.1203/00006450-198010000-00003. [DOI] [PubMed] [Google Scholar]
- Bereczki D, Wei L, Otsuka T, Acuff V, Pettigrew K, Patlak C, Fenstermacher J. Hypoxia increases velocity of blood flow through parenchymal microvascular systems in rat brain. J Cereb Blood Flow Metab. 1993;13:475–486. doi: 10.1038/jcbfm.1993.62. [DOI] [PubMed] [Google Scholar]
- Dirnagl U, Kaplan B, Jacewicz M, Pulsinelli W. Continuous measurement of cerebral cortical blood flow by laser-Doppler flowmetry in a rat stroke model. J Cereb Blood Flow Metab. 1989;9:589–596. doi: 10.1038/jcbfm.1989.84. [DOI] [PubMed] [Google Scholar]
- Ehmke H. Developmental physiology of the cardiovascular system. Am J Physiol Regul Integr Comp Physiol. 2002;282:R331–333. doi: 10.1152/ajpregu.00599.2001. [DOI] [PubMed] [Google Scholar]
- Erecinska M, Silver IA. Tissue oxygen tension and brain sensitivity to hypoxia. Respir Physiol. 2001;128:263–276. doi: 10.1016/s0034-5687(01)00306-1. [DOI] [PubMed] [Google Scholar]
- Eyre JA, Essex TJ, Flecknell PA, Bartholomew PH, Sinclair JI. A comparison of measurements of cerebral blood flow in the rabbit using laser Doppler spectroscopy and radionuclide labelled microspheres. Clin Phys Physiol Meas. 1988;9:65–74. doi: 10.1088/0143-0815/9/1/006. [DOI] [PubMed] [Google Scholar]
- Gobel U, Theilen H, Kuschinsky W. Congruence of total and perfused capillary network in rat brains. Circ Res. 1990;66:271–281. doi: 10.1161/01.res.66.2.271. [DOI] [PubMed] [Google Scholar]
- Haberl RL, Heizer ML, Marmarou A, Ellis EF. Laser-Doppler assessment of brain microcirculation: effect of systemic alterations. Am J Physiol. 1989;256:H1247–1254. doi: 10.1152/ajpheart.1989.256.4.H1247. [DOI] [PubMed] [Google Scholar]
- Hudetz AG, Biswal BB, Feher G, Kampine JP. Effects of hypoxia and hypercapnia on capillary flow velocity in the rat cerebral cortex. Microvasc Res. 1997;54:35–42. doi: 10.1006/mvre.1997.2023. [DOI] [PubMed] [Google Scholar]
- Hudetz AG, Feher G, Kampine JP. Heterogeneous autoregulation of cerebrocortical capillary flow: evidence for functional thoroughfare channels? Microvasc Res. 1996;51:131–136. doi: 10.1006/mvre.1996.0015. [DOI] [PubMed] [Google Scholar]
- Ioroi T, Yonetani M, Nakamura H. Effects of hypoxia and reoxygenation on nitric oxide production and cerebral blood flow in developing rat striatum. Pediatr Res. 1998;43:733–737. doi: 10.1203/00006450-199806000-00004. [DOI] [PubMed] [Google Scholar]
- Jensen A, Garnier Y, Berger R. Dynamics of fetal circulatory responses to hypoxia and asphyxia. Eur J Obstet Gynecol Reprod Biol. 1999;84:155–172. doi: 10.1016/s0301-2115(98)00325-x. [DOI] [PubMed] [Google Scholar]
- Jones DP, Kennedy FG. Intracellular oxygen supply during hypoxia. Am J Physiol. 1982;243:C247–253. doi: 10.1152/ajpcell.1982.243.5.C247. [DOI] [PubMed] [Google Scholar]
- Jones MD, Jr, Traystman RJ. Cerebral oxygenation of the fetus, newborn, and adult. Semin Perinatol. 1984;8:205–216. [PubMed] [Google Scholar]
- Kirkeby OJ, Rise IR, Nordsletten L, Skjeldal S, Hall C, Risoe C. Cerebral blood flow measured with intracerebral laser-Dopplerflow probes and radioactive microspheres. J Appl Physiol. 1995;79:1479–1486. doi: 10.1152/jappl.1995.79.5.1479. [DOI] [PubMed] [Google Scholar]
- Krolo I, Hudetz AG. Hypoxemia alters erythrocyte perfusion pattern in the cerebral capillary network. Microvasc Res. 2000;59:72–79. doi: 10.1006/mvre.1999.2185. [DOI] [PubMed] [Google Scholar]
- Kuschinsky W. Capillary perfusion in the brain. Pflugers Arch. 1996;432:R42–46. [PubMed] [Google Scholar]
- Kutzsche S, Kirkeby OJ, Rise IR, Saugstad OD. Effects of hypoxia and reoxygenation with 21 % and 100 %-oxygen on cerebral nitric oxide concentration and microcirculation in newborn piglets. Biol Neonate. 1999;76:153–167. doi: 10.1159/000014155. [DOI] [PubMed] [Google Scholar]
- Lan J, Hunter CJ, Murata T, Power GG. Adaptation of laser-Doppler flowmetry to measure cerebral blood flow in the fetal sheep. J Appl Physiol. 2000;89:1065–1071. doi: 10.1152/jappl.2000.89.3.1065. [DOI] [PubMed] [Google Scholar]
- Lindsberg PJ, O'Neill JT, Paakkari IA, Hallenbeck JM, Feuerstein G. Validation of laser-Doppler flowmetry in measurement of spinal cord blood flow. Am J Physiol. 1989;257:H674–680. doi: 10.1152/ajpheart.1989.257.2.H674. [DOI] [PubMed] [Google Scholar]
- Muller T, Lohle M, Schubert H, Bauer R, Wicher C, Antonow-Schlorke I, Sliwka U, Nathanielsz PW, Schwab M. Developmental changes in cerebral autoregulatory capacity in the fetal sheep parietal cortex. J Physiol. 2002;539:957–967. doi: 10.1113/jphysiol.2001.012590. [DOI] [PMC free article] [PubMed] [Google Scholar]
- Peeters LL, Sheldon RE, Jones MD, Jr, Makowski EL, Meschia G. Blood flow to fetal organs as a function of arterial oxygen content. Am J Obstet Gynecol. 1979;135:637–646. doi: 10.1016/s0002-9378(16)32989-1. [DOI] [PubMed] [Google Scholar]
- Pries AR, Ley K, Gaehtgens P. Generalization of the Fahraeus principle for microvessel networks. Am J Physiol. 1986;251:H1324–1332. doi: 10.1152/ajpheart.1986.251.6.H1324. [DOI] [PubMed] [Google Scholar]
- Richardson BS, Carmichael L, Homan J, Patrick JE. Electrocortical activity, electroocular activity, and breathing movements in fetal sheep with prolonged and graded hypoxemia. Am J Obstet Gynecol. 1992;167:553–558. doi: 10.1016/s0002-9378(11)91452-5. [DOI] [PubMed] [Google Scholar]
- Rudolph AM, Heymann MA. The circulation of the fetus in utero. Methods for studying distribution of blood flow, cardiac output and organ blood flow. Circ Res. 1967;21:163–184. doi: 10.1161/01.res.21.2.163. [DOI] [PubMed] [Google Scholar]
- Skarphedinsson JO, Harding H, Thoren P. Repeated measurements of cerebral blood flow in rats. Comparisons between the hydrogen clearance method and laser Doppler flowmetry. Acta Physiol Scand. 1988;134:133–142. doi: 10.1111/j.1748-1716.1988.tb08469.x. [DOI] [PubMed] [Google Scholar]
- Stern MD, Lappe DL, Bowen PD, Chimosky JE, Holloway GA, Jr, Keiser HR, Bowman RL. Continuous measurement of tissue blood flow by laser-Doppler spectroscopy. Am J Physiol. 1977;232:H441–448. doi: 10.1152/ajpheart.1977.232.4.H441. [DOI] [PubMed] [Google Scholar]
- Villringer A, Them A, Lindauer U, Einhaupl K, Dirnagl U. Capillary perfusion of the rat brain cortex. An in vivo confocal microscopy study. Circ Res. 1994;75:55–62. doi: 10.1161/01.res.75.1.55. [DOI] [PubMed] [Google Scholar]
- Vogel J, Kuschinsky W. Decreased heterogeneity of capillary plasma flow in the rat whisker-barrel cortex during functional hyperemia. J Cereb Blood Flow Metab. 1996;16:1300–1306. doi: 10.1097/00004647-199611000-00026. [DOI] [PubMed] [Google Scholar]
- Vogel J, Waschke KF, Kuschinsky W. Flow-independent heterogeneity of brain capillary plasma perfusion after blood exchange with a Newtonian fluid. Am J Physiol. 1997;272:H1833–1837. doi: 10.1152/ajpheart.1997.272.4.H1833. [DOI] [PubMed] [Google Scholar]