

Abstract
The central role of the Ubiquitin–proteasome system in the loss of skeletal muscle protein in many wasting conditions has been well established. However, it is unclear what factors are responsible for the suppression of this system during periods of protein gain. Thus, the aim of these studies was to examine the short-term effects of insulin release and nutrients on skeletal muscle protein turnover in young rats starved for 48 h, and then infused intravenously with amino acids (AA), or fed an oral diet. Forty-eight hours of starvation (i.e. prolonged starvation in young rats) decreased muscle protein synthesis and increased proteasome-dependent proteolysis. Four-hour AA infusion and 4 h of refeeding increased plasma insulin release and AA concentrations, and stimulated muscle protein synthesis, but had no effect on either total or proteasome-dependent proteolysis, despite decreased plasma corticosterone concentrations. Both muscle proteasome-dependent proteolysis and the rate of ubiquitination of muscle proteins were not suppressed until 10 h of refeeding. The temporal response of these two measurements correlated with the normalised expression of the 14-kDa E2 (a critical enzyme in substrate ubiquitination in muscle) and the expression of the MSS1 subunit of the 19S regulatory complex of the 26S proteasome. In contrast, the starvation-induced increase in mRNA levels for 20S proteasome subunits was normalised by refeeding within 24 h in muscle, and 6 h in jejunum, respectively. In conclusion, unlike protein synthesis, skeletal muscle proteasome-dependent proteolysis is not acutely responsive in vivo to insulin, AA, and/or nutrient intake in refed starved rats. This suggests that distinct and perhaps independent mechanisms are responsible for the nutrient-dependent regulation of protein synthesis and Ubiquitin–proteasome-dependent proteolysis following a prolonged period of catabolism. Furthermore, factors other than the expression of Ubiquitin–proteasome pathway components appear to be responsible for the suppression of skeletal muscle proteasome-dependent proteolysis by nutrition.
Feeding stimulates anabolism through a suppression of proteolysis and a stimulation of protein synthesis (Garlick et al. 1998), although the precise mechanisms for these effects have still to be elucidated. Insulin itself has little effect on skeletal muscle protein synthesis at physiological concentrations, but has synergistic effects with amino acids (AA) (Bennet et al. 1990; Biolo et al. 1995; Wolfe, 2000). In contrast, studies in vitro and in vivo have provided conflicting results about the relative role of AA and insulin in regulating the suppression of muscle proteolysis (Bennet et al. 1990; Louard et al. 1992; Mortimore et al. 1992; Watt et al. 1992; Biolo et al. 1995; Wolfe, 2000).
The knowledge of the cellular and molecular mechanisms of proteolysis has increased dramatically in recent years (Attaix et al. 2001). However, there is very little information about the in vivo hormonal and nutritional regulation of the different proteolytic pathways in mammalian tissues (Combaret et al. 2001). Food intake is known to inhibit lysosomal proteolysis in liver (Mortimore et al. 1992) and skeletal muscle (Lowell et al. 1986; Attaix & Taillandier, 1998). This effect is thought to be mediated by insulin and/or AA (Mortimore et al. 1992). However, the lysosomal and the Ca2+-dependent proteolytic processes together only account for 10–20 % of total proteolysis (Attaix & Taillandier, 1998). These systems degrade preferentially soluble proteins (Mitch & Goldberg, 1996; Attaix & Taillandier, 1998) and may play a role in the disassembly of myofibrils (especially m-calpain, see Huang & Forsberg, 1998). In contrast, the Ubiquitin–proteasome-dependent pathway is the major proteolytic process that degrades myofibrillar proteins (Attaix & Taillandier, 1998; Mitch & Goldberg, 1996).
The Ubiquitin–proteasome pathway is also a major proteolytic process in non-muscle cells and plays a key role in the control of major biological events such as cell-cycle progression, transcriptional control, signal transduction, receptor downregulation and Class I antigen presentation (Peters et al. 1998). The pathway can be functionally divided into two steps: (1) covalent attachment of polyubiquitin chains to proteins that are to be degraded; and (2) degradation of the targeted proteins by the 26S proteasome. Polyubiquitination is a complex and multiple-step process that requires ATP, the ubiquitin-activating enzyme (E1), and one of the ubiquitin-conjugating enzymes (E2), which functions either alone or in the presence of a ubiquitin-protein ligase (E3) responsible for substrate recognition (Attaix et al. 2001; Pickart, 2001). Following polyubiquitination, the targeted proteins are then recognised and degraded by the 26S proteasome. This large proteolytic complex consists of a central barrel-shaped proteolytic core, the 20S proteasome, and two 19S regulatory complexes, bound to both ends of the 20S particle. The 19S complex regulatory complex confers ATP and ubiquitin dependency to proteolysis and stimulates the proteolytic and peptidase activities of the 20S proteasome by various mechanisms that include the gating of the channel to the 20S proteolytic core (Voges et al. 1999).
There is now strong evidence that the muscle wasting in catabolic states is mainly due to upregulation of this pathway (Mitch & Goldberg, 1996; Attaix & Taillandier, 1998). Incubation of muscles from insulin deficient (Price et al. 1996), burned (Fang et al. 1998), septic, denervated or thyroid hormone-treated (Tawa et al. 1997), and acidotic (Bailey et al. 1996) rats with specific proteasome inhibitors almost completely blocks the increase in total and myofibrillar protein breakdown that is associated with these conditions. In addition, there is an increased expression of ubiquitin, the 14-kDa E2 and subunits of the 20S proteasome in atrophying rodent muscles (Mitch & Goldberg, 1996; Attaix & Taillandier, 1998). Similar adaptations occur in muscle biopsies from weight-losing or cachectic patients (Llovera et al. 1988; Mansoor et al. 1996; Tiao et al. 1997; Williams et al. 1999), suggesting that the activation of the pathway is responsible for muscle wasting in several human diseases.
Early studies in rats have shown indirectly that this system is upregulated in muscle during starvation and normalised within 1 day of refeeding (Wing & Banville, 1994; Medina et al. 1995; Wing et al. 1995). However, the precise factors (e.g. hormones and/or nutrients) that are responsible for the suppression of the elevated proteolysis by refeeding are still obscure. Therefore, the aim of this study was to examine the short-term effects of hormones and nutrients on the regulation of the Ubiquitin–proteasome system. The catabolic response typical of nutrient deprivation and of various catabolic states involves very similar, if not identical, mechanisms (Attaix & Taillandier, 1998; Mitch & Goldberg, 1996). Thus, the elucidation of mechanisms that suppress the elevated Ubiquitin–proteasome proteolysis may provide insights into the resistance of the normal anabolic drive of nutrition that occurs in traumatised and critically ill patients. In the present study, the rates of proteolysis were measured in vitro because the incubated muscle technique is the only system where it is possible to simultaneously determine protein synthesis and protein degradation rates, and also at the same time measure the contribution of the different proteolytic pathways to the rates of overall proteolysis. Although incubated muscles are in a highly catabolic state, there is a large body of evidence that in vitro measurements qualitatively reflect rates of protein turnover that were present in the intact animal before the incubation period.
Methods
Animals and experimental design
The experiments were conducted in accordance with the French National Research Council's Guidelines for the Care and Use of Laboratory Animals and conformed with the principles of the UK Animals (Scientific Procedures) Act 1986. In Experiment 1, the effect of 4 h intravenous AA infusion on muscle protein turnover was investigated. Forty-eight hour-starved young male Wistar rats (Iffa-Credo, L'Arbresle, France; 60–70 g) were anaesthetised with urethane (1.7 g (kg body weight)−1, i.p.) prior to insertion of a catheter into the left internal jugular vein. Infusion (0.35 ml h−1) of AA (76.3 µmol h−1) or electrolytes (control group) was started and continued for 4 h while the rats were anaesthetised. The concentration of AA in the infusion solution was similar to commercially available parenteral nutrition solutions (mm): 15.5 threonine, 23.3 valine, 13.6 methionine, 15.6 isoleucine, 23.2 leucine, 0.7 tyrosine, 9.2 phenylalanine, 17.3 lysine, 13.1 histidine, 14.7 arginine, 2.9 tryptophan, 47.9 alanine, 6.0 proline, 1.2 cystine, 1.9 glutamate, 2.1 aspartate, 3.9 serine, and 6.5 glycine. This solution and the control infusate contained the following electrolytes (mm): 40.3 sodium chloride, 40.2 potassium chloride, 2.3 calcium chloride, 15.7 potassium phosphate, 3.6 magnesium sulphate. In Experiment 2, rats of similar age and weight to those in Experiment 1 were either starved for 48 h, or starved for 48 h and then refed a standard growth-maintenance diet (20 % protein, 4 % fat) ad libitum for 4, 6, 10 and 24 h. At the end of these periods, the rats were anaesthetised with pentobarbitone (3.6 mg (kg body weight)−1, i.p.) and killed by cervical dislocation. In both experiments, the animals were kept in a temperature- and humidity-controlled room (22 ± 1 °C) with a 12 h:12 h light:dark cycle. These animals were compared to aged-matched fed rats given a standard growth-maintenance diet ad libitum.
Rates of protein turnover
Immediately following killing (by cervical dislocation) in both Experiments 1 and 2, extensor digitorum longus (EDL) muscles were carefully dissected and attached to inert supports at resting length. Muscles were incubated at 37 °C in a standard Krebs- Henseleit medium ((mm): 120 NaCl, 25 NaHCO3, 4.8 KCl, 1.2 MgSO4, 1.2 KH2PO4, 0.5 CaCl2, pH 7.4) containing 5 mm glucose, equilibrated and maintained under pressure with O2-CO2 (19:1). After 30 min of pre-incubation, the muscles were transferred to a fresh medium and incubated for a further 2 h. Insulin and AA were not added to the pre-incubation and incubation media. All incubation experiments were performed at least twice.
The rate of protein synthesis was determined by incubating the muscles in a medium containing 0.5 mm [U-14C]phenylalanine (Amersham Corporation, Amersham, UK; specific radioactivity in the medium 500 d.p.m. nmol−1), as described previously (Temparis et al. 1994; Voisin et al. 1996). Muscle protein mass was determined using the bicinchoninic acid method (Smith et al. 1985). Rates of phenylalanine incorporation were converted into tyrosine equivalents by multiplying by 0.8, the molar ratio of tyrosine to phenylalanine in rat muscle proteins (Tischler et al. 1982).
Net protein breakdown was measured as the rate of net tyrosine release into the medium. Total rates of protein breakdown were calculated by adding the rate of protein synthesis to the rate of net tyrosine release (Tischler et al. 1982). Alternatively, total rates of proteolysis were measured as net rates of tyrosine release in the presence of the protein synthesis inhibitor, cycloheximide (0.5 mm). Both techniques provided almost identical data (P > 0.05, data not shown), as described previously (Tischler et al. 1982). Non-lysosomal and Ca2+-independent proteolysis was measured in the presence of 50 µm E64 and 10 mm methylamine in a Ca2+-free medium (Temparis et al. 1994; Bailey et al. 1996; Voisin et al. 1996). To measure proteasome-dependent proteolysis the EDL muscle from one limb was incubated in the presence of 50 µm MG132 and the contralateral muscle in the absence of MG132, both in the presence of lysosomal and calpain inhibitors, as MG132 also inhibits cysteine proteases (Rock et al. 1994) (e.g. cathepsins B, H and L, and µ- and m-calpain).
Northern blot analysis
Tibialis anterior muscles were rapidly excised, frozen in liquid nitrogen and stored at −80 °C. Previous studies have shown coordinated changes in mRNA levels for proteolytic genes in the tibialis anterior and the rates of proteolysis in incubated EDL muscles (Temparis et al. 1994; Voisin et al. 1996). Both muscles comprise mainly mixed glycolytic fibres and are representative of the whole musculature. Northern blots were also performed in the whole jejunum. Total RNA was extracted as described (Chomczynski & Sacchi, 1987) and 10 µg was electrophoresed in 1 % (w/v) agarose gels containing formaldehyde. RNA was vacuum transferred to a nylon membrane (GeneScreen, NEN Research Products, Boston, MA, USA) and covalently bound to the membrane by UV cross-linking. The membranes were hybridised with cDNA probes encoding chicken polyubiquitin, rat C2 and C9 20S proteasome subunits and 14-kDa E2, human MSS1 subunit of the 19S regulatory complex, and mouse 18S rRNA. The hybridisations were performed at 65 °C with [32P]cDNA fragments labelled by random priming. After washing at the same temperature the membranes were placed in a B40 Storm phosphor imager (Bondoufle, France), and the radiographic signals were quantified using the ImageQuaNT imaging software, Version 1.1 (Amersham Biosciences). The data were normalised with the corresponding 18S rRNA signals to correct for small variations in RNA loading. Neither starvation, infusion of AA, nor refeeding influenced 18S rRNA signals in both muscle and small intestine (P > 0.05, data not shown).
Rates of ubiquitin conjugation
Gastrocnemius muscles from starved and refed rats (n = 5 animals per group) were pooled and homogenised at 4 °C using a Polytron in 50 mm Tris-HCl, pH 7.5, 1 mm dithiothreitol (DTT), 1 mm EDTA, 1 mm phenylmethylsulfonyl fluoride, 10 µg ml−1 pepstatin A, and 10 µg ml−1 leupeptin (5 ml buffer (g muscle)−1). The homogenates were centrifuged at 10 000 g for 10 min at 4 °C, and the resulting supernatants were centrifuged at 100 000 g for 1 h at 4 °C. The final supernatants were stored at −80 °C until use. Rates of ubiquitination were determined by incubating supernatants containing 50 µg of muscle proteins at 37 °C in the presence of 50 mm Tris-HCl (pH 7.5), 1 mm DTT, 2 mm MgCl2, 2 mm 5′-adenylylimidodiphosphate, and 5 µm [125 I]-labelled-ubiquitin (≈3000 c.p.m. pmol−1) in a total volume of 20 µl. The reaction was stopped at 0, 10, 20, 30, 40, 50, and 60 min by the addition of 1 × Laemmli buffer (50 mm Tris-HCl (pH 6.8), 100 mm dithiothreitol, 2 % SDS, 0.1 % bromophenol blue and 10 % glycerol). Pilot studies showed that conjugation rates were linear for this period of time and that the concentration of exogenous labelled ubiquitin was in significant excess of any endogenous ubiquitin (e.g. addition of higher amounts of labelled ubiquitin did not increase rates of ubiquitination). After incubation, ubiquitin conjugates were resolved from free ubiquitin by SDS-PAGE on 12 % gels. After drying of the gel, high molecular weight radiolabelled conjugates were visualised with a Phosphofluoro-Imager (Amersham Biosciences) and quantified using the ImageQuaNT imager software (Version 1.1). The time courses for the accumulation of high molecular weight ubiquitin conjugates were analysed by linear regression to calculate ubiquitination rates, e.g. the slopes of best fit of arbitrary densitometric units of high molecular weight ubiquitin conjugates versus time.
Plasma insulin, corticosterone and amino acid determinations
Blood for plasma insulin and AA measurements was collected through the intravenous catheter (Experiment 1) or by cardiac puncture (Experiment 2) while under urethane (Experiment 1) or pentobarbitone (Experiment 2) anaesthesia (as described above). Blood was taken from another group of rats by decapitation (under pentobarbitone anaesthesia) for plasma corticosterone determination in Experiment 2. Plasma insulin was determined by radioimmunoassay using a commercial kit (ERIA Diagnostics, Pasteur, Sanofi, France) with human insulin as the standard. The antibody used in this kit reacts similarly with rat and human insulin (Sinaud et al. 1999). Plasma corticosterone was determined by radioimmunoassay (Pradier & Dalle, 1996). Plasma AA concentrations were determined as described previously (Sinaud et al. 1999). Briefly, 1 ml of plasma was added to a tube containing 50 mg sulfosalicylic acid and 20 mg thiodiglycol. The acid-soluble free AA-containing fraction was separated from the protein precipitate by centrifugation (10 000 g for 1 h at 4 °C), and then mixed (2:1 ratio) with 0.2 m lithium buffer (pH 2.2) prior to analysis on an automated AA analyser (LC 3000; Biotronik, France), using norleucine as an internal standard.
Statistical analysis
Results are presented as means ± standard deviation (s.d.). Initially, comparisons of results between all groups were made using analysis of variance (ANOVA). If statistically significant differences were detected by ANOVA, post hoc comparisons between groups were made using Tukey's multiple range test. Standard errors for slopes (e.g. ubiquitination rates) were computed as described by Sokal & Rohlf (1969). Ubiquitination rates were compared according to Snedecor & Cochran (1967). This statistical procedure involves first a comparison of residual variances by Bartlett's test. Assuming homogeneity of residual variances, slopes were then compared by the F test. Results were considered significant when P < 0.05.
Results
Four hours of amino acid perfusion does not inhibit muscle proteolysis
In Experiment 1, we examined the effect of 4 h AA infusion on muscle protein turnover in rats starved for 48 h. Despite a 2.4 to 6-fold increase in total or branched-chain AA concentrations in plasma from AA-infused starved versus fed rats (Table 1), there was no effect on the rates of total proteolysis in EDL muscles (Table 2). In contrast, 4 h AA infusion stimulated muscle protein synthesis, albeit to a level below that of the fed animals (Table 2).
Table 1.
Plasma aminno acid and insulin concentrations in fed and 48 h starved rats infused with either amino acids or the control infusate (electrolyte)
| Fed | starved | ||
|---|---|---|---|
| Electrolyte infused | Electrolyte infused | AA Infused | |
| Taurine | 140 ± 11 | 163 ± 11* | 170 ± 8 |
| Threonine | 140 ± 14 | 197 ± 19† | 594 ± 68‡ |
| Serine | 147 ± 13 | 152 ± 14 | 234 ± 58‡ |
| Asparagine | 76 ± 12 | 84 ± 3 | 80 ± 8 |
| Glutamate | 54 ± 7 | 56 ± 12 | 91 ± 18‡ |
| Glutamine | 716 ± 47 | 657 ± 65 | 634 ± 51 |
| Glycine | 309 ± 25 | 275 ± 22 | 494 ± 37‡ |
| Alanine | 363 ± 11 | 135 ± 10† | 1140 ± 105‡ |
| Citrulline | 61 ± 5 | 70 ± 10 | 95 ± 7‡ |
| Valine | 125 ± 11 | 166 ± 19* | 694 ± 146‡ |
| Methionine | 33 ± 2 | 36 ± 5 | 246 ± 25‡ |
| Isoleucine | 68 ± 5 | 98 ± 11† | 378 ± 42‡ |
| Leucine | 79 ± 9 | 135 ± 8† | 557 ± 52‡ |
| Tyrosine | 66 ± 6 | 45 ± 6† | 68 ± 11 |
| Phenylalanine | 58 ± 5 | 63 ± 3 | 217 ± 34‡ |
| Histidine | 67 ± 6 | 81 ± 9* | 288 ± 44‡ |
| Tryptophan | 64 ± 10 | 76 ± 14 | 177 ± 19‡ |
| Ornithine | 32 ± 3 | 34 ± 4 | 70 ± 17‡ |
| Lysine | 351 ± 32 | 270 ± 21† | 768 ± 144‡ |
| Arginine | 44 ± 6 | 79 ± 8† | 232 ± 36‡ |
| Proline | 146 ± 16 | 112 ± 10* | 245 ± 41‡ |
| Sum of AA | 3133 ± 30 | 2980 ± 121 | 7470 ± 190‡ |
| BCAA | 272 ± 8 | 397 ± 37† | 1629 ± 151‡ |
| Insulin | 61.3 ± 144.4 | 23.8 ± 4.7† | 44.6 ± 10.0 |
Values are means ±s.d. for n = 4. AA and insuline concentrations are μm and milliinternational units per litre (mi.u.l−1), respectively. BCAA, branched-chain amino acids.
P < 0.05
P < 0.01
P < 0.025 versus the fed group
Table 2.
Amino acid infusion in 48 h-starved rats increases skeletal muscle protein synthesis but has no effect on total, lysosomal/Ca2+−dependent, or proteasome-dependent proteolysis
| Fed | starved | ||
|---|---|---|---|
| Electrolyte infused | Electrolyte infused | AA Infused | |
| Protein synthesis | 0.47 ± 0.04 | 0.29 ± 0.03* | 0.37 ± 0.04*† |
| Proteolysis | |||
| Total | 1.04 ± 0.19 | 1.99 ± 0.13‡ | 1.82 ± 0.13‡ |
| Lysosomal/Ca2+− | 0.22 ± 0.03 | 0.44 ± 0.03‡ | 0.37 ± 0.04* |
| dependent | (21%) | (22%) | (20%) |
| Proteasome- | 0.51 ± 0.14 | 1.45 ± 0.27‡ | 1.36 ± 0.16‡ |
| dependent | (49%) | (73%) | (74%) |
Values are means ±s.d. for n = 5 and are expressed as nmol Tyr (mg protein)−1 (2h)−1. There was a significant difference between groups for all parameters by ANOVA (P < 0.0001).
P < 0.05 versus the fed
P < 0.05versus the electrolyte-infused starved
P < 0.01versus the fed group. Values in parentheses are percentages of total proteolysis. Data are from two different experiments in which either total and non-lysosomal/Ca2+ -dependent or non-lysosomal/Ca2+ -dependent and proteasome-independent proteolysis were measured. In both experiments, non-lysosomal Ca2+ -dependent proteolysis (taken as a reference) was not significantly different (P > 0.05).
Ten hours of refeeding is required to normalise rates of proteolysis to fed levels
As it was possible that the lack of effect of AA on proteolysis was due to the intravenous route of delivery per se, in the next experiments we refed starved rats a normal oral diet. As in Experiment 1, prolonged starvation significantly decreased the rate of protein synthesis (Table 3) and greatly increased the rate of total proteolysis in EDL muscles (Table 4). Oral refeeding increased the rate of muscle protein synthesis to fed levels within 4 h (Table 3), but had no effect on rates of total proteolysis (Table 4). Rats refed for 4 h ate immediately, as shown by increased gastric and intestinal contents (data not shown) and increased insulin release (see below). Thus it would appear that the lack of effect of 4 h AA infusion was not due to the route of administration. Indeed, subsequent experiments showed that 10 h of refeeding was required to normalise rates of proteolysis to fed levels (Table 4).
Table 3.
Protein mass and synthesis in the EDL muscle, and plasma concentrations of insulin and corticosterone during refeeding of starved rates
| Muscle | Plasma | |||
|---|---|---|---|---|
| Protein mass (mg) | Protein synthesis (nmol Tyr (mg protein)−1 2h−1) | [Insulin] (mi.u.l−1) | [Corticosterone] (mg l−1) | |
| Fed | 7.11 ± 0.47 | 0.52 ± 0.05 | 40.2 ± 11.7 | 89.7 ± 35.9 |
| 48 h starved | 4.43 ± 0.21* | 0.24 ± 0.04 | 12.1 ± 3.8* | 246.6 ± 54.1* |
| 4 h refed | 4.64 ± 0.30* | 0.43 ± 0.11 | 46.2 ± 16.0 | 3.2 ± 5.0* |
| 6 h refed | 4.74 ± 0.21* | 0.44 ± 0.15 | 50.0 ± 12.3 | 0.9 ± 2.0* |
| 10 h refed | 4.88 ± 0.17* | 0.46 ± 0.04 | 44.0 ± 9.9 | 9.0 ± 3.1* |
| 24 h refed | 5.92 ± 0.24† | 0.57 ± 0.04 | 42.8 ± 15.2 | 10.9 ± 9.8* |
Values are means ±s.d. for n = 5. There was a significant difference between groups by ANOVA (P < 0.01) for all measurements.
P < 0.01
P < 0.05versus the fed group.
Table 4.
Inhibition of the increased total, lysosomal/Ca2+-dependent and proteasome-dependent proteolysis in skeletal muscle from 48h-starved rats requires 10h of refeeding
| Total | LysosomalCa2+ -dependent | Proteasome-dependent | |
|---|---|---|---|
| Fed | 1.14 ± 0.19 | 0.25 ± 0.02 (22%) | 0.58 ± 0.12 (51%) |
| 48 h starved | 1.88 ± 0.11* | 0.39 ± 0.02* (21%) | 1.27 ± 0.25* (68%) |
| 4 h refed | 1.82 ± 0.12* | 0.39 ± 0.03* (21%) | 1.20 ± 0.20* (66%) |
| 6 h refed | 1.66 ± 0.27* | 0.35 ± 0.07* (21%) | 1.10 ± 0.16* (66%) |
| 10 h refed | 1.24 ± 0.15 | 0.18 ± 0.03 (15%) | 0.64 ± 0.12 (51%) |
| 24 h refed | 1.23 ± 0.07 | 0.24 ± 0.04 (19%) | 0.61 ± 0.10 (50%) |
Values are means ±s.d. for n = 5 and are expressed as nmol Tyr (mg protein)−1(2h)−1. values in parantheses are percentages of total proteolysis (see Table 1 legend). There was a significant difference between groups by ANOVA (P < 0.0001).
P < 0.01versus the fed group.
The Ubiquitin–proteasome pathway is the major proteolytic system responsible for starvation- and refeeding-induced changes in proteolysis
We next examined which proteolytic pathways were stimulated in prolonged fasting and impaired with refeeding, with the use of inhibitors specific for the lysosomal/Ca2+-dependent, and the proteasome systems. The proteasome-dependent pathway was the predominant proteolytic process in the EDL muscles accounting for between 49 and 74 % of the total proteolytic rate in fed, starved, AA infused, and starved/refed animals (Tables 2 and 4). Furthermore, this pathway accounted for greater than 90 % of the changes in total proteolysis that occurred with prolonged starvation and refeeding. The lysosomal and Ca2+-dependent pathways were stimulated with fasting as described (Wing & Goldberg, 1993) and decreased with refeeding, but represented a fairly constant component of total proteolysis (15-22 %), in all the experimental conditions examined (Tables 2 and 4). Thus the bulk of increased proteolysis in prolonged fasting was mainly due to the activation of the proteasome system and this was suppressed by refeeding.
Refeeding does not concomitantly normalise the increased expression of components of the ubiquitin system
To examine potential mechanisms for the hormonal and/or nutrient-mediated changes in muscle proteolysis we next measured the mRNA levels for components of the Ubiquitin–proteasome system. Starvation was associated with an increase in mRNA levels for ubiquitin, the 1.2 kb transcript of the 14-kDa E2 ubiquitin-conjugating enzyme (Fig. 1), and the C2 and C9 20S proteasome subunits (Fig. 2) in accordance with previous studies (Medina et al. 1995; Wing & Banville, 1994). We also report here that the mRNA levels for the MSS1 ATPase subunit of the 19S complex increased in fasting (Fig. 2) and was normalised with refeeding (see below). However, temporal variations in proteasome-dependent proteolysis during refeeding did not correlate with concomitant changes in the expression of all components of the Ubiquitin–proteasome pathway. For example, only the 2.6 and 1.2 kb ubiquitin transcripts responded rapidly, decreasing to fed levels within 4 h of refeeding (Fig. 1). In contrast, the expression of the 20S proteasome subunits decreased to fed levels at only 24 h (Fig. 2). Finally, an intermediate response was observed for the 1.2 kb transcript of the 14-kDa E2 (Fig. 1) and the mRNA for the MSS1 subunit of the 19S complex (Fig. 2), which decreased to fed levels within 10 h of refeeding.
Figure 1. Expression of ubiquitin is differentially regulated in skeletal muscle and jejunum from rats starved (St) and refed for 4, 6, 10, or 24 h, and is not downregulated in concert with the 14-kDa E2 in muscle from refed animals.
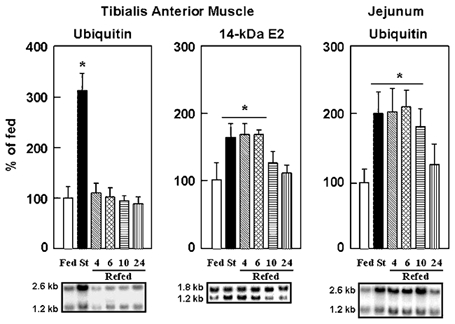
Northern blots were performed as described in Methods. After stripping the probes, blots were rehybridised with an 18S rRNA probe and autoradiographic signals for the 2.6 and the 1.2 kb transcripts of ubiquitin and the 14-kDa E2, respectively, were corrected for 18S rRNA abundance to take into account slight variations in RNA loading. Values are expressed in % of the fed animals and are means with s.d. (vertical bars) for n = 5. *P < 0.01 versus the fed group. Representative Northern blots are also shown.
Figure 2. Expression of subunits of the 20S proteasome and of the 19S regulatory complex is differentially regulated in skeletal muscle from starved/refed rats.
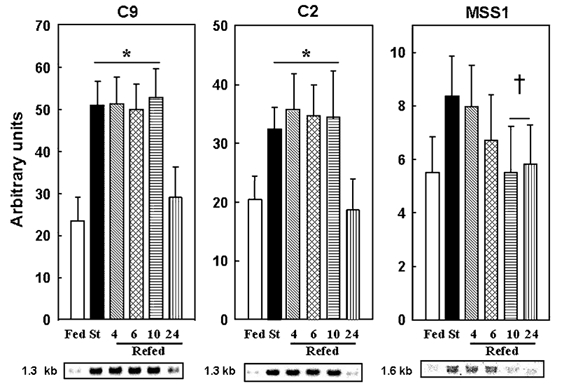
Northern blots were performed and autoradiographic signals were corrected for 18S rRNA abundance. See Fig. 1 legend for further details. There was a significant difference between groups assessed by ANOVA (P < 0.001). *P < 0.01versus the fed and †P < 0.05versus the starved group, respectively.
Ten hours of refeeding are required to decrease the rate of ubiquitination of muscle proteins in starved/refed rats
To independently confirm the in vitro findings of slow response of the Ubiquitin–proteasome pathway to refeeding we have measured rates of ubiquitination in the starvation/ refeeding experiment. Figure 3A shows that when extracts of muscle proteins, which contain the whole ubiquitination machinery, were incubated in the presence of an excess of exogenous [125I]labelled ubiquitin, there was a rapid and time-dependent accumulation of high molecular weight ubiquitin conjugates in the starved group (r = 0.95, P < 0.005). The rate of ubiquitination was unchanged (P > 0.50) in the muscle extracts from starved animals refed for either 4 or 6 h (Fig. 3B, C and F). In contrast, this rate was depressed by 56 and 63 % (P < 0.03) in the muscle extracts from starved animals refed for 10 and 24 h, respectively (Fig. 3D, E and F). These data (1) confirm a delayed inhibition of the Ubiquitin–proteasome pathway upon refeeding, and (2) are in perfect agreement with the in vivo downregulation of the muscle mRNA levels for the 14-kDa E2 that also was observed at 10 h of refeeding (Fig. 1).
Figure 3. Ten hours of refeeding are required to downregulate rates of ubiquitination in muscle extracts from starved/refed rats.
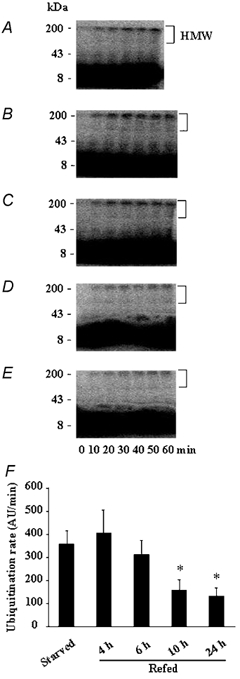
The formation of high molecular weight (HMW) [125I]-labelled ubiquitin conjugates was followed by autoradiography in muscle extracts from starved rats (A) and from animals refed for 4 (B), 6 (C), 10 (D) and 24 h (E). Note that the 60 min sample is missing in the starved group (A). F, comparison of the ubiquitination rates (e.g. the slopes of best fit of arbitrary densitometric units (AU) of HMW ubiquitin conjugates versus time). Bars denote standard errors of the slopes. *P < 0.03versus the starved group.
Insulin release does not rapidly suppress increased proteasome-dependent proteolysis
Plasma insulin is widely believed to be a major regulator of the anabolic drive of nutrients. Not surprisingly, insulin concentration increased rapidly with 4 h AA infusion (Table 1) and 4 h of refeeding (Table 3). Thus, the starvation-induced increase in proteasome-dependent proteolysis in skeletal muscle is poorly responsive to acute changes in plasma insulin. Corticosteroids are elevated in fasted rats (Wing & Goldberg, 1993; and Table 3), and are known to antagonise the anti-proteolytic effect of insulin (Louard et al. 1994). However, plasma corticosterone rapidly decreased below fed levels within 4 h of refeeding (Table 3). The suppression of the elevated muscle proteasome-dependent proteolysis (Table 4) correlated poorly with both plasma insulin and corticosterone levels (Table 3). Only the elevated ubiquitin expression was suppressed within 4 h of refeeding, presumably by increased insulin release and AA concentrations. This is in agreement with previous in vivo studies which showed that hyperinsulinaemic and euglycaemic clamps resulted in an insulin-induced inhibition of ubiquitin expression (but not of 14-kDa E2 and 20S proteasome subunits) (Larbaud et al. 1996, 2001). This effect was specific to glycolytic and mixed-fibre type muscles (Larbaud et al. 1996, 2001) and may be mediated by the decrease in plasma corticosterone levels that occurs following 4 h of refeeding (Wing & Goldberg, 1993; and see Table 3).
Refeeding rapidly normalises increased intestinal expression of 20S proteasome subunits
As skeletal muscle proteolysis responded to refeeding very slowly, we examined its effect on the mRNA levels of several components of the Ubiquitin–proteasome pathway in the small intestine. These mRNA levels were recently reported to be increased by starvation (Samuels et al. 1996) and to be decreased by AA (Adegoke et al. 1999) in the rat and piglet small intestine, respectively. In contrast to muscle, the increased C2 and C9 20S proteasome subunit expression in the jejunum from starved rats was normalised by refeeding within 6 h (Fig. 4). Furthermore, the ubiquitin transcripts in the intestine remained elevated until 10 h of refeeding (Fig. 1), in good agreement with in vivo experiments where ubiquitin expression was shown to be not insulin-sensitive in the jejunum (Larbaud et al. 1996).
Figure 4. The starvation-induced expression of the C2 and C9 20S proteasome subunits is normalised in rat jejunum after 6 h of refeeding.
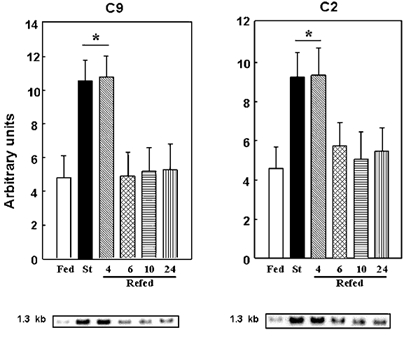
Northern blots were performed and autoradiographic signals were corrected for 18S rRNA abundance. See Fig. 1 legend for further details. There was a significant difference between groups assessed by ANOVA (P < 0.0001). *P < 0.01versus the fed group.
Discussion
It is generally accepted that the rapid postprandial stimulation of skeletal muscle protein synthesis is mediated largely by the combined increases in insulin and AA concentrations (Bennet et al. 1990; Biolo et al. 1995; Tessari et al. 1996; Garlick et al. 1998; Wolfe, 2000). Insulin by itself has little effect, but is synergistic with elevated AA concentrations (Bennet et al. 1990; Biolo et al. 1995; Wolfe, 2000). The decrease in glucocorticoids concentration with feeding also potentiates the effects of insulin and AA on protein synthesis (Millward et al. 1983). The present findings are totally consistent with this view. Muscle protein synthesis increased within 4 h of refeeding or AA infusion, when plasma insulin and AA concentrations increased, and circulating levels of corticosterone decreased. In contrast, total and proteasome-dependent proteolysis responded slowly to AA infusion and refeeding in starved rats and did not correlate with the rapid changes in insulin, AA, and/or corticosterone concentrations. Therefore, the lack of elevated plasma AA and/or insulin concentrations to inhibit proteasome-dependent proteolysis at 4 h of refeeding is unlikely to result from the antagonist effect of corticosterone. These observations clearly illustrate the lack of coordinated changes in both protein synthesis and breakdown in muscle as others have suggested (Waterlow, 1999). The rapid response of muscle protein synthesis to insulin and/or AA is no doubt a reflection of the rapid activation of the phosphatidylinositol 3-kinase signalling pathway that directly impacts on the translational apparatus (Shah et al. 2000). This pathway has also been reported to be involved in the insulin-induced inhibition of muscle proteolysis (Dardevet et al. 1996) at least in vitro. In theory, a rapid inactivation of the ubiquitin- proteasome pathway is also possible as the activity of many enzymes of the ubiquitination machinery can be modulated by phosphorylation (Goebl et al. 1994; Stephen et al. 1996), and some of the 20S proteasome and 19S complex subunits can be phosphorylated (Castano et al. 1996; Mason et al. 1996, 1998). However, there is so far no evidence implicating insulin or AA in these phosphorylation events.
A limitation of the present studies is that we measured rates of protein turnover in vitro. Incubated muscles are always in a pronounced state of negative net protein balance, including in fed animals (compare rates of protein synthesis and of total proteolysis in Table 2 or in Tables 3 and 4). Furthermore, the expression of all components of the Ubiquitin–proteasome pathway (Fig. 1 and Fig. 2) did not strictly correlate with rates of proteolysis (Table 4). Thus, one may argue that our measurements did not reflect the in vivo situation, and that the effects of refeeding may be lost during the muscle incubation without insulin and AA. This seems very unlikely. First, we detected a stimulation of protein synthesis within 4 h of either amino acid infusion (Table 2) or refeeding (Table 3). Second, Larbaud et al. (2001) recently reported an inhibition of proteasome-dependent rates of proteolysis in muscles incubated in the absence of both insulin and AA from rats submitted to a previous in vivo 3-h hyperinsulinaemic clamp. Finally, the delayed inhibition of proteasome-dependent proteolysis measured in vitro is in close agreement with the delayed reduction in both the formation of ubiquitin conjugates and the downregulation of 14-kDa E2 expression upon refeeding. Since these three parameters are totally independent measurements, our data provide strong evidence for a slow downregulation of the Ubiquitin–proteasome pathway upon refeeding in prolonged starved animals. It must be pointed out that 2 days of starvation in our young rats is equivalent to at least 5 days and several weeks of starvation in adult rats and humans, respectively. However, our data do not preclude that insulin may have rapid effects on the Ubiquitin–proteasome-dependent pathway in non-catabolic conditions. Indeed, Larbaud et al. (2001) have shown that a 3-h hyperinsulinaemic clamp can downregulate both ubiquitin expression and proteasome-dependent proteolysis in type II muscles from rats. Thus, the present data provide evidence that, following a prolonged catabolic event such as 48-h starvation in young rats, the enhanced ubiquitin- proteasome-dependent proteolysis is not rapidly normalised by anabolic stimuli like insulin, AA, and/or nutrients (see below).
Although both insulin and AA can rapidly suppress muscle protein breakdown in vitro, it is far from clear whether nutrients and hormones have a rapid and synergistic effect on muscle proteolysis in vivo (Tessari et al. 1996; Wolfe, 2000). Some studies have shown an inhibitory effect of insulin (Gelfand & Barrett, 1987) and AA (Bennet et al. 1990) on muscle proteolysis, but others have found no effect (Tessari et al. 1991; Watt et al. 1992). The present findings directly support the latter view and demonstrated that changes in plasma insulin, AA and corticosterone levels contribute to, but are certainly not sufficient for acute suppression of elevated proteolysis in skeletal muscle following starvation. Studies in sustained catabolic states other than starvation/refeeding lead to similar conclusions. For example, muscle proteolysis remained elevated despite nutrient intake being almost normal in chronically septic rats, 6 days post infection (Voisin et al. 1996). Although skeletal muscle protein synthesis was stimulated by nutrition in these animals, their muscles were still losing large amounts of protein (Voisin et al. 1996). The reason for the resistance of muscle proteolysis to nutrients/ hormones in starved/refed or septic rats is unclear. Perhaps muscle protein breakdown only responds after a prolonged exposure to increased plasma insulin and AA levels, and decreased glucocorticoid concentrations. Alternatively, the 2-day period of starvation may result in a state of resistance to the normal anabolic effects of insulin and/or nutrients. Finally, it is possible that the rapid insulin-mediated reduction of elevated whole-body proteolysis in many in vivo studies may reflect suppression of proteolysis in splanchnic tissues, which exhibit very high rates of protein turnover (Waterlow et al. 1978). Lysosomal proteolysis is the major degradative process in the liver, and is acutely regulated by nutrients, particularly AA (Mortimore et al. 1992). The rather rapid decrease in expression of 20S proteasome subunits in the jejunum (within 6 h versus 24 h in muscle, Fig. 2 and Fig. 3) with refeeding also supports this interpretation although it is unclear if these changes reflect actual differences in rates of proteolysis. Elevated rates of muscle proteolysis may be required to provide AA for reparative processes in the gastrointestinal tract during the initial stages of recovery following a prolonged catabolic condition. For example, after infection there is an anabolic period, marked by a pronounced ‘catch-up’ period with more positive nitrogen balance (Samuels & Baracos, 1995). Strikingly, this occurred in gut before any other tissue. Similarly, the more rapid downregulation of 20S proteasome subunit expression by nutrition in the gut than the muscle in the present study may indicate a more rapid response to nutrition of proteasome-dependent proteolysis in the gut compared to muscle. However, it is unclear at this stage whether changes in 20S proteasome expression reflect alterations in intestinal proteasome-dependent proteolysis.
There is now strong evidence that the ubiquitin- proteasome pathway is responsible for the increased proteolysis that occurs in many pathological conditions associated with muscle wasting (Mitch & Goldberg, 1996; Attaix & Taillandier, 1998). However, evidence for a stimulation of the Ubiquitin–proteasome pathway in starvation has only been based on indirect measurements. For example, Medina et al. (1995) and Gomes et al. (2001) reported increased mRNA levels for ubiquitin or 20S proteasome subunits and for atrogin-1, a newly characterised muscle-specific E3, respectively. Goldberg, Wing, and colleagues have reported a correlation between increased expression of components of this pathway and elevated ATP-dependent proteolysis (Wing & Goldberg, 1993; Wing & Banville, 1994; Medina et al. 1995; Wing et al. 1995). We report here that the increase in total proteolysis with starvation and the reduction in proteolysis by refeeding were almost completely blocked by the proteasome inhibitor MG132. It is currently believed, based on a few experiments, that the regulation of transcription of components of the ubiquitination and proteasome systems is coordinated in various muscle wasting conditions (Bailey et al. 1996; Mitch & Goldberg, 1996; Price et al. 1996) and results in increased proteolysis (Medina et al. 1995). However, this does not appear to be the case in the anabolic situation of refeeding based on our findings. For example, rates of proteasome-dependent proteolysis were normalised by refeeding at 10 h, long before the 20S proteasome subunit mRNA levels returned to basal levels (e.g. at 24 h, see Fig. 2). Ubiquitin expression was also rapidly normalised in the muscles from refed animals, presumably by high levels of insulin/AA, but the amount of free ubiquitin is not believed to be rate limiting for ubiquitin conjugation (see Larbaud et al. 1996 for detailed explanations). Thus, our observations suggest that increased mRNA levels for ubiquitin and 20S proteasome subunits reflect an adaptation to enhanced protein breakdown rather than being the initiating event. The slower response of the 20S proteasome subunits to refeeding compared to proteasome-dependent proteolysis suggests that factors other than the expression of 20S proteasomes are responsible for initiating the reduction in the rate of proteolysis with refeeding.
It is noteworthy that the in vivo expression of 14-kDa E2 enzyme and MSS1 subunit closely paralleled the changes in in vitro proteasome-dependent rates of proteolysis. The 14-kDa E2 is a major E2 enzyme whose lower transcript is acutely regulated in several muscle wasting conditions (Temparis et al. 1994; Wing & Banville, 1994; Mansoor et al. 1996; Voisin et al. 1996; Attaix & Taillandier, 1998). This enzyme interacts with the N-end rule E3 α enzyme and is responsible for increased rates of ubiquitination in atrophying muscles (Solomon et al. 1998), including in diabetes (Lecker et al. 1999). Importantly, we report here that the in vivo downregulation of 14-kDa E2 expression correlated with the reduction of ubiquitination rate that was only detected after 10 h of refeeding in muscle extracts from starved/refed rats. This supports the suggestion of Wing & Banville (1994) that the 14-kDa E2 is rate limiting for ubiquitin-conjugation in starvation/refeeding. However, these authors also suggested that the muscle 14-kDa E2 expression is regulated by plasma insulin levels. The lack of synchrony between changes in insulin concentration and 14-kDa E2 expression in the present study, and previous studies both in goats (Larbaud et al. 1996) and in rats (Larbaud et al. 2001) confirms that insulin per se does not regulate 14-kDa E2 expression in vivo.
There were also coordinated changes in expression of MSS1 (one ATPase subunit of the 19S complex) and proteasome-dependent proteolysis during refeeding. The 19S complex regulates the proteolytic and peptidase activities of the 20S proteasome (Voges et al. 1999). MSS1 and the five other ATPase subunits of the 19S complex are thought to provide the energy for: the assembly of the 26S proteasome and the breakdown of ubiquitinated proteins into peptides (Voges et al. 1999); the gating of the channel of the 20S proteasome (Kohler et al. 2001); the denaturation of protein substrates and their injection into the proteolytic chamber of the protease (Navon & Goldberg, 2001); and peptide release (Kohler et al. 2001). Increased expression of the MSS1 subunit (and other 19S ATPase and non-ATPase subunits) has been observed in some, but not all muscle wasting conditions (Attaix & Taillandier, 1998; Combaret et al. 2002). However, the significance of changes in the expression of 19S regulatory subunits in relation to the activity of the proteasome in vivo is still currently unclear.
In conclusion, this study clearly indicates that an acute increase in insulin release and nutrient availability (AA in particular) has little effect on the starvation-induced elevation in Ubiquitin–proteasome-dependent proteolysis in skeletal muscle Moreover, this resistance does not appear to due to glucocorticoid antagonism. This is in clear contrast with the rapid effect of both insulin and nutrients on muscle protein synthesis. In skeletal muscle, the suppression of proteasome-dependent proteolysis by nutrition following starvation does not appear to be initiated by changes in expression of the 20S proteasome. Furthermore, the effect of nutrition on the ubiquitin- proteasome system in skeletal muscle and the intestines appears to be via different and perhaps independent mechanisms. The slow response of skeletal muscle proteolysis to insulin and nutrition may ensure continued release of amino acids essential for the restoration of intestinal protein mass following prolonged catabolic insults.
Acknowledgments
This paper is dedicated to the memory of Dr Bernard Beaufrère, who suddenly died on August 10, 2002. This work was supported by research grants to D.A. from Nestlé and the Institut National de la Recherche Agronomique. A.J.K. was supported by a postdoctoral fellowship from the Institut National de la Recherche Agronomique. We wish to thank Cécile Rallière and Sylvain Auclair for technical assistance, Gérard Bayle for amino acid measurements, Dr Keiji Tanaka (The Tokyo Metropolitan Institute of Medical Science, Tokyo, Japan) for the gift of plasmids encoding the rat proteasome subunits, and Dr Simon S. Wing (McGill University, Montréal, Canada) for providing us with the cDNA of the rat 14-kDa E2.
References
- Adegoke OA, McBurney MI, Samuels SE, Baracos VE. Luminal amino acids acutely decrease intestinal mucosal protein synthesis and protease mRNA in piglets. J Nutr. 1999;129:1871–1878. doi: 10.1093/jn/129.10.1871. [DOI] [PubMed] [Google Scholar]
- Attaix D, Combaret L, Pouch M-N, Taillandier D. Regulation of proteolysis. Curr Opin Clin Nutr Metab Care. 2001;4:45–49. doi: 10.1097/00075197-200101000-00009. [DOI] [PubMed] [Google Scholar]
- Attaix D, Taillandier D. The critical role of the Ubiquitin–proteasome pathway in muscle wasting in comparison to lysosomal and Ca2+-dependent systems. Adv Mol Cell Biol. 1998;27:235–266. [Google Scholar]
- Bailey JL, Wang X, England BK, Price SR, Ding X, Mitch WE. The acidosis of chronic renal failure activates muscle proteolysis in rats by augmenting transcription of genes encoding proteins of the ATP-dependent Ubiquitin–proteasome pathway. J Clin Invest. 1996;97:1447–1453. doi: 10.1172/JCI118566. [DOI] [PMC free article] [PubMed] [Google Scholar]
- Bennet WM, Connacher AA, Scrimgeour CM, Rennie MJ. The effect of amino acid infusion on leg protein turnover assessed by L-[15N]phenylalanine and L-[13C]leucine exchange. Eur J Clin Invest. 1990;20:41–50. doi: 10.1111/j.1365-2362.1990.tb01789.x. [DOI] [PubMed] [Google Scholar]
- Biolo G, Declan Fleming RY, Wolfe RR. Physiologic hyperinsulinemia stimulates protein synthesis and enhances transport of selected amino acids in human tissue. J Clin Invest. 1995;95:811–819. doi: 10.1172/JCI117731. [DOI] [PMC free article] [PubMed] [Google Scholar]
- Castano JG, Mahillo E, Arizti P, Arribas J. Phosphorylation of C8 and C9 subunits of the multicatalytic proteinase by casein kinase II and identification of the C8 phosphorylation sites by direct mutagenesis. Biochemistry. 1996;35:3782–3789. doi: 10.1021/bi952540s. [DOI] [PubMed] [Google Scholar]
- Chomczynski P, Sacchi N. Single-step method of RNA isolation by acid guanidinium thiocyanate-phenol-chloroform extraction. Anal Biochem. 1987;162:156–159. doi: 10.1006/abio.1987.9999. [DOI] [PubMed] [Google Scholar]
- Combaret L, Taillandier D, Attaix D. Nutritional and hormonal control of protein breakdown. Am J Kidney Dis. 2001;37(suppl)(2):108S–111S. doi: 10.1053/ajkd.2001.20763. [DOI] [PubMed] [Google Scholar]
- Combaret L, Tilignac T, Claustre A, Voisin L, Taillandier D, Obled C, Tanaka K, Attaix D. Torbafylline (HWA 448) inhibits enhanced skeletal muscle Ubiquitin–proteasome-dependent proteolysis in cancer and septic rats. Biochem J. 2002;361:185–192. doi: 10.1042/0264-6021:3610185. [DOI] [PMC free article] [PubMed] [Google Scholar]
- Dardevet D, Sornet C, Vary T, Grizard J. Phosphatidylinositol 3-kinase and p70 S6 kinase participate in the regulation of protein turnover in skeletal muscle by insulin and insulin-like growth factor-I. Endocrinology. 1996;137:4087–4094. doi: 10.1210/endo.137.10.8828461. [DOI] [PubMed] [Google Scholar]
- Fang C-H, Wang JJ, Hobler S, Li BG, Fischer JE, Hasselgren P-O. Proteasome blockers inhibit protein breakdown in skeletal muscle after burn injury in rats. Clin Sci. 1998;95:225–233. [PubMed] [Google Scholar]
- Garlick PJ, McNurlan MA, Bark T, Lang CH, Gelato M. Hormonal regulation of protein metabolism in relation to nutrition and disease. J Nutr. 1998;128:356S–359S. doi: 10.1093/jn/128.2.356S. [DOI] [PubMed] [Google Scholar]
- Gelfand RA, Barrett EJ. Effect of physiologic hyperinsulinemia on skeletal muscle protein synthesis and breakdown in man. J Clin Invest. 1987;80:1–6. doi: 10.1172/JCI113033. [DOI] [PMC free article] [PubMed] [Google Scholar]
- Goebl MG, Goetsch L, Byers B. The Ubc3 (Cdc34).ubiquitin-conjugating enzyme is ubiquitinated and phosphorylated in vivo. Mol Cell Biol. 1994;14:3022–3029. doi: 10.1128/mcb.14.5.3022. [DOI] [PMC free article] [PubMed] [Google Scholar]
- Gomes MD, Lecker SH, Jagoe RT, Navon A, Goldberg AL. Atrogin-1, a muscle-specific F-box protein highly expressed during muscle atrophy. Proc Natl Acad Sci U S A. 2001;98:14440–14445. doi: 10.1073/pnas.251541198. [DOI] [PMC free article] [PubMed] [Google Scholar]
- Huang J, Forsberg NE. Role of calpain in skeletal-muscle protein degradation. Proc Natl Acad Sci U S A. 1998;95:12100–12105. doi: 10.1073/pnas.95.21.12100. [DOI] [PMC free article] [PubMed] [Google Scholar]
- Köhler A, Cascio P, Leggett DS, Woo KM, Goldberg AL, Finley D. The axial channel of the proteasome core particle is gated by the Rpt2 ATPase and controls both substrate entry and product release. Mol Cell. 2001;7:1143–1152. doi: 10.1016/s1097-2765(01)00274-x. [DOI] [PubMed] [Google Scholar]
- Larbaud D, Balage M, Taillandier D, Combaret L, Grizard J, Attaix D. Differential regulation of the lysosomal, Ca2+-dependent and Ubiquitin–proteasome-dependent proteolytic pathways in fast-twitch and slow-twitch rat muscle following hyperinsulinemia. Clin Sci. 2001;101:551–558. [PubMed] [Google Scholar]
- Larbaud D, Debras E, Taillandier D, Samuels SE, Temparis S, Champredon C, Grizard J, Attaix D. Euglycemic hyperinsulinemia and hyperaminoacidemia decrease skeletal muscle ubiquitin mRNA in goats. Am J Physiol. 1996;271:E505–512. doi: 10.1152/ajpendo.1996.271.3.E505. [DOI] [PubMed] [Google Scholar]
- Lecker SH, Solomon V, Price SR, Kwon YT, Mitch WE, Goldberg AL. Ubiquitin conjugation by the N-end rule pathway and mRNAs for its components increase in muscles of diabetic rats. J Clin Invest. 1999;104:1411–1420. doi: 10.1172/JCI7300. [DOI] [PMC free article] [PubMed] [Google Scholar]
- Llovera M, Garcia-Martinez C, Agell N, Lopez-Soriano FJ, Authier FJ, Gherardi RK, Argiles JM. Ubiquitin and proteasome gene expression is increased in skeletal muscle of slim AIDS patients. Int J Mol Med. 1988;2:69–73. [PubMed] [Google Scholar]
- Louard RJ, Bhushan R, Gelfand RA, Barrett EJ, Sherwin RS. Glucocorticoids antagonise insulin's antiproteolytic action on skeletal muscle in humans. J Clin Endocrinol Metab. 1994;79:278–284. doi: 10.1210/jcem.79.1.8027242. [DOI] [PubMed] [Google Scholar]
- Louard RJ, Fryburg DA, Gelfand RA, Barrett EJ. Insulin sensitivity of protein synthesis and glucose metabolism in human forearm skeletal muscle. J Clin Invest. 1992;90:2348–2354. doi: 10.1172/JCI116124. [DOI] [PMC free article] [PubMed] [Google Scholar]
- Lowell BB, Ruderman NB, Goodman MN. Regulation of myofibrillar protein degradation in rat skeletal muscle during brief and prolonged starvation. Metabolism. 1986;35:1121–1127. doi: 10.1016/0026-0495(86)90025-9. [DOI] [PubMed] [Google Scholar]
- Mansoor O, Beaufrère B, Boirie Y, Rallière C, Taillandier D, Aurousseau E, Schoeffler P, Arnal M, Attaix D. Increased mRNA levels for components of the lysosomal, Ca2+-activated, and ATP-ubiquitin-dependent proteolytic pathway in human skeletal muscle. Proc Natl Acad Sci U S A. 1996;93:2714–2718. doi: 10.1073/pnas.93.7.2714. [DOI] [PMC free article] [PubMed] [Google Scholar]
- Mason GG, Hendil KB, Rivett AJ. Phosphorylation of proteasomes in mammalian cells. Identification of two phosphorylated subunits and the effect of phosphorylation on activity. Eur J Biochem. 1996;238:453–462. doi: 10.1111/j.1432-1033.1996.0453z.x. [DOI] [PubMed] [Google Scholar]
- Mason GG, Murray RZ, Pappin D, Rivett AJ. Phosphorylation of ATPase subunits of the 26S proteasome. FEBS Lett. 1998;430:269–274. doi: 10.1016/s0014-5793(98)00676-0. [DOI] [PubMed] [Google Scholar]
- Medina R, Wing SS, Goldberg AL. Increase in levels of polyubiquitin and proteasome mRNA in skeletal muscle during starvation and denervation atrophy. Biochem J. 1995;307:631–637. doi: 10.1042/bj3070631. [DOI] [PMC free article] [PubMed] [Google Scholar]
- Millward DJ, Odedra B, Bates PC. The role of insulin, corticosterone and other factors in the acute recovery of muscle protein synthesis in refeeding food-deprived rats. Biochem J. 1983;216:583–587. doi: 10.1042/bj2160583. [DOI] [PMC free article] [PubMed] [Google Scholar]
- Mitch WE, Goldberg AL. Mechanisms of muscle wasting. The role of the Ubiquitin–proteasome pathway. N Engl J Med. 1996;335:1897–1905. doi: 10.1056/NEJM199612193352507. [DOI] [PubMed] [Google Scholar]
- Mortimore GE, Kadowaki M, Heydrick SJ. Intracellular protein catabolism and its control during nutrient deprivation and supply. In: Nair KS, editor. Protein Metabolism in Diabetes Mellitus. London: Smith Gordon; 1992. pp. 125–138. [Google Scholar]
- Navon A, Goldberg AL. Proteins are unfolded on the surface of the ATPase ring before transport into the proteasome. Mol Cell. 2001;8:1339–1349. doi: 10.1016/s1097-2765(01)00407-5. [DOI] [PubMed] [Google Scholar]
- Peters JM, Harris JR, Finley D. Ubiquitin and the Biology of the Cell. New York: Plenum Press; 1998. [Google Scholar]
- Pickart CM. Mechanisms underlying ubiquitination. Annu Rev Biochem. 2001;70:503–533. doi: 10.1146/annurev.biochem.70.1.503. [DOI] [PubMed] [Google Scholar]
- Price SR, Bailey JL, Wang X, Jurkovitz C, England BK, Ding X, Phillips LS, Mitch WE. Muscle wasting in insulinopenic rats, results from activation of the ATP-dependent, Ubiquitin–proteasome proteolytic pathway by a mechanism including gene transcription. J Clin Invest. 1996;98:1703–1708. doi: 10.1172/JCI118968. [DOI] [PMC free article] [PubMed] [Google Scholar]
- Pradier P, Dalle M. Effects of corticotrophin-releasing factor and vasopressin on plasma adrenocorticotrophin molecular forms, aldosterone and corticosterone in young and adult rats and rabbits. Reprod Fertil Dev. 1996;8:111–116. doi: 10.1071/rd9960111. [DOI] [PubMed] [Google Scholar]
- Rock KL, Gramm C, Rothstein L, Clark K, Stein R, Dick L, Hwang D, Goldberg AL. Inhibitors of the proteasome block the degradation of most cell proteins and the generation of peptides presented on MHC class I molecules. Cell. 1994;78:761–771. doi: 10.1016/s0092-8674(94)90462-6. [DOI] [PubMed] [Google Scholar]
- Samuels SE, Baracos VE. Tissue protein turnover is altered during catch-up growth following Escherichia coli infection in weanling rats. J Nutr. 1995;125:520–530. doi: 10.1093/jn/125.3.520. [DOI] [PubMed] [Google Scholar]
- Samuels SE, Taillandier D, Aurousseau E, Cherel Y, Le Maho Y, Arnal M, Attaix D. Gastrointestinal tract protein synthesis and mRNA levels for proteolytic systems in adult fasted rats. Am J Physiol. 1996;271:E232–238. doi: 10.1152/ajpendo.1996.271.2.E232. [DOI] [PubMed] [Google Scholar]
- Shah OJ, Anthony JC, Kimball SR, Jefferson LS. 4E-BP1 and S6K1: translational integration sites for nutritional and hormonal information in muscle. Am J Physiol Endocrinol Metab. 2000;279:E715–729. doi: 10.1152/ajpendo.2000.279.4.E715. [DOI] [PubMed] [Google Scholar]
- Sinaud S, Balage M, Bayle G, Dardevet D, Vary TC, Kimball SR, Jefferson LS, Grizard J. Diazoxide-induced insulin deficiency greatly reduced muscle protein synthesis in rats: involvement of eIF4E. Am J Physiol. 1999;276:E50–61. doi: 10.1152/ajpendo.1999.276.1.E50. [DOI] [PubMed] [Google Scholar]
- Smith PK, Krohn RI, Hermanson GT, Mallia AK, Gartner FH, Provenzano MD, Fujimoto EK, Goeke NM, Olson BJ, Klenk DC. Measurement of protein using bicinchoninic acid. Anal Biochem. 1985;150:76–85. doi: 10.1016/0003-2697(85)90442-7. [DOI] [PubMed] [Google Scholar]
- Snedecor GW, Cochran WG. Statistical Methods. 6. Ames: The Iowa State University Press; 1967. [Google Scholar]
- Sokal RR, Rohlf FJ. Biometry. San Fransisco: WH Freeman; 1969. [Google Scholar]
- Solomon V, Baracos V, Sarraf P, Goldberg AL. Rates of ubiquitin conjugation increase when muscles atrophy, largely through activation of the N-end rule pathway. Proc Natl Acad Sci U S A. 1998;95:12602–12607. doi: 10.1073/pnas.95.21.12602. [DOI] [PMC free article] [PubMed] [Google Scholar]
- Stephen AG, Trausch-Azar JS, Ciechanover A, Schwartz AL. The ubiquitin-activating enzyme E1 is phosphorylated and localized to the nucleus in a cell cycle-dependent manner. J Biol Chem. 1996;271:15608–15614. doi: 10.1074/jbc.271.26.15608. [DOI] [PubMed] [Google Scholar]
- Tawa NE, Odessey R, Goldberg AL. Inhibitors of the proteasome reduce the accelerated proteolysis in atrophying rat skeletal muscles. J Clin Invest. 1997;100:197–203. doi: 10.1172/JCI119513. [DOI] [PMC free article] [PubMed] [Google Scholar]
- Temparis S, Asensi M, Taillandier D, Aurousseau E, Larbaud D, Obled A, Béchet D, Ferrara M, Estrela JM, Attaix D. Increased ATP-ubiquitin-dependent proteolysis in skeletal muscles of tumor-bearing rats. Cancer Res. 1994;54:5568–5573. [PubMed] [Google Scholar]
- Tessari P, Inchiostro S, Biolo G, Vincenti E, Sabadin L. Effects of acute systemic hyperinsulinemia on forearm muscle protein proteolysis in healthy man. J Clin Invest. 1991;88:27–33. doi: 10.1172/JCI115287. [DOI] [PMC free article] [PubMed] [Google Scholar]
- Tessari P, Zanetti M, Barazzoni R, Vettore M, Michielan F. Mechanisms of postprandial protein accretion in human skeletal muscle. J Clin Invest. 1996;98:1361–1372. doi: 10.1172/JCI118923. [DOI] [PMC free article] [PubMed] [Google Scholar]
- Tiao G, Hobler S, Wang JJ, Meyer TA, Luchette FA, Fischer JE, Hasselgren P-O. Sepsis is associated with increased mRNAs of the Ubiquitin–proteasome proteolytic pathway in human skeletal muscle. J Clin Invest. 1997;99:163–168. doi: 10.1172/JCI119143. [DOI] [PMC free article] [PubMed] [Google Scholar]
- Tischler ME, Desautels M, Goldberg AL. Does leucine, leucyl-tRNA, or some metabolite of leucine regulate protein synthesis and degradation in skeletal and cardiac muscle? J Biol Chem. 1982;257:1613–1621. [PubMed] [Google Scholar]
- Voisin L, Breuillé D, Combaret L, Pouyet C, Taillandier D, Aurousseau E, Obled C, Attaix D. Muscle wasting in a rat model of long-lasting sepsis results from the activation of lysosomal, Ca2+ -activated, and Ubiquitin–proteasome proteolytic pathways. J Clin Invest. 1996;97:1610–1617. doi: 10.1172/JCI118586. [DOI] [PMC free article] [PubMed] [Google Scholar]
- Waterlow JC. The mysteries of nitrogen balance. Nutr Res Rev. 1999;12:25–54. doi: 10.1079/095442299108728857. [DOI] [PubMed] [Google Scholar]
- Waterlow JC, Garlick PJ, Millward DJ. Protein Turnover in Mammalian Tissues and in the Whole Body. Amsterdam: Elsevier North Holland; 1978. [Google Scholar]
- Watt PW, Corbett ME, Rennie MJ. Stimulation of protein synthesis in pig skeletal muscle by infusion of amino acids during constant insulin availability. Am J Physiol. 1992;263:E453–460. doi: 10.1152/ajpendo.1992.263.3.E453. [DOI] [PubMed] [Google Scholar]
- Williams A, Sun X, Fischer JE, Hasselgren P-O. The expression of genes in the Ubiquitin–proteasome proteolytic pathway is increased in skeletal muscle from patients with cancer. Surgery. 1999;126:744–749. [PubMed] [Google Scholar]
- Wing SS, Banville D. 14 kDa ubiquitin-conjugating enzyme: structure of the rat gene and regulation upon fasting and by insulin. Am J Physiol. 1994;267:E39–48. doi: 10.1152/ajpendo.1994.267.1.E39. [DOI] [PubMed] [Google Scholar]
- Wing SS, Goldberg AL. Glucocorticoids activate the ATP-ubiquitin-dependent proteolytic system in skeletal muscle during fasting. Am J Physiol. 1993;264:E668–676. doi: 10.1152/ajpendo.1993.264.4.E668. [DOI] [PubMed] [Google Scholar]
- Wing SS, Haas AL, Goldberg AL. Increase in ubiquitin-protein conjugates concomitant with the increase in proteolysis in rat skeletal muscle during starvation and atrophy denervation. Biochem J. 1995;307:639–645. doi: 10.1042/bj3070639. [DOI] [PMC free article] [PubMed] [Google Scholar]
- Wolfe RR. Effects of insulin on muscle tissue. Curr Opin Clin Nutr Metab Care. 2000;3:67–71. doi: 10.1097/00075197-200001000-00011. [DOI] [PubMed] [Google Scholar]