

Abstract
To investigate how Ca2+ regulates airway ciliary activity, changes in ciliary beat frequency (CBF) and intracellular calcium concentration ([Ca2+]i) of rabbit tracheal ciliated cells, in response to ATP, were simultaneously quantified with high-speed phase-contrast and fast fluorescence imaging. [ATP]≤ 1 μm induced an increase in[Ca2+]i and CBF that declined to the initial basal levels and was followed by irregular brief increases in[Ca2+]i and CBF. [ATP] > 1 but < 16 μm induced a similar increase in[Ca2+]i and CBF but this was followed by oscillations in CBF and[Ca2+]i. The minimum CBF of the oscillations in CBF remained elevated above the basal rate while the minimum concentration of the[Ca2+]i oscillations returned to the basal level. The minimum and maximum CBF of the oscillations in CBF were independent of the [ATP], whereas the frequency of the oscillations in CBF was dependent on the [ATP]. Similar oscillations in CBF and[Ca2+]i were induced by ATP- γ -S. Although ADP, AMP and adenosine induced a Ca2+-independent increase in CBF, neither ATP nor ATP- γ -S induced an increase in CBF when the Ca2+ increases were abolished by 20 μm BAPTA AM, a result suggesting that ATP hydrolysis was minimal. [ATP] ≥16 μm induced a sustained elevation in CBF and only a temporary, non-oscillating increase in[Ca2+]i. A similar response was induced by thapsigargin (2 μm). Flash photolysis of caged Ca2+ (NP-EGTA) produced both transient and prolonged increases in[Ca2+]i which were accompanied by transient and sustained increases in CBF, respectively. From these results, we propose that CBF can be increased by a direct Ca2+ -dependent mechanism that generates the rapid increases in CBF associated with the oscillations or by an indirect Ca2+-dependent mechanism that is responsible for the sustained minimum increase in CBF.
Mucociliary transport is a major defence mechanism of the respiratory tract (Wanner et al. 1996) and its efficiency is determined by the tip velocity of the cilia and the degree of co-operative (or metachronal) activity between cilia. Both tip velocity and co-operative activity are increased by increases in ciliary beat frequency (CBF) and, as a result a key parameter controlling mucus clearance is the regulation of CBF.
A major mechanism for regulating CBF is an increase in intracellular Ca2+ concentration ([Ca2+]i). While a variety of agonists can stimulate increases in[Ca2+]i and CBF, extracellular ATP appears to have an important role in regulating airway CBF because of its paracrine activity in airway tissues. ATP appears to be released by human (Watt et al. 1998; Donaldson et al. 2000; Lazarowski et al. 2000; Donaldson et al. 2002) and mice (Watt et al. 1998; Homolya et al. 2000) airway epithelial cells. Since ATP release also occurs in other tissues (Ferguson et al. 1997; Mitchell et al. 1998; Hazama et al. 1999; Ostrom et al. 2000), ATP may serve as a ubiquitous signalling molecule.
It is accepted that ATP acts via G-proteins coupled to P2Y receptors to activate phospholipase C-β (PLC) and induce the production of inositol 1,4,5-trisphosphate (IP3). This subsequently releases Ca2+ from intracellular stores via IP3 receptors (Berridge, 1993; Bootman et al. 2001). The resulting increase in[Ca2+]i initiates a corresponding increase in CBF (Korngreen & Priel, 1994;, 1996; Lansley & Sanderson, 1999; Uzlaner & Priel, 1999; Evans & Sanderson, 1999a, b; Lieb et al. 2002). The maximal increase in CBF induced by Ca2+ can be attained within several beat cycles (Lansley & Sanderson, 1999; Evans & Sanderson, 1999a). However, the subsequent changes in CBF and[Ca2+]i in response to ATP have been found to vary. In the simplest case, both the initial[Ca2+]i and CBF increases simultaneously declined to basal levels, a behaviour suggesting a direct regulatory action of Ca2+ in controlling CBF (Salathe & Bookman, 1999; Lieb et al. 2002). Alternatively, a small increase in CBF was sustained even though the[Ca2+]i declined to either basal levels (Lieb et al. 2002) or to a level above the basal level (Korngreen & Priel, 1996; Uzlaner & Priel, 1999). These responses suggest an indirect regulatory role for Ca2+ in controlling CBF. A more complicated post-stimulatory response involves repetitive increases in[Ca2+]i or Ca2+ oscillations while the CBF remain elevated (Salathe & Bookman, 1995; Evans & Sanderson, 1999a). This latter response is particularly interesting because Ca2+ oscillations are believed to serve as a frequency-modulated (FM) physiological signal to regulate cell function (Berridge, 1997) and have been observed in airway epithelial cells from rabbits (Boitano et al. 1992; Evans & Sanderson, 1999a, b), sheep (Salathe & Bookman, 1995), humans (Maizieres et al. 1998) and cows (Kanoh et al. 1999) in response to mechanical stimulation, neutrophil elastase, acetylcholine and ATP.
The mechanisms responsible for the variability in the CBF and Ca2+ responses induced by ATP are not well understood but may, in part, be accounted for by species-specific (Lieb et al. 2002) or agonist-specific variations. An additional explanation may be that the metabolites arising from ATP hydrolysis by ecto-nucleotidase activity serve to stimulate other signalling pathways (Morse et al. 2001). On the other hand, several studies suggest that changes in CBF, both during the initial responses and subsequent Ca2+ oscillations, are induced only by changes in Ca2+ (Salathe & Bookman, 1995, 1999; Evans & Sanderson, 1999a).
A common approach to verify how changes in CBF correlate with different patterns of[Ca2+]i mobilization has been the development of techniques to simultaneously measure CBF and[Ca2+]i in response to ATP (Korngreen & Priel, 1994, 1996; Evans & Sanderson, 1999a; Lansley & Sanderson, 1999; Uzlaner & Priel, 1999; Sanderson, 2000; Lieb et al. 2002). It is therefore surprising to find that most experiment work has been done with relatively low-speed recording systems when the accurate correlation of fast CBF with Ca2+ changes requires a system with a high temporal and spatial resolution. In addition, many studies use a fast Fourier transform (FFT) to analyse data that, by its requirement for a multipoint sample, reduces the temporal resolution of data.
We have consistently used high-speed video (240 frames per second, f.p.s.) and fast (30 f.p.s.) fluorescence imaging techniques to record CBF and[Ca2+]i changes, respectively (Sanderson, 2000). With this approach, we have found that ATP induced Ca2+ oscillations and a sustained CBF in rabbit trachea epithelial cells (Evans & Sanderson, 1999a). To further understand how Ca2+ regulated CBF, we explored the effects of a range of ATP concentrations on CBF and[Ca2+]i. Our previous studies (Evans & Sanderson, 1999a, b) were performed at room temperature but there would be greater insight if these responses of the cell were studied near to body temperature where the kinetics of kinases and phosphatases are increased. At warmer temperatures, faster CBFs are expected and the need for high-speed recording is greater. As a result, we describe here a new recording technique that combines high-speed digital imaging with simultaneous measurement of[Ca2+]i and the beat-by-beat CBF analysis. With this approach, we have found that ATP appears to increase CBF of rabbit trachea epithelial cells by two mechanisms. While both mechanisms are Ca2+ dependent, one mechanism appears to rely on the direct action of Ca2+ while the other mechanism appears to rely on an indirect action of Ca2+.
Methods
Materials
Hanks’ balanced salt solution (HBSS) without phenol red and Dulbecco's modified Eagle's Medium (DMEM) were obtained from Invitrogen Life Technologies (Carlsbad, CA, USA). HBSS was supplemented with 25 mm Hepes (sHBSS, pH 7.4). Fura-2 AM, Oregon Green 488, BAPTA-1 AM, o-nitrophenyl EGTA AM (NP-EGTA AM), calcium calibration buffers and fluorescent microspheres were obtained from Molecular Probes (Eugene, OR, USA). BAPTA AM and Pluronic F-127 were obtained from Calbiochem (La Jolla, CA, USA). Sulfobromophthalein, ATP, adenosine-5′-O-(3-thiotriphosphate) (ATP-γ-S), ADP, AMP, adenosine, l-ascorbic acid and DMSO were obtained from Sigma-Aldrich Corp. (St Louis, MO, USA). BAPTA AM, fura-2 AM and thapsigargin were dissolved in DMSO and diluted in sHBSS to the final working concentrations. Final DMSO concentrations were < 0.2 % for BAPTA AM and thapsigargin and < 0.1 % for fura-2 AM.
Cell culture
Adult New Zealand White rabbits (≈1.5 kg) were initially sedated with intramuscular xylazine (0.375 ml of 20 mg ml−1; 5 mg (kg body weight)−1) and ketamine HCl (≈1 ml of 100 mg ml−1; 35 mg (kg body weight)−1 and killed with intravenous pentobarbital sodium (≈3 ml of 50 mg ml−1; 100 mg (kg body weight)−1). Approval for this study was obtained from the Institutional Animal Care and Use Committee of University of Massachusetts Medical School. Primary cultures of airway epithelial cells were prepared from the trachea of the rabbits as previously described (Dirksen et al. 1995; Lansley & Sanderson, 1999; Evans & Sanderson, 1999a) and will only be briefly reviewed. After removal by dissection, the tracheal mucosa was cut into ≈0.5 mm squares, plated on collagen-coated glass coverslips, and cultured in DMEM supplemented with 10 % fetal bovine serum and penicillin/streptomycin at 37 °C in 10 % CO2 for 7 to 11 days.
Measurement of CBF with high-speed digital microscopy
We have replaced our analog data acquisition and analysis system (Lansley & Sanderson, 1999; Evans & Sanderson, 1999a; Sanderson, 2000) with a digital system. Phase-contrast images were detected with a digital high-speed camera (TM-6710, Pulnix America, Sunnyvale, CA, USA) using red light generated by filtration of a tungsten-halogen light source. This camera is a progressive scan CCD (charge-coupled device) that provides images (648 pixels × 200 lines) at 240 f.p.s. Slower (60 or 120 f.p.s.) or faster (350 f.p.s.) frame rates are available with an image consisting of 484 or 100 lines, respectively. The camera is used with a frame grabber (‘Road Runner’, BitFlow Inc., Woburn, MA, USA) and recording software (‘Video Savant’, IO Industries, London, ON, Canada) running under Windows 2000.
The digital images are saved directly to an array of SCSI (small computer system interface) hard drives configured as a stripped drive; the data storage rate is determined by the speed and number of the individual drives. For a recording rate of ≈120 megabyte per second (MB s−1), a stripped disk consisting of 4 Seagate Cheetah X15-36LP drives (ST318452LW, 160 Ultra SCSI, 18.4 gigabyte (GB), recording capacity ≈73.6 GB, 15 000 r.p.m. (revolutions per min)) is used. Additional stripped disks add recording capacity. A 100 GB Western Digital EIDE (Enhanced Integrated Drive Electronics) hard drive (WD1000BB-75CHE0, Ultra ATA/100, 7 200 r.p.m.) is also available for image storage. The system is controlled by a Super P4DC6 motherboard (Super Micro Computer Inc. CA, USA) with an Intel Xeon processor (1.5 GHz), 1 MB of memory and two on-board Ultra 160 SCSI interfaces.
We have developed a data analysis approach that can measure the period (frequency (Hz) = 1/period) of each ciliary beat cycle to match the high temporal resolution of the image capture rate. Although a similar algorithm was used in our previous work (Sanderson & Dirksen, 1985; Lansley et al. 1992; Lansley & Sanderson, 1999; Evans & Sanderson, 1999a; Sanderson, 2000), a detailed explanation, relevant to the new software, is given here. The CBF is measured from a waveform that is generated by the variation in grey-level intensity of the phase-contrast image that results from the repetitive motion of cilia (Fig. 1A and B). A region of interest (ROI, Fig. 1A), near the ciliary tip when the cilia are lying in the rest-phase position, is selected and the average grey-value is digitally extracted from the image data set and plotted with respect to time (i.e. frame number, Fig. 1B). We use an area of 0.87 by 0.80 µm (3 × 3 pixels) that contains about 5 cilia. Due to the resolution limits of the microscope, the cilia in the ROI may appear in bundles. The high signal-to-noise ratio of grey waveform is obtained by interactively selecting the optimal ROI. The frequency of each ciliary beat cycle is determined from the period of each cycle of the grey-intensity waveform.
Figure 1. Measurement of CBF by digital analysis of the variation in the light intensity of high-speed images.
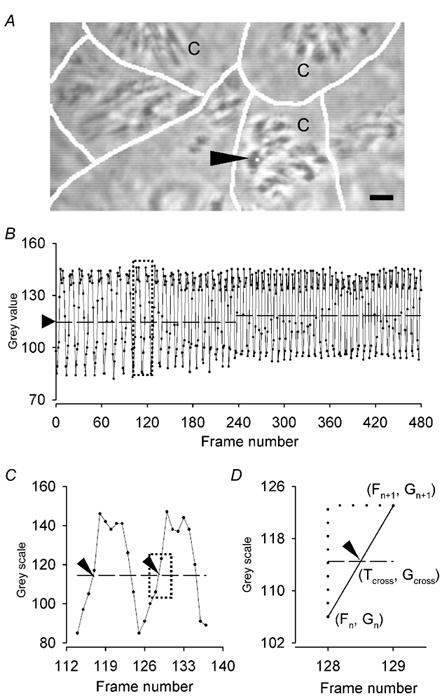
A, a digital phase-contrast image showing several rabbit trachea ciliated epithelial cells in culture. The cilia (C) appear dark and the white lines represent the location of cell borders. The size and position of the region of interest (ROI) from which the CBF was measured is indicated by the white square (arrowhead). Scale bar 5 µm. B, the waveform representing the change in the light or grey intensity of the image at the ROI indicated in A with respect to frame or image number. The points represent the actual data values. The cross-line (arrowhead) is the mid-point between the maximum and minimum grey intensity values of the waveform for each 1 s data segment (horizontal line). C, an expanded view of the dotted box shown in B to illustrate how the time interval (period) between neighbouring cross-points (arrowheads on dashed line) was determined in order to calculate the CBF (1/period). D, an expanded view of the dotted box highlighted in C to illustrate how the precise time of a cross-point (Tcross, Gcross, arrowhead) that occurred between two data values was determined. The changes in grey intensity from one frame to the next (Fn and Fn+1) were assumed to be linear; then, Tcross =[Fn+ (Gcross - Gn)/(Gn+1 - Gn)]/FPS, where FPS is the frame recording rate.
The key point for this analysis is the computation of a cross-point or line that can be used as the start and finish of each grey-intensity cycle. The cross-line (Gcross) is the mid-point between the maximum and minimum grey intensity (Gn) of the waveform. However, the intensity of the data set may drift with the result that a single Gcross is inappropriate for the whole data set and we calculate a new Gcross for each 1 s of data (Fig. 1B). The software automatically finds the time at which the waveform crosses the Gcross by determining the frame, Fn, where Gn < Gcross and the frame, Fn+1, in which Gcross < Gn+1. Under these conditions, the cross-point occurs at the beginning of each cycle as the grey intensity is increasing in a positive direction. However, signal noise can interfere with this algorithm to generate false cross-points. Consequently, the location of the cross-point can be determined from 4 or 6 frames; the grey intensity of each frame should increase such that Gn < Gn+1 < GcrossGn+2 < Gn+3.
Although the interpolated plot of the grey intensity has a unique time point at the Gcross value, this value often cannot be directly determined because of the discrete nature of the data, (time index of a single image, Fig.1D). Consequently, we assumed the change in grey intensity between two images (or as a function of time) is linear. As a result, the time of the cross-point (Tcross, Fig. 1D) can be more accurately determined with the following equation:
where, Fn is the frame number in which Gn< Gcross and Fn+1 is the frame number in which Gcross< Gn+1 and FPS is the frame recording rate (i.e. 240 f.p.s.). In the case where Gn = Gcross, then Tcross = Fn /FPS. The grey intensity data with respect to frame number and the beat period (frequency) with respect to time are saved in ASCII format for analysis with Excel2000 and custom-written macros.
Measurement of[Ca2+]i with fast imaging of fura-2
Cells were incubated in 1 µm fura-2 AM in sHBSS containing 100 µm sulfobromophthalein for 1 h at 37 °C, washed in sHBSS containing 100 µm sulfobromophthalein and allowed at least 30 min to de-esterify the fura-2 AM. The coverslip bearing the cells was mounted on a Nikon Diaphot 300 inverted microscope equipped with a ×40, 1.3 NA, Ph 4, oil-immersion objective. The cells were equilibrated in sHBSS for at least 10 min to reach the warm working temperature (29.5 ± 1°C). A warmer temperature was required to study the reactions of the cilia near body temperature. However, higher temperatures led to difficulties with evaporation artifacts.
The details of[Ca2+]i measurement have been described elsewhere (Sanderson et al. 1990; Leybaert et al. 1998; Lansley and Sanderson, 1999). Briefly, fluorescence (at 510 nm), generated by exciting the fura-2-loaded cells with 340 or 380 nm light, was detected with a silicon-intensified target (SIT) camera (Cohu, San Diego, USA). An optical memory disc recorder (OMDR, Panasonic TQ3031F) was used to record the images in real-time (30 f.p.s.) or in time-lapse (4 f.p.s.) without frame averaging. Calcium measurements were made by determining the normalized change in fluorescence (ft/f0) from an ROI (of an area of 1.8 by 1.6 µm, 6 × 6 pixels) at the base of the same cilia used for beat frequency measurements. The[Ca2+]i was calculated from this value as well as the original[Ca2+]i, the starting fluorescence and the reference[Ca2+]i as described by Leybaert et al. (1998).
The temporal alignment of the images captured for measuring fluorescence (4 or 30 f.p.s.) with the phase-contrast images captured for measuring CBF (240 f.p.s.) was achieved by the simultaneous recording of a time marker that consisted of the movement of a glass micropipette containing fluorescent microspheres (diameter 2 µm). For spatial alignment of the two images, a phase-contrast sequence of ciliary movement was recorded with the SIT camera.
As the dissociation constant (Kd) of fura-2 is affected by temperature and the ionic conditions (Uto et al. 1991), an in vitro calibration was performed to determine the Kd of fura-2 (Tsien & Pozzan, 1989). A thin calibration chamber made from two cover-slips (see Lansley & Sanderson, 1999) was placed on the microscope and a series of solutions containing different Ca2+ concentrations with 5 µm fura-2 were sequentially drawn through the chamber by capillary action (low to high [Ca2+]) and the respective 340/380 ratios were obtained. The range of Ca2+ concentrations was generated by mixing stock solutions containing 0 Ca2+ or 39 µm free Ca2+ and 10 mm EGTA in 100 mm KCl, 1 mm free Mg2+, pH 7.2. The log Kd (Kd = 163 ± 18 nm, n = 8) was determined from the calibration curve where log[Ca2+] was plotted against log[(R - Rmin)/(Rmax - R)(f380max /f380min)] and the point at which log[(R - Rmin)/(Rmax - R)(f380max/f380min)] = 0 (see Molecular Probes - Calibration Kits). The minimum (Rmin) and maximum (Rmax) ratio measured for our imaging system with 5 µm fura-2 on separate occasions over 3 months was 0.24 ± 0.02 and 8.53 ± 0.57, respectively (n = 8).
Measurement of[Ca2+]i with imaging of Oregon Green
Flash photolysis of caged Ca2+ (NP-EGTA) was used to experimentally increase the[Ca2+]i. Cells were initially loaded with 20 µm Oregon Green 488 BAPTA-1 AM in sHBSS containing 0.2 % Pluronic F-127 for 1 h at 37 °C followed by 5 µm NP-EGTA AM for 30 min at room temperature. Cells were washed in sHBSS and allowed 30 min for de-esterification. All solutions contained 100 µm sulfobromophthalein and 3 mg ml−1 ascorbic acid. The experimental setup is described elsewhere (Leybaert & Sanderson, 2001). An ultraviolet light flash, focused to a spot, was generated from an Hg arc lamp band-pass filtered at 330 nm and a mechanical shutter with an exposure time of 0.5 s. Fluorescence (at 523 nm), generated by activating the Oregon Green-loaded cells with excitation light of 485 nm, was detected with the SIT camera and recorded at 4 f.p.s.
Simultaneous measurement of CBF and[Ca2+]i
Simultaneous imaging of CBF and[Ca2+]i was achieved by directing the different wavelengths of light forming the phase-contrast (red) and fluorescence (green) images to the respective cameras (CCD, SIT) with a dichroic beam splitter (655 nm). Details of this setup are described elsewhere (Sanderson, 2000).
Drug application
To replace the solution in the experimental chamber (300 µl), 1 ml of solution containing the drug was added to the chamber by micropipette while an equal volume was removed simultaneously by suction. In experiments with multiple drug exposures, the cells were allowed to recover for 20 min between trials; 10 min was reported to be enough time for a full recovery of sensitization of receptors (Morales et al. 2000).
Data analysis and statistics
The mean basal CBF and[Ca2+]i were calculated from the first 10 s of data. Oscillations in CBF were characterized by the mean minimum and maximum CBF, and these were divided by the mean basal CBF to obtain a normalized CBF value. The normalized change in[Ca2+]i (Δ[Ca2+]i) was calculated by subtracting the basal value from the observed value. Normalized CBF and [Ca2+] were used to facilitate the comparison of cells with slightly different starting conditions and to be compatible with the other studies in the literature.
All data are expressed as means ± s.e.m. Statistical analysis was performed through one-way analysis of variance (ANOVA) (Student-Newman-Keuls method for further multiple pairwise comparisons) or Kruskal-Wallis ANOVA on ranks (Dunn's method for further multiple pairwise comparisons). Comparison of pair-data was done using paired-samples t test. A value of P < 0.05 was considered statistically significant.
Results
High-temporal resolution recordings of CBF
A major advantage of our high-speed digital recording system is that it measures the duration of each ciliary beat cycle, beat-by-beat, and this has allowed us to measure rapid changes in CBF (see later). In addition, it has also led to the observation that the basal CBF is variable. At ≈30 °C, the basal CBF was 13.7 ± 0.3 Hz, but this ranged from 7.5–22.4 Hz (n = 141 cells) in different cells. More importantly, individual cells also displayed a variation in the basal CBF; the basal CBF varied from beat to beat with time. For example, Fig. 2A demonstrates a cell that has a basal CBF that ranges from 13.9 to 16.4 Hz (measured during the first second of recording).
Figure 2. Fast and prolonged changes in CBF were detected by digital high-speed imaging in combination with a beat-by-beat analysis of CBF.
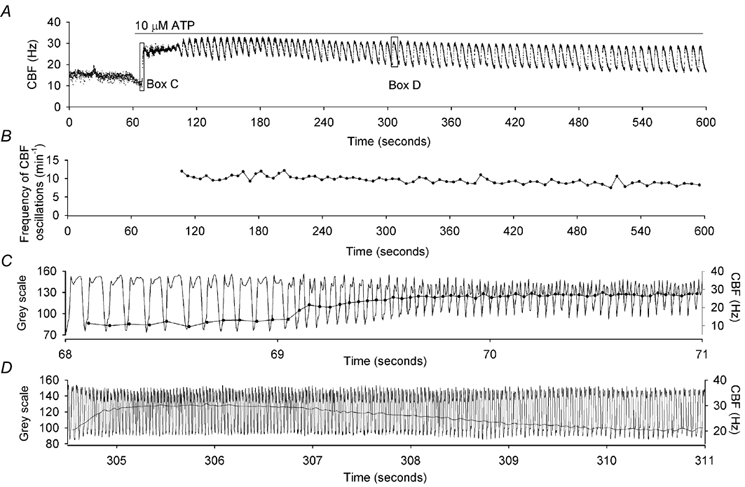
A, a representative trace of changes in CBF (•) with respect to time of a rabbit tracheal epithelial cell (in culture for 8 days) in response to 10 µm ATP. The application of ATP elicited a rapid increase in CBF, followed by a prolonged period during which the CBF oscillated. Each dot represents the CBF of each ciliary beat cycle calculated from variation in grey intensity as illustrated in C and D. B, the frequency of the ATP-induced CBF oscillations shown in A (measured oscillation by oscillation) remained relatively constant with respect to time. C, a portion (Box C from A) of the underlying waveform showing the variation in the grey intensity (left axis) with respect to time from which the CBF was calculated. ATP rapidly increased the CBF from ≈13 to ≈28 Hz (continuous line with •, right axis).The symbol (•) represents the CBF of each beat cycle plotted at the end of each beat cycle. D, another portion (Box D from A) of the underlying waveform of the variation in grey intensity at a time when the CBF was oscillating representing one oscillation in CBF. The compression and subsequent relaxation of the waveform represents the increase and decrease in CBF (right axis). During this oscillation, the CBF rapidly increased from ≈20 to 30 Hz and gradually declined back to ≈20 Hz.
Response of the CBF and [Ca2+]i to ATP
In general, the response of the CBF and[Ca2+]i to the addition of ATP consisted of three phases. Initially, there was a rapid increase in CBF and[Ca2+]i (Figs 2A and C, 3 and 4). During this phase, the CBF increased from the basal frequency to the new higher frequency within ≈14 beat cycles (≈0.5 s) although ≈ 50 % of the increase in CBF occurred within 2 beat cycles (Fig. 2C). The second phase of the response to ATP was less well defined, but generally consisted of rapid variations or small oscillations in CBF with a slower increase in the minimum CBF (Figs 3B-E, 3G-J and 4B-E). During this phase, the[Ca2+]i reached a maximum level and tended to oscillate rapidly. The variability of this phase seemed to arise because it represented a transitory phase. In the third phase, the CBF and[Ca2+]i showed prominent and prolonged oscillations (Figs 2A and D, 3B-J and 4B-E). The frequency of the oscillations in CBF remained relatively constant for ≈8 min (Fig. 2B); a response that suggests that neither receptor accommodation nor agonist degradation was occurring. In a single CBF oscillation, the CBF increased within 8–10 beat cycles while the reduction in CBF extended over many seconds (Fig. 2D). This complex CBF response to ATP highlights the fundamental capability of the digital recording technique, namely, the ability to record at high resolution for long periods so that each oscillation in CBF can be detected (Fig. 2A).
Figure 3. Individual variation and range of CBF responses to increasing ATP concentrations displayed by two representative ciliated epithelial cells.
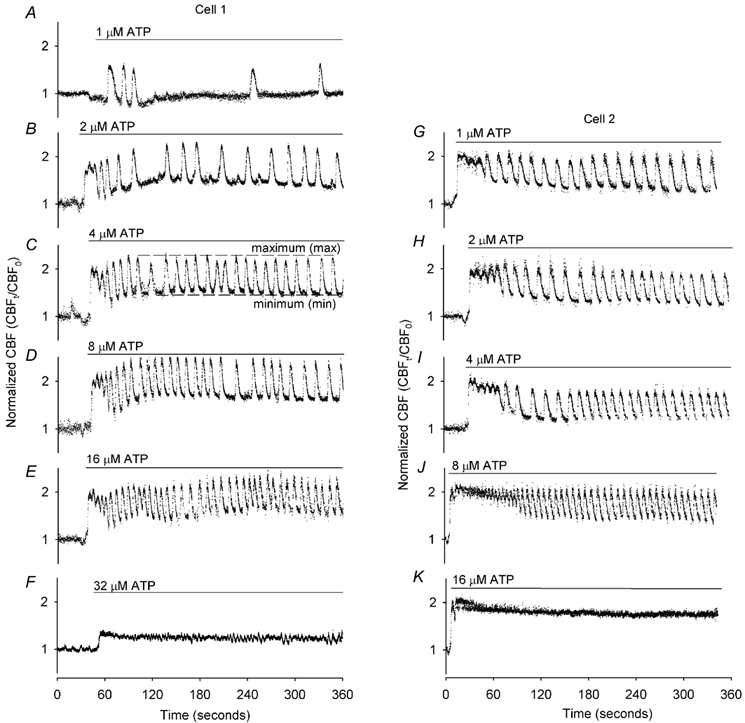
Each individual cell was sequentially exposed to a range of [ATP]o (horizontal bars); one cell (Cell 1) was exposed to 1 to 32 µm ATP (A-F), while the second cell (Cell 2) was exposed to 1 to 16 µm ATP (G-K). A, 1 µm ATP elicited an initial transient increase in CBF followed by a few irregular oscillations in CBF. B-E, higher concentrations of ATP induced an initial increase in CBF that was followed by regular periodic oscillations in CBF. The frequency of CBF oscillation increased with increasing ATP concentration. F, relatively high concentrations of ATP (32 µm) induced a sustained elevation in CBF without CBF oscillations. ATP induced a very similar series of responses in CBF in the second example cell (G-K) but, in this cell, each sequential response was induced by lower concentrations of ATP. The basal CBF of these two cells was 14.5 ± 1.4 Hz (n = 6) and 15.0 ± 0.4 Hz (n = 5).
Figure 4. Representative traces of the simultaneous changes in CBF (•) and[Ca2+]i (magenta line) in ciliated epithelial cells in response to ATP (horizontal bars).
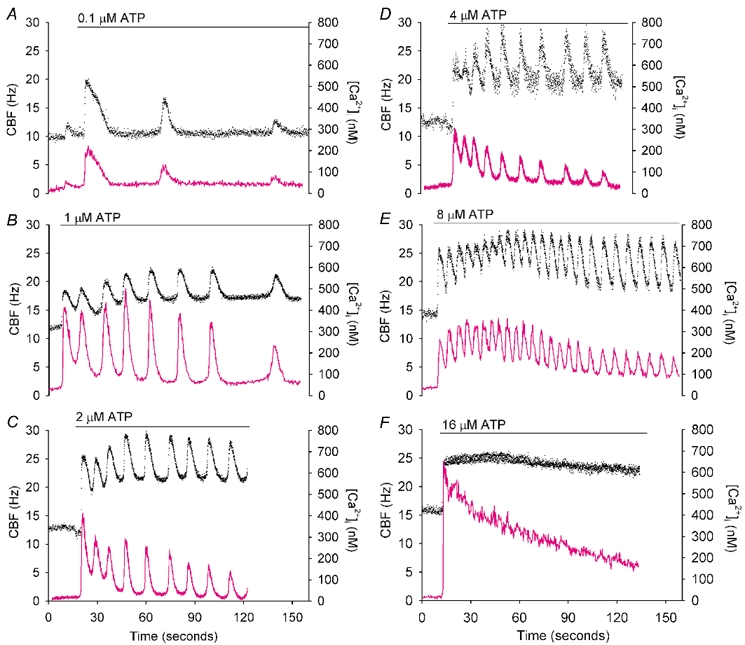
A, a transient initial increase in CBF and[Ca2+]i was induced by 0.1 µm ATP, and this was followed by a few irregular oscillations in both and CBF and[Ca2+]i from the basal rate (n = 6 cells). B-E, ATP, ranging from 1 to 8 µm, induced rapid increases in CBF and[Ca2+]i that were followed by oscillations in both CBF and[Ca2+]i. The CBF oscillations occurred from an elevated minimum CBF while the[Ca2+]i oscillations occurred from a baseline that declined to the basal level (n = 15 cells). F, at relatively high concentrations, ATP (>16 µm) induced an initial increase in CBF and[Ca2+]i, but while the CBF was sustained at an elevated rate, the[Ca2+]i gradually decreased to the basal level (n = 9 cells).
While an initial increase in CBF is common to all exposures of ATP, the subsequent changes in CBF and[Ca2+]i were determined by the ATP concentration and the responsiveness of the individual cell (Fig. 3 and Fig. 4). In response to low concentrations of ATP (1 µm), an initial transient increase in CBF was observed. Subsequently, the CBF returned to the basal rate although this was followed by a few additional irregular transient increases in CBF (Fig. 3A and Fig. 4A). As the changes in CBF in each transient were coupled to the changes in[Ca2+]i, a similar response was observed for the changes in[Ca2+]i. The initial Ca2+ transient (Δ[Ca2+]i), consisting of an increase of 182 ± 30 nm (n = 5), rapidly returned to the basal level with a half-life time of 5.2 ± 0.7 s (n = 5) and was followed by irregular transient increases in the[Ca2+]i (Fig. 4A). Lower ATP concentrations (0.1 µm) only induced a transient increase in CBF and[Ca2+]i, with the CBF returning to the basal level (1.05 ± 0.03, n = 5, Fig. 5C).
Figure 5. The effects of ATP on the major parameters used to characterize the changes in CBF and[Ca2+]i.
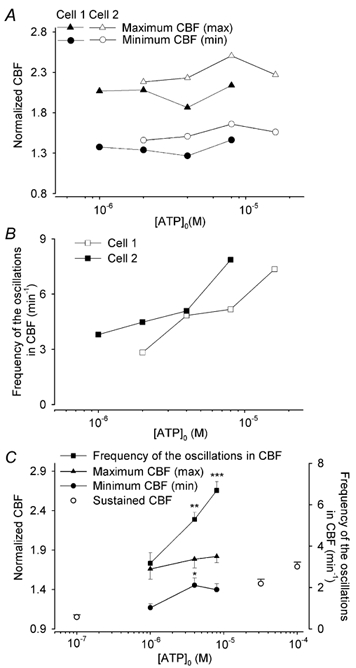
A, the concentration-response relationship for ATP on the normalized mean maximum CBF (max, triangles) and minimum CBF (min, circles) and B the frequency of the oscillations in CBF (squares) for the two representative cells shown in Fig. 3 (Cell 1, filled symbols, Cell 2,open symbols). With increasing ATP concentrations, the mean maximum and minimum CBF were relatively constant, while the frequency of the oscillations in CBF increased. C, the averaged effects of ATP on the characteristics of the CBF oscillations; 4 µm (n = 8 cells) or 8 µm (n = 9 cells) ATP induced a significantly higher frequency of the oscillation in CBF as compared to that induced by 1 µm ATP (n = 6 cells, squares) whereas increasing concentrations of ATP did not significantly alter the response of mean maximum CBF (triangles). The addition of 4 µm ATP caused a higher elevation in normalized minimum CBF (1.45 ± 0.09, n = 8 cells, P < 0.05) as compared to that induced by 1 µm ATP (1.17 ± 0.05, n = 6 cells, circles), but no statistical difference was found between the effects induced by 8 µm ATP (1.40 ± 0.08, n = 9 cells); *P < 0.05, **P < 0.01, ***P < 0.001. A concentration-response relationship between the CBF and ATP concentration is evident when the non-oscillatory CBF responses (○, not connected by lines) to ATP concentrations of 0.1 (1.05 ± 0.03, n = 5), 32 (1.47 ± 0.06, n = 6) and 100 µm (1.69 ± 0.06, n = 6)) are considered. Data values are represented as means ±s.e.m.
At higher concentrations of ATP (>1 µm; doubling concentrations between 2 and ≤ 16 µm) and depending on the sensitivity of the individual cell, the initial transient increase in CBF broadened and a prominent series of oscillations in CBF developed (Fig. 3B-E, and G-J). Again, each change in CBF was coupled with a change in[Ca2+]i and the Ca2+ displayed oscillatory changes in concentration but, in contrast to the CBF, the oscillatory increases in[Ca2+]i originated from a declining minimum level (Fig. 4B-E). In a typical preparation, 1, 4 or 8 µm ATP induced 32.6 % (14/43 cells), 36.5 % (27/74 cells) or 45.2 % (47/104 cells), respectively, of the airway epithelial cells to display Ca2+ oscillations. Two supplementary videos (http://www.jphysiol.org/cgi/content/full/546/3/733) illustrate these responses. Video 1 shows the Ca2+ oscillations of airway epithelial cells induced by 8 µm ATP (at ×5 real time). Video 2 simultaneously shows the CBF and Ca2+ changes of a single cell (arrow) during the initial exposure to 2 µm ATP and during one of the subsequent Ca2+ oscillations (at 1/8th real time) (also see Fig. 2C and D).
At even higher concentrations of ATP (≥16 µm), both the CBF and[Ca2+]i displayed a rapid increase but the oscillatory behaviour of both the CBF and[Ca2+]i was lost (Figs 3F and K and 4F). The initial increase in[Ca2+]i, (518 ± 61 nm, n = 7) declined towards the basal level with a half-life time of 63.6 ± 19.0 s (n = 7). In contrast to the[Ca2+]i, the CBF was sustained at an elevated rate (Fig. 4F). Similar responses were also observed at ATP concentrations of 32 and 100 µm; the non-oscillatory elevated CBF was sustained at a normalized rate of 1.47 ± 0.06 (n = 6) and 1.69 ± 0.06 (n = 6), respectively (Fig. 5C).
The oscillations in CBF could be characterized with the following parameters: (i) the mean maximum CBF (max), (ii) the mean minimum CBF (min) (Fig. 3C) and (iii) the frequency of the oscillations in CBF (cycles per minute). For the representative cells shown in Fig. 3A-F and G-K, increasing ATP concentrations resulted in a substantial increase in the frequency of the oscillations in CBF (Fig. 5B) from ≈2 and 4 min−1 at 2 µm ATP to ≈7 min−1 at 16 and 8 µm ATP, respectively. In contrast, the maximum and minimum CBF only showed a small increase with respect to increases in ATP concentration (Fig. 5A). The mean analysis of these characteristics for a larger number of cells supported similar conclusions (Fig. 5C). Increasing ATP concentrations (from 1 to 8 µm) significantly increased the frequency of the oscillations in CBF; 1, 4 or 8 µm ATP induced a frequency of 3.2 ± 0.5 (n = 6), 5.3 ± 0.3 (n = 8), and 6.7 ± 0.4 min−1 (n = 9), respectively (Fig. 5C). However, the maximum CBF had a tendency to increase but this was not statistically different (Fig. 5C); 1, 4 or 8 µm ATP induced a 1.66 ± 0.13 (n = 6), 1.79 ± 0.11 (n = 8), or 1.82 ± 0.08 (n = 9) increase in the normalized maximum CBF, respectively. The normalized minimum CBF of the CBF oscillations also appeared to increase with ATP concentration from 1 to 4 µm (1.17 ± 0.05, n = 6, and 1.45 ± 0.09, n = 8, respectively, P < 0.05), but no significant increases were induced by 8 µm ATP (1.40 ± 0.08, n = 9) suggesting that a steady minimum CBF had been reached. However, if the range of the ATP concentrations was expanded to include 0.1 and 100 µm ATP, a concentration- response relationship could be observed. Low (≤ 1 µm) or high (≥ 32 µm) concentrations of ATP either did not alter the CBF or induced a sustained increase in CBF (Fig. 5C) while intermediate ATP concentrations (2–16 µm) induced oscillations in CBF.
As the CBF and[Ca2+]i oscillations were always coupled, the frequency of[Ca2+]i oscillations increased in an identical manner to the increase in frequency of the oscillations in CBF (CBF oscillation curve of Fig. 5C). However, the magnitude of the maximum increase in[Ca2+]i of each Ca2+ oscillation at all ATP concentrations (different oscillation frequencies) remained relatively constant. At 1, 4, and 8 µm, the mean maximum increase in[Ca2+]i was 234 ± 78 (n = 6), 271 ± 30 (n = 8) and 240 ± 39 nm (n = 9), respectively. In contrast, the magnitude of the initial[Ca2+]i transient increase induced by 1, 4 or 8 µm ATP was 300 ± 79 (n = 6), 393 ± 53 (n = 8), or 457 ± 68 nm (n = 9), respectively. In each case, the magnitude of the transient increases in[Ca2+]i were significantly higher than the mean maximum increases in[Ca2+]i of the oscillations (P < 0.05). Taken together, these results imply that the elevated minimum CBF may not be directly dependent on Ca2+ oscillations, while the initial increase in CBF is Ca2+ coupled.
The effect of ATP-γ-S on CBF and[Ca2+]i
The hydrolysis of ATP by ectonucleotidases could rapidly decrease the ATP concentration (Picher & Boucher, 2001) as well as release metabolites, i.e. ADP, AMP and adenosine, which could also serve as agonists to alter CBF (Morse et al. 2001). Consequently, to determine if the oscillatory changes in CBF and[Ca2+]i were influenced by ATP hydrolysis, we investigated the effects of the non-hydrolysable analogue, ATP-γ-S. In nearly all aspects, we found that ATP-γ-S induced almost identical changes in CBF and[Ca2+]i to those induced by ATP (Tables 1 and 2, Fig. 6).
Table 1.
Comparison of the effects of ATP and ATP-γ-S on CBF
| Frequency of the oscillations in CBF (min−1, n) | Normalized CBF | |||||
|---|---|---|---|---|---|---|
| Mean minimum (n) | Mean maximum (n) | |||||
| [Agonist]o (μm) | ATP | ATP-γ-S | ATP | ATP-γ-S | ATP | ATP-γ-S |
| 1 | 3.2 ± 0.5 (6) | 3.4 ± 0.7 (5) | 1.17 ± 0.05 (6) | 1.31 ± 0.06 (5) | 1.66 ± 0.13 (6) | 1.92 ± 0.11 (5) |
| 4 | 5.3 ± 0.3 (8) | 6.6 ± 0.6 (4) | 1.45 ± 0.09 (8) | 1.32 ± 0.07 (4) | 1.79 ± 0.11 (4) | 1.97 ± 0.19 (4) |
| 8 | 6.7 ± 0.4 (9) | 6.8 ± 1.2 (4) | 1.40 ± 0.08 (9) | 1.57 ± 0.16 (4) | 1.82 ± 0.08 (9) | 2.07 ± 0.09 (4) |
Data show the effects of ATP and ATP-γ-S on the oscillations in CBF and the normalized minimum and maximum CBF. No statistical difference was found between the values induced by the same concentration of ATP and ATP-γ-S.
Table 2.
Comparison of the effects of ATP and ATP-γ-S on [Ca2+]i
| Δ[Ca2+]i (nm) | ||||
|---|---|---|---|---|
| [Agonist]o (μm) | Initial increase | Mean maximum increase | ||
| ATP | ATP-γ-S | ATP | ATP-γ-S | |
| 1 | 300 ± 79 (6) | 395 ± 36 (5) | 234 ± 78 (6) | 294 ± 36 (5) |
| 4 | 393 ± 53 (8) | 565 ± 113 (4) | 271 ± 30 (8) | 476 ± 80 (4)* |
| 8 | 457 ± 68 (9) | 545 ± 88 (4) | 240 ± 39 (9) | 495 ± 67 (4)** |
Data show the effects of ATP and ATP-γ-S on the initial and mean maximum [Ca2+]i, changes. No statistical difference was found between the initial [Ca2+]i increase induced by same concentration ATP and ATP-γ-S, respectively. 4 and 8 μm ATP-γ-S induced significantly higher mean maximum [Ca2+]i changes than that of induced by ATP (
P < 0.05
P < 0.01).
Figure 6. Simultaneous changes in CBF (•) and[Ca2+]i (magenta line) in response to 1, 4 and 8 µm ATP-γ-S (horizontal bar) observed in three representative ciliated cells.
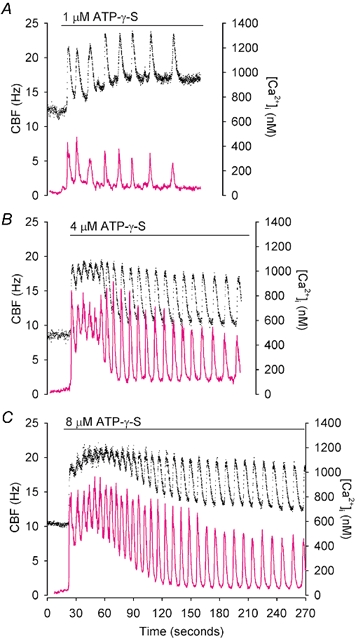
In all cases, ATP-γ-S induced an initial rapid increase in both[Ca2+]i and CBF that was followed by oscillations in both[Ca2+]i and CBF. The minimum CBF remained elevated while the minimum level of the[Ca2+]i declined to the basal level. Higher [ATP-γ-S] induced a higher frequency of the oscillations in CBF. These responses were indistinguishable from the effects induced by similar concentrations of ATP.
An initial increase in both CBF and[Ca2+]i as well as the production of sustained oscillations in CBF and[Ca2+]i was induced by ATP-γ-S (Fig. 6). The frequency of the oscillations in CBF with increasing concentrations of ATP-γ-S was similar to the frequency of the oscillations in CBF induced by ATP (Table 1). The mean maximum and minimum CBF induced by ATP-γ-S or ATP were not statistically different (Table 1). The only difference found was that the mean maximum Ca2+ increase induced by 4 and 8 µm ATP-γ-S was significantly higher than that induced by the same concentration of ATP (P < 0.05, Table 2). These results, together with the fact that the frequency of ATP-induced oscillations in CBF remained constant for >≈8 min, suggest that ATP hydrolysis is not required for the establishment and maintenance of CBF oscillations.
The effect of metabolites released by ATP hydrolysis on CBF and[Ca2+]i
To address the idea that the metabolites of ATP hydrolysis did not significantly influence the ATP-induced CBF and[Ca2+]i responses during the course of our experiments, we examined the response of cells to 8 µm ADP, AMP and adenosine. At this concentration, the complete hydrolysis of 8 µm ATP was inferred but ADP, AMP and adenosine did not induce any obvious changes in[Ca2+]i. However, these metabolites did induce a slow increase in CBF (Fig. 7). The sustained CBF increase induced by adenosine (1.29 ± 0.06, n = 9 cells) and AMP (1.23 ± 0.07, n = 4 cells) was larger than that induced by ADP (1.06 ± 0.03, n = 5 cells) (Fig. 7). While the CBF induced by 8 µm ADP was significantly lower than the minimum value of the CBF oscillations induced by 8 µm ATP (1.40 ± 0.08, n = 9 cells), there was no difference between the CBF induced by AMP or adenosine and the minimum CBF induced by ATP.
Figure 7. The simultaneous effects of the metabolites of ATP hydrolysis on CBF (•) and[Ca2+]i (magenta line).
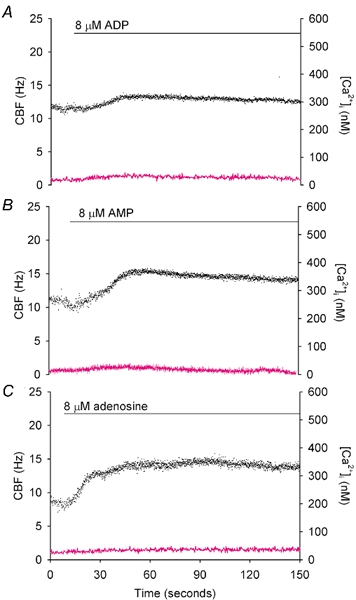
A, representative recording of the effect of 8 µm ADP on CBF and[Ca2+]i shows that the CBF was slightly elevated (normalized CBF 1.06 ± 0.03, n = 5 cells) while there was no change in[Ca2+]i. B, representative recording of the effect of 8 µm AMP on CBF and[Ca2+]i shows that the CBF gradually increased to a sustained normalized rate of 1.23 ± 0.07 (n = 4 cells) again, without any change in[Ca2+]i. C, representative recording of the effect 8 µm adenosine on changes in CBF and[Ca2+]i shows a similar increase in the normalized CBF to 1.29 ± 0.06 (n = 9 cells) without a change in[Ca2+]i.
The effect of buffering[Ca2+]i on the response to ATP and ATP-γ-S
Since adenosine, AMP and ADP acted in a Ca2+-independent manner and ATP acted in a Ca2+-dependent manner, the contribution of adenosine, AMP and ADP to the ATP-induced changes in CBF should be isolated from the effects of ATP by blocking the action of the ATP with an intracellular Ca2+ buffer, such as BAPTA. After cells were loaded with 20 µm BAPTA AM at 30 °C for 30 min, 8 µm ATP-γ-S failed to induce substantial increases in the CBF and[Ca2+]i (Fig. 8A). This result indicates that, in the absence of any ATP hydrolysis or metabolites, the Ca2+ buffering provided by the intracellular BAPTA is sufficient to abolish the influence of ATP-γ-S. Similarly, no substantial change in CBF or[Ca2+]i was observed when ATP was added (Fig. 8B). There was no significant difference between the CBF in the presence of 8 µm ATP (1.03 ± 0.03, n = 6) or 8 µm ATP-γ-S (1.02 ± 0.04, n = 5). As adenosine and AMP, and perhaps ADP, increase CBF without increasing[Ca2+]i, this failure to increase CBF in response to ATP and ATP-γ-S is consistent with the idea that, during the 3 min time course of our experiments, the amount of ATP hydrolysis that is occurring is not significant and that the increases in CBF are dependent only on increases in Ca2+.
Figure 8. The effect of buffering the[Ca2+]i with BAPTA AM on the response to ATP and ATP-γ-S.
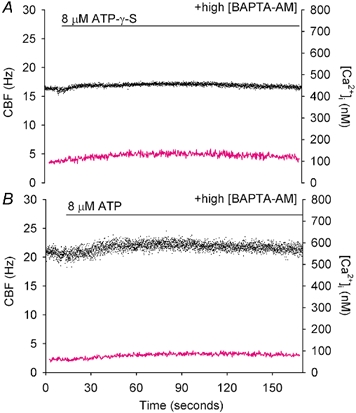
A, representative response of a ciliated cell pre-treated with 20 µm BAPTA AM and exposed to 8 µm ATP-γ-S (horizontal bar). The BAPTA buffering prevented any increases in[Ca2+]i (magenta line) and abolished the CBF response (•; n = 6 cells). B, representative ciliated cell pre-treated with 20 µm BAPTA AM and exposed to 8 µm ATP (n = 5 cells). No substantial increase in either the[Ca2+]i or the CBF occurred.
The effect of removing ATP on the CBF and[Ca2+]i
The oscillatory CBF response to ATP appeared to be composed of two processes: the maintenance of a sustained and elevated minimum CBF and the oscillatory increases in CBF that were superimposed on the elevated minimum CBF. Because both these processes involved changes in[Ca2+]i induced by ATP, but not ATP metabolites, we are left with the question, what aspect of the ATP-induced[Ca2+]i changes determines each process? The sustained minimum CBF may result from an active mechanism involving stimulation by each[Ca2+]i oscillation, or it may result from a passive mechanism involving the inability of the CBF to return to basal rate in the time between the[Ca2+]i oscillations. To address this latter idea, we exposed cells to 4 µm ATP, and once oscillations were established, the ATP was quickly washed away with sHBSS to determine if the CBF would rapidly fall to the basal rate.
A typical stimulation of oscillations in CBF and[Ca2+]i in response to 4 µm ATP was observed (Fig. 9A). After about 1 min, the oscillations in[Ca2+]i occurred from the basal level while the oscillations in CBF occurred from an elevated minimum rate. Upon the removal of ATP, both the CBF and[Ca2+]i oscillations ceased, but the CBF initially remained near the minimum CBF. Subsequently, the CBF gradually returned to the basal rate with a half-life time of 88.0 ± 5.6 s (n = 6 cells). These results indicate that Ca2+ oscillations require continuous ATP-stimulation and that the oscillatory increases in CBF are directly dependent on Ca2+.
Figure 9. The simultaneous changes in CBF and[Ca2+]i in response to (A) the removal of ATP, (B and C) low-levels of Ca2+ buffering.
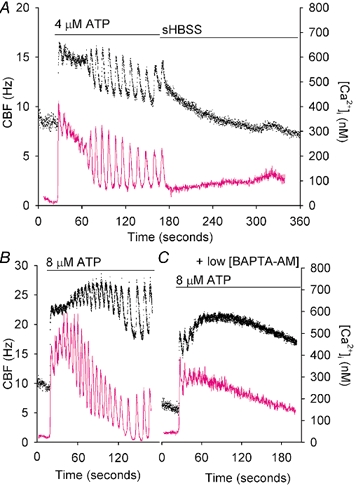
A, a cell was stimulated with 4 µm ATP to induce a typical response in both CBF (•) and[Ca2+]i (magenta line). Once the oscillatory responses in CBF and[Ca2+]i were established, the ATP was washed away, with the result that the oscillations in CBF and[Ca2+]i ceased. However, the CBF initially remained at the elevated minimum rate and only gradually returned to the basal rate (lower dotted line) with an average half-life time of 88.0 ± 5.6 s (n = 6 cells). B and C, the CBF and[Ca2+]i responses induced by 8 µm ATP in a representative ciliated cell before (B) and after (C) 2.5 µm BAPTA AM treatment. The addition of ATP elicited a typical oscillatory response in both CBF and[Ca2+]i (B) but the same cell after treatment with 2.5 µm BAPTA AM, only responded to ATP with a sustained changes in CBF and[Ca2+]i (C). While the[Ca2+]i gradually declined to the basal rate, the CBF remained at an elevated rate (n = 6 cells).
The effect of Ca2+ oscillations on the elevated minimum CBF
To explore the possibility that the minimum CBF is maintained by the Ca2+ oscillations, we abolished the ATP-induced Ca2+ oscillations by loading the cells with a lower concentration of BAPTA AM. Initially, a typical ATP response consisting of CBF and[Ca2+]i oscillations was induced with 8 µm ATP in individual cells (minimum CBF was equal to 1.50 ± 0.13, n = 6, Fig. 9B). These cells were washed with sHBSS, allowed to recover, and loaded with 2.5 µm BAPTA AM at 30 °C for 30 min before being stimulated again with 8 µm ATP. Under these conditions, ATP induced a similar initial increase both in CBF and[Ca2+]i except that the subsequent oscillations in[Ca2+]i and CBF were abolished (Fig. 9C).
As might be expected, the exposure to low concentrations of BAPTA AM reduced the maximal increase in[Ca2+]i in response to ATP (without BAPTA, the maximal changes in[Ca2+]i = 555 ± 58 nm, n = 6; with BAPTA,[Ca2+]i = 272 ± 25 nm, n = 6, P < 0.001). However, despite this smaller increase in[Ca2+]i, the CBF was elevated initially to a similar rate (1.54 ± 0.14, n = 6, P > 0.05) but this rate was not sustained and the CBF declined slowly (Fig. 9C). These results, together with those from Fig. 9A, suggest that the integrated increase in[Ca2+]i associated with multiple Ca2+ oscillations is required for a sustained minimum CBF.
The effect of a sustained increase of[Ca2+]i on CBF
To investigate the relationship between a sustained increase in[Ca2+]i and CBF, we prevented Ca2+ uptake into the intracellular Ca2+ stores by inhibiting the endoplasmic Ca2+-ATPase pumps with thapsigargin, while measuring CBF. When cells were exposed to 2 µm thapsigargin, the[Ca2+]i increased due to the leakage of Ca2+ from the endoplasmic reticulum (ER) and an accompanying increase in CBF was observed (Fig. 10A). After the[Ca2+]i reached a maximum value (231 ± 12 nm, n = 4) similar to that induced by a low concentration of ATP (≤ 1 µm, P > 0.05, Fig. 4A), the[Ca2+]i gradually declined to the basal level with a significantly longer half-life time of 56.4 ± 4.6 s (n = 4, P < 0.001) compared with that induced by a low concentration of ATP (Fig. 4A). However, the CBF remained at an elevated rate for the course of the experiment. While brief increases in[Ca2+]i only induced transient increases in CBF (Fig. 3A and Fig. 4A), a sustained increase in CBF accompanied by a prolonged increase in[Ca2+]i without Ca2+ oscillations was also observed in response to high concentrations of ATP (Figs 3F and K and 4F).
Figure 10. The effects of (A) thapsigargin and (B and C) flash photolysis of caged Ca2+ on the[Ca2+]i (magenta line) and CBF (•).
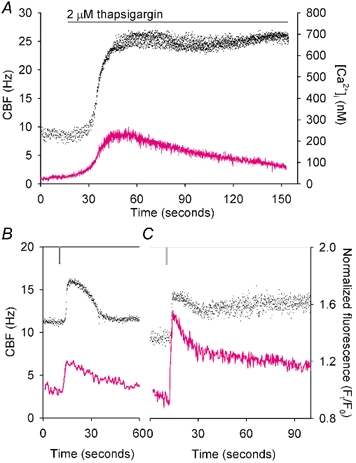
A, response to 2 µm thapsigargin (horizontal bar), the representative ciliated cell showed a relatively slow increase in both CBF and[Ca2+]i. After the maximal increase (231 ± 12 nm, n = 4),[Ca2+]i gradually returned to the basal level, with a half-life time of 56.4 ± 4.6 s (n = 4), while the CBF remained at an elevated rate. B and C, cells loaded with 20 µm Oregon Green BAPTA-1 AM and 5 µm NP-EGTA AM were exposed to UV light for 0.5 s (vertical lines). B, while a brief[Ca2+]i increase with mean half-life time of 14.8 ± 1.7 s (n = 5) was accompanied by a transient CBF response; C, a prolonged[Ca2+]i increase with mean half-life time of decay of 28.0 ± 3.6 s (n = 5) was accompanied by a sustained elevation in CBF.
To confirm the relationship of the initial[Ca2+]i increase to the CBF response, we bypassed the ATP-activated signalling pathway by flash photolysis of caged Ca2+. In response to an UV flash, two patterns of CBF change were observed (Fig. 10B and C). These consisted either of a transient (Fig. 10B) or sustained increase in CBF (Fig. 10C). The underlying changes in[Ca2+]i of these two groups consisted of either a brief transient increase (normalized f/f0 of 1.35 ± 0.06, n = 5) with a mean half-life time of 14.8 ± 1.7 s (n = 5) or a prolonged transient increase (normalized f/f0 of 1.67 ± 0.13, n = 5) with a longer half-life time of 28.0 ± 3.6 s (n = 5, P < 0.05).
Discussion
Our goal is to understand the mechanisms that control ciliary beat frequency, which in turn determine the rate of mucus transport (Sleigh et al. 1988; Wanner et al. 1996). At ≈30 °C, airway cilia have a basal CBF that can reach ≈20 Hz and the ability to increase their CBF to rates of up to ≈35 Hz in response to ATP. Therefore, the study of these cilia requires an accurate quantification of the ciliary activity and this has been achieved with our high-speed digital image-recording technique. While our previous analog system used specialized equipment (Lansley & Sanderson, 1999; Sanderson, 2000), the current approach uses commercially available high-speed digital cameras, computer equipment and software. High-resolution images at 240 f.p.s., a sampling rate that is well in excess of the Nyquist minimum (twice the signal frequency, e.g. 70 Hz) are now easily recorded. The major problem of data storage (at 240 f.p.s., the data rate is ≈30 MB s−1; 240 images of 648 × 200 s−1) is solved by recording images to an array of SCSI disks with a high data transfer rate. The high-speed imaging technique is combined with fast (30 f.p.s.) imaging to simultaneously acquire fluorescence images to measure[Ca2+]i. This ease of recording and replaying high-speed images may also be useful in analysing different phases and forms of ciliary beat patterns in relation to mucus transport (Sanderson & Dirksen, 1985) and perhaps in the diagnosis of cilia dysfunction-related diseases (Chilvers & O'Callaghan, 2000).
Although recording techniques may have a high time resolution, the final temporal resolution of the technique is dependent on the method of data analysis. CBF is defined in Hertz and this implies the number of beat cycles per second. However, counting beat cycles per second cannot quantify fast changes (< 1 s) in CBF. Similarly, the temporal resolution of CBF measurements made by frequency-spectrum analysis with FFTs (Morales et al. 2000; Morse et al. 2001) using data segments of 1 s (Korngreen & Priel, 1994) or larger (Wyatt et al. 1998) remains in the seconds domain, although an increase in temporal resolution to ≈100 ms (Salathe & Bookman, 1999) has been approached with an FFT of a ‘sliding’ Hanning window. As a result, we have favoured a beat-by-beat analysis of CBF because this can detect changes in CBF from one beat cycle to the next. However, signal instability is a major problem and this may make the beat-by-beat analysis of long-term recordings difficult (Salathe & Bookman, 1999). We have resolved this problem firstly, by optimizing the position of ROI to produce a repetitive low-noise signal and secondly, by custom-modifying analysis software to track any drift in the grey-scale data (Fig.1B-D).
Consistent with other studies, we find that ATP increases CBF and[Ca2+]i in airway epithelial cells, but unlike other studies, we have frequently observed simultaneous oscillations in both the CBF and[Ca2+]i in response to ATP (Figs 2-4). There are several reasons why other groups may not have frequently observed oscillations in CBF. We believe technical improvements in recording speed, duration and analysis are all important factors. In addition, variation in cell species, agonist receptors and cell age may affect the response to ATP. We found here and in a previous study (Evans & Sanderson, 1999b) that individual cells show a varied response to similar ATP and UTP concentrations. Similarly we, and others (Woodruff et al. 1999), have found that Ca2+ oscillations were primarily induced in cultures of 7-days-old or older. Younger or freshly isolated cells tended not to display oscillations although Salathe & Bookman (1995) observed oscillations in 1 to 3-day-old sheep cells. As a result, it is possible that some cellular changes arising during culture are required for oscillatory behaviour. However, it is not clear if the responses of young cultures, that may be recovering from trauma, are more representative of in vivo responses than older, more stable cultures. Future work is required to investigate this point.
We have also found that exposure to low concentrations of the Ca2+ chelator, BAPTA AM (as well as fura-2 AM, data not shown) abolished Ca2+ oscillations but not the overall[Ca2+]i increase induced by ATP (Fig. 9B). These results raise the possibility that Ca2+ indicator dyes used to study the effects of ATP (i.e. fura-2) can substantially dampen the Ca2+ responses of cells. To avoid this potential artifact, we currently use fura-2 AM at 1 µm. Many previous studies used 5 µm fura-2 AM.
Another reason why oscillations in[Ca2+]i and CBF oscillations may not be commonly observed is that they occur over a narrow range of [ATP] (1 to 16 µm). While this range matches the physiological [ATP]o reported for human nasal airway surface liquid (≈470 nm; Donaldson et al. 2000) it may have resulted in an oversight in studies using ATP concentrations ranging from 0.1 to 100 µm with a × 10 increment. The narrow range of oscillatory response does help to explain why the responses of cells near the extremes vary significantly with the individual cell.
At higher concentrations (16–100 µm), we also find that ATP induces a single sustained increase in CBF and, if these responses are also considered, a saturating concentration- response curve is observed. The fact that we have observed oscillations in CBF in the central region of this response is probably attributable to our recording technique. In other studies, where a sigmoidal concentration-response was reported (Morse et al. 2001), CBF was sampled for 10 s every minute and analysed with an FFT. However, in response to 4µm ATP, we found that the CBF ranged from ≈20 to 28 Hz approximately every 11 s (Fig. 4 and Fig. 5). It is not clear what frequency would be calculated from such an oscillating waveform but it might be expected to be the average CBF. In response to higher ATP concentrations the range in CBF is similar but the frequency of the oscillations in the CBF increases and this would be expected to result in the measurement, by FFT, of a higher mean CBF. Thus, while increasing ATP concentrations can result in mean increases in CBF, we suggest the underlying mechanism achieving this result is oscillations in CBF.
While the ATP and its metabolic products appear to be important in the airways and have been considered for the treatment of airway diseases, the mechanisms of ATP release from epithelial cells is not fully understood (Lazarowski et al. 2000; Donaldson et al. 2000, 2002). Ca2+ oscillations, one ATP-induced response, have been found in other mammalian airway epithelial cells (Maizieres et al. 1998; Kanoh et al. 1999; Woodruff et al. 1999; Evans & Sanderson, 1999b) and in many other non-ciliated and non-excitable cells suggesting that they may serve as a fundamental signal transduction mechanism (Fewtrell, 1993). However, the relevance of Ca2+ oscillations to mucociliary clearance is not known. One common hypothesis applicable to all cells is that a sustained elevation in[Ca2+]i, but not a series of[Ca2+]i oscillations, might be toxic to the cells (Fewtrell, 1993). Another possibility is that[Ca2+]i oscillations appear to induce higher CBFs than single transients. This finding is consistent with our previous report (Evans & Sanderson, 1999a) and because relatively low ATP concentrations induce a similar increase in CBF, only relatively weak extracellular stimulation is required. It is not clear if a continuous or varying ciliary tip velocity of groups of cilia has any advantage for mucus transport but[Ca2+]i oscillations contribute to both the initiation and the maintenance of a sustained CBF elevation; a response that is likely to enhance mucus transport.
Since extracellular ATP can be inactivated by its hydrolysis by ectonucleotidases (Picher & Boucher, 2001), ATP-induced increases in[Ca2+]i and CBF may be mediated by ATP metabolites, ADP, AMP or adenosine. For example, the prolonged increases in the CBF of human nasal cilia in response to ATP, observed by Morse et al. (2001), were believed to be mediated via adenosine receptors (A2B). However, we found that ATP-γ-S induced a response that was almost identical to that induced by ATP (Fig. 6). This, together with the fact that the frequency of CBF oscillation could be maintained for as long as 8 min (Fig. 2), indicates that ATP hydrolysis was not required for the stimulation of the prolonged oscillations in CBF or[Ca2+]i. To explore the possibility that ATP metabolites may still influence the characteristics of the responses, we investigated the direct action of ADP, AMP and adenosine on the[Ca2+]i and CBF. While all three metabolites produced some increase in CBF, this was not oscillatory in nature, nor did it require an increase in[Ca2+]i (Fig. 7). As these agonists acted in a Ca2+-independent manner, this provided us with a way in which to evaluate the contribution of ATP hydrolysis to the ATP-induced responses. By buffering the[Ca2+]i with high concentrations of BAPTA AM, only the Ca2+-independent changes in CBF would be observed when ATP was added. Although, under these conditions, we observed a very small increase in CBF, this small increase was also observed in response to ATP-γ-S and therefore was not specifically related to ATP hydrolysis (Fig. 8). This led us to conclude that the amount of ATP hydrolysis that was occurring during the experiments was insignificant. While Picher & Boucher (2001) have found that the concentrations of [ATP]o can be rapidly reduced, the rate of ATP degradation will be a function of the amount of nucleotidase (tissue mass) in relation to the moles of ATP. In our system we have relatively low numbers of ciliated cells and a bath volume of 300 µl, again conditions that suggest the rate of ATP hydrolysis would be low. In summary, we concluded that the ATP-induced changes in CBF observed in this study were Ca2+ dependent and did not involve ATP metabolites. However, at higher concentrations of ATP, the concentrations of the resulting metabolites will also be higher and, under these conditions, a stimulation of CBF may occur (Morse et al. 2001).
Due to the close coupling of the CBF oscillations with the Ca2+ oscillations (Fig. 4) and the observation that the frequency of the oscillations in CBF was dependent on the ATP concentration (Fig. 5C), it follows that the frequency of[Ca2+]i oscillation was also dependent on the ATP concentration. The close coupling between CBF and[Ca2+]i suggests a direct action of Ca2+ on the ciliary axoneme (Lansley & Sanderson, 1999). Transient changes in CBF in ovine airway epithelial cells also appear to be directly dependent on Ca2+ because calmodulin or phosphatase inhibitors did not influence acetylcholine-induced increases in CBF (Salathe & Bookman, 1999).
A notable feature of the ATP-induced oscillations in CBF is the fact that the minimum frequency of the oscillations in CBF remains elevated even when the[Ca2+]i oscillations occur from the basal level (Fig. 4). We explored the hypothesis that the minimum CBF could be maintained by the frequency of the Ca2+ oscillations. The decline in the minimum CBF following the removal of ATP is consistent with this idea but in this experiment the[Ca2+]i had fallen to the basal level leaving the possibility that an elevation in[Ca2+]i may only be required to maintain the minimum CBF (Fig. 9). The ability of low concentrations of BAPTA AM to abolish the Ca2+ and CBF oscillations without substantially affecting the minimum CBF (Fig. 9), suggests that an extended period of increased[Ca2+]i+ is required for a sustained increase in CBF.
This idea is supported by the observations that thapsigargin induced a sustained increase in CBF (Fig. 10) whereas low concentrations of ATP (≤ 1 µm) induced only a transient increase in CBF (Fig. 4). While the magnitude of the changes in[Ca2+]i induced by both thapsigargin and low concentrations of ATP were similar, the duration of the change in[Ca2+]i was much longer with thapsigargin. The finding that a prolonged low elevation in[Ca2+]i can initiate prolonged increases in CBF has been observed by others in response to ionophores and ATP (Sanderson et al. 1990; Di Benedetto et al. 1991a; Korngreen & Priel, 1994, 1996; Lieb et al. 2002). The suggestion that a brief transient increase in Ca2+ is not sufficient to establish an elevated minimum CBF is also supported by experiments with the flash photolysis of caged Ca2+. A single flash was found to either result in a transient or prolonged (Fig. 10) increase in CBF and this was matched by a transient or prolonged increase in[Ca2+]i. The difference in the response of the cell was probably due to different degrees of loading or exposure. The amplitude of the initial[Ca2+]i change may also have a role in establishing the minimum CBF. For example, high concentrations of ATP induced large transients in[Ca2+]i and sustained increases in CBF. Similarly, larger increases in[Ca2+]i were associated with sustained increase in CBF in photolysis experiments. From these studies, we conclude that a sustained elevation in CBF can be initiated by an increase in[Ca2+]i, if this increase is of sufficient duration. The[Ca2+]i must either be elevated for a minimal amount of time or be integrated from the initial Ca2+ transient and the first few Ca2+ oscillations to give an apparent increase in [Ca2+] in order to establish the elevated minimum CBF.
A mechanism by which changes in Ca2+ (oscillations or spikes) may sustain a longer increase in CBF is the modification of the activity of enzymes that regulate phosphorylation or dephosphorylation of axonemal proteins (Porter & Sale, 2000). Phosphorylation of axonemal proteins can alter the sliding velocity of axonemal microtubules, the equivalent to changing beat frequency, in Paramecium (p29 protein) (Hamasaki et al. 1989) and in Chlamydomonas (Porter & Sale, 2000). A phophorylated protein (p26) similar to the p29 protein from Paramecium has been found in sheep ciliated cells (Salathe et al. 1993). The protein kinases that may be involved include cAMP-dependent kinase (PKA) (Di Benedetto et al. 1991b; Lansley et al. 1992; Wyatt et al. 1998), calcium-dependent NO/cGMP-dependent protein kinase (PKG) (Jain et al. 1993; Geary et al. 1995; Wyatt et al. 1998; Uzlaner & Priel, 1999) and protein kinase C (Levin et al. 1997).
In summary, we propose the that transient Ca2+-coupled CBF changes are mediated directly by a Ca2+-dependent mechanism whereas the sustained increases in CBF are mediated indirectly by a Ca2+-dependent mechanism, such as phosphorylation of axonemal proteins. Although the exact targets of direct and indirect action of Ca2+ have not been identified, we suggest that the mechanism that mediates the direct action of Ca2+ is always responsive even if the site for the indirect action of Ca2+ has been phosphorylated.
Acknowledgments
This work was supported by NIH grant HL49288 to M.J.S.
Supplementary material
Two videos can be found at:
http://www.jphysiol.org/cgi/content/full/546/3/733
which contains material entitled Video 1 and Video 2 that shows the Ca2+ oscillations of airway epithelial cells induced by 8 µm ATP (at ×5 real time), and simultaneous CBF and Ca2+ changes of a single cell (arrow) during the initial exposure to 2 µm ATP and during one of the subsequent Ca2+ oscillations, respectively.
References
- Berridge MJ. Inositol trisphosphate and calcium signalling. Nature. 1993;361:315–325. doi: 10.1038/361315a0. [DOI] [PubMed] [Google Scholar]
- Berridge MJ. The AM and FM of calcium signalling. Nature. 1997;386:759–760. doi: 10.1038/386759a0. [DOI] [PubMed] [Google Scholar]
- Boitano S, Dirksen ER, Sanderson MJ. Intercellular propagation of calcium waves mediated by inositol trisphosphate. Science. 1992;258:292–295. doi: 10.1126/science.1411526. [DOI] [PubMed] [Google Scholar]
- Bootman MD, Collins TJ, Peppiatt CM, Prothero LS, Mackenzie L, De Smet P, Travers M, Tovey SC, Seo JT, Berridge MJ, Ciccolini F, Lipp P. Calcium signalling-an overview. Semin Cell Dev Biol. 2001b;12:3–10. doi: 10.1006/scdb.2000.0211. [DOI] [PubMed] [Google Scholar]
- Chilvers MA, O'Callaghan C. Analysis of ciliary beat pattern and beat frequency using digital high speed imaging: comparison with the photomultiplier and photodiode methods. Thorax. 2000;55:314–317. doi: 10.1136/thorax.55.4.314. [DOI] [PMC free article] [PubMed] [Google Scholar]
- Di Benedetto G, Magnus CJ, Gray PT, Mehta A. Calcium regulation of ciliary beat frequency in human respiratory epithelium in vitro. J Physiol. 1991a;439:103–113. doi: 10.1113/jphysiol.1991.sp018659. [DOI] [PMC free article] [PubMed] [Google Scholar]
- Di Benedetto G, Manara-Shediac FS, Mehta A. Effect of cyclic AMP on ciliary activity of human respiratory epithelium. Eur Respir J. 1991b;4:789–795. [PubMed] [Google Scholar]
- Dirksen ER, Felix JA, Sanderson MJ. Preparation of explant and organ cultures and single cells from airway epithelium. Methods Cell Biol. 1995;47:65–74. doi: 10.1016/s0091-679x(08)60792-x. [DOI] [PubMed] [Google Scholar]
- Donaldson SH, Lazarowski ER, Picher M, Knowles MR, Stutts MJ, Boucher RC. Basal nucleotide levels, release, and metabolism in normal and cystic fibrosis airways. Mol Med. 2000;6:969–982. [PMC free article] [PubMed] [Google Scholar]
- Donaldson SH, Picher M, Boucher RC. Secreted and cell-associated adenylate kinase and nucleoside diphosphokinase contribute to extracellular nucleotide metabolism on human airway surfaces. Am J Respir Cell Mol Biol. 2002;26:209–215. doi: 10.1165/ajrcmb.26.2.4650. [DOI] [PubMed] [Google Scholar]
- Evans JH, Sanderson MJ. Intracellular calcium oscillations regulate ciliary beat frequency of airway epithelial cells. Cell Calcium. 1999a;26:103–110. doi: 10.1054/ceca.1999.0060. [DOI] [PubMed] [Google Scholar]
- Evans JH, Sanderson MJ. Intracellular calcium oscillations induced by ATP in airway epithelial cells. Am J Physiol. 1999b;277:L30–41. doi: 10.1152/ajplung.1999.277.1.L30. [DOI] [PubMed] [Google Scholar]
- Ferguson DR, Kennedy I, Burton TJ. ATP is released from rabbit urinary bladder epithelial cells by hydrostatic pressure changes - a possible sensory mechanism? J Physiol. 1997;505:503–511. doi: 10.1111/j.1469-7793.1997.503bb.x. [DOI] [PMC free article] [PubMed] [Google Scholar]
- Geary CA, Davis CW, Paradiso AM, Boucher RC. Role of CNP in human airways: cGMP-mediated stimulation of ciliary beat frequency. Am J Physiol. 1995;268:L1021–1028. doi: 10.1152/ajplung.1995.268.6.L1021. [DOI] [PubMed] [Google Scholar]
- Hamasaki T, Murtaugh TJ, Satir BH, Satir P. In vitro phosphorylation of Paramecium axonemes and permeabilized cells. Cell Motil Cytoskeleton. 1989;12:1–11. doi: 10.1002/cm.970120102. [DOI] [PubMed] [Google Scholar]
- Hazama A, Shimizu T, Ando-Akatsuka Y, Hayashi S, Tanaka S, Maeno E, Okada Y. Swelling-induced, CFTR-independent ATP release from a human epithelial cell line: lack of correlation with volume-sensitive Cl− channels. J Gen Physiol. 1999;114:525–533. doi: 10.1085/jgp.114.4.525. [DOI] [PMC free article] [PubMed] [Google Scholar]
- Homolya L, Steinberg TH, Boucher RC. Cell to cell communication in response to mechanical stress via bilateral release of ATP and UTP in polarized epithelia. J Cell Biol. 2000;150:1349–1360. doi: 10.1083/jcb.150.6.1349. [DOI] [PMC free article] [PubMed] [Google Scholar]
- Jain B, Rubinstein I, Robbins RA, Leise KL, Sisson JH. Modulation of airway epithelial cell ciliary beat frequency by nitric oxide. Biochem Biophys Res Commun. 1993;191:83–88. doi: 10.1006/bbrc.1993.1187. [DOI] [PubMed] [Google Scholar]
- Kanoh S, Kondo M, Tamaoki J, Shirakawa H, Aoshiba K, Miyazaki S, Kobayashi H, Nagata N, Nagai A. Effect of FK506 on ATP-induced intracellular calcium oscillations in cow tracheal epithelium. Am J Physiol. 1999;276:L891–899. doi: 10.1152/ajplung.1999.276.6.L891. [DOI] [PubMed] [Google Scholar]
- Korngreen A, Priel Z. Simultaneous measurement of ciliary beating and intracellular calcium. Biophys J. 1994;67:377–380. doi: 10.1016/S0006-3495(94)80492-8. [DOI] [PMC free article] [PubMed] [Google Scholar]
- Korngreen A, Priel Z. Purinergic stimulation of rabbit ciliated airway epithelia: control by multiple calcium sources. J Physiol. 1996;497:53–66. doi: 10.1113/jphysiol.1996.sp021749. [DOI] [PMC free article] [PubMed] [Google Scholar]
- Lansley AB, Sanderson MJ. Regulation of airway ciliary activity by Ca2+: simultaneous measurement of beat frequency and intracellular Ca2+ Biophys J. 1999;77:629–638. doi: 10.1016/S0006-3495(99)76919-5. [DOI] [PMC free article] [PubMed] [Google Scholar]
- Lansley AB, Sanderson MJ, Dirksen ER. Control of the beat cycle of respiratory tract cilia by Ca2+ and cAMP. Am J Physiol. 1992;263:L232–242. doi: 10.1152/ajplung.1992.263.2.L232. [DOI] [PubMed] [Google Scholar]
- Lazarowski ER, Boucher RC, Harden TK. Constitutive release of ATP and evidence for major contribution of ecto-nucleotide pyrophosphatase and nucleoside diphosphokinase to extracellular nucleotide concentrations. J Biol Chem. 2000;275:31061–31068. doi: 10.1074/jbc.M003255200. [DOI] [PubMed] [Google Scholar]
- Levin R, Braiman A, Priel Z. Protein kinase C induced calcium influx and sustained enhancement of ciliary beating by extracellular ATP. Cell Calcium. 1997;21:103–113. doi: 10.1016/s0143-4160(97)90034-8. [DOI] [PubMed] [Google Scholar]
- Leybaert L, Sanderson MJ. Intercellular calcium signalling and flash photolysis of caged compounds. A sensitive method to evaluate gap junctional coupling. Methods Mol Biol. 2001;154:407–340. doi: 10.1385/1-59259-043-8:407. [DOI] [PubMed] [Google Scholar]
- Leybaert L, Sneyd J, Sanderson MJ. A simple method for high temporal resolution calcium imaging with dual excitation dyes. Biophys J. 1998;75:2025–2029. doi: 10.1016/S0006-3495(98)77644-1. [DOI] [PMC free article] [PubMed] [Google Scholar]
- Lieb T, Frei CW, Frohock JI, Bookman RJ, Salathe M. Prolonged increase in ciliary beat frequency after short-term purinergic stimulation in human airway epithelial cells. J Physiol. 2002;538:633–646. doi: 10.1113/jphysiol.2001.013222. [DOI] [PMC free article] [PubMed] [Google Scholar]
- Maizieres M, Kaplan H, Millot JM, Bonnet N, Manfait M, Puchelle E, Jacquot J. Neutrophil elastase promotes rapid exocytosis in human airway gland cells by producing cytosolic Ca2+ oscillations. Am J Respir Cell Mol Biol. 1998;18:32–42. doi: 10.1165/ajrcmb.18.1.2841. [DOI] [PubMed] [Google Scholar]
- Mitchell CH, Carre DA, McGlinn AM, Stone RA, Civan MM. A release mechanism for stored ATP in ocular ciliary epithelial cells. Proc Natl Acad Sci U S A. 1998;95:7174–7178. doi: 10.1073/pnas.95.12.7174. [DOI] [PMC free article] [PubMed] [Google Scholar]
- Morales B, Barrera N, Uribe P, Mora C, Villalon M. Functional cross talk after activation of P2 and P1 receptors in oviductal ciliated cells. Am J Physiol Cell Physiol. 2000;279:C658–669. doi: 10.1152/ajpcell.2000.279.3.C658. [DOI] [PubMed] [Google Scholar]
- Morse DM, Smullen JL, Davis CW. Differential effects of UTP, ATP, and adenosine on ciliary activity of human nasal epithelial cells. Am J Physiol Cell Physiol. 2001;280:C1485–1497. doi: 10.1152/ajpcell.2001.280.6.C1485. [DOI] [PubMed] [Google Scholar]
- Ostrom RS, Gregorian C, Insel PA. Cellular release of and response to ATP as key determinants of the set-point of signal transduction pathways. J Biol Chem. 2000;275:11735–11739. doi: 10.1074/jbc.275.16.11735. [DOI] [PubMed] [Google Scholar]
- Picher M, Boucher R. Metabolism of extracellular nucleotides in human airways by a multienzyme system. Drug Dev Res. 2001;52:66–75. [Google Scholar]
- Porter ME, Sale WS. The 9 + 2 axoneme anchors multiple inner arm dyneins and a network of kinases and phosphatases that control motility. J Cell Biol. 2000;151:F37–42. doi: 10.1083/jcb.151.5.f37. [DOI] [PMC free article] [PubMed] [Google Scholar]
- Salathe M, Bookman RJ. Coupling of[Ca2+]i and ciliary beating in cultured tracheal epithelial cells. J Cell Sci. 1995;108:431–440. doi: 10.1242/jcs.108.2.431. [DOI] [PubMed] [Google Scholar]
- Salathe M, Bookman RJ. Mode of Ca2+ action on ciliary beat frequency in single ovine airway epithelial cells. J Physiol. 1999;520:851–865. doi: 10.1111/j.1469-7793.1999.00851.x. [DOI] [PMC free article] [PubMed] [Google Scholar]
- Salathe M, Pratt MM, Wanner A. Cyclic AMP-dependent phosphorylation of a 26 kD axonemal protein in ovine cilia isolated from small tissue pieces. Am J Respir Cell Mol Biol. 1993;9:306–314. doi: 10.1165/ajrcmb/9.3.306. [DOI] [PubMed] [Google Scholar]
- Sanderson MJ. High-speed digital microscopy. Methods. 2000;21:325–334. doi: 10.1006/meth.2000.1022. [DOI] [PubMed] [Google Scholar]
- Sanderson MJ, Charles AC, Dirksen ER. Mechanical stimulation and intercellular communication increases intracellular Ca2+ in epithelial cells. Cell Regul. 1990;1:585–596. doi: 10.1091/mbc.1.8.585. [DOI] [PMC free article] [PubMed] [Google Scholar]
- Sanderson MJ, Dirksen ER. A versatile and quantitative computer-assisted photoelectronic technique used for the analysis of ciliary beat cycles. Cell Motil. 1985;5:267–292. doi: 10.1002/cm.970050402. [DOI] [PubMed] [Google Scholar]
- Sleigh MA, Blake JR, Liron N. The propulsion of mucus by cilia. Am Rev Respir Dis. 1988;137:726–741. doi: 10.1164/ajrccm/137.3.726. [DOI] [PubMed] [Google Scholar]
- Tsien R, Pozzan T. Measurement of cytosolic free Ca2+ with quin2. Methods Enzymol. 1989;172:230–262. doi: 10.1016/s0076-6879(89)72017-6. [DOI] [PubMed] [Google Scholar]
- Uto A, Arai H, Ogawa Y. Reassessment of Fura-2 and the ratio method for determination of intracellular Ca2+ concentrations. Cell Calcium. 1991;12:29–37. doi: 10.1016/0143-4160(91)90082-p. [DOI] [PubMed] [Google Scholar]
- Uzlaner N, Priel Z. Interplay between the NO pathway and elevated[Ca2+]i enhances ciliary activity in rabbit trachea. J Physiol. 1999;516:179–190. doi: 10.1111/j.1469-7793.1999.179aa.x. [DOI] [PMC free article] [PubMed] [Google Scholar]
- Wanner A, Salathe M, O'Riordan TG. Mucociliary clearance in the airways. Am J Respir Crit Care Med. 1996;154:1868–1902. doi: 10.1164/ajrccm.154.6.8970383. [DOI] [PubMed] [Google Scholar]
- Watt WC, Lazarowski ER, Boucher RC. Cystic fibrosis transmembrane regulator-independent release of ATP. Its implications for the regulation of P2Y2 receptors in airway epithelia. J Biol Chem. 1998;273:14053–14058. doi: 10.1074/jbc.273.22.14053. [DOI] [PubMed] [Google Scholar]
- Woodruff ML, Chaban VV, Worley CM, Dirksen ER. PKC role in mechanically induced Ca2+ waves and ATP-induced Ca2+ oscillations in airway epithelial cells. Am J Physiol. 1999;276:L669–678. doi: 10.1152/ajplung.1999.276.4.L669. [DOI] [PubMed] [Google Scholar]
- Wyatt TA, Spurzem JR, May K, Sisson JH. Regulation of ciliary beat frequency by both PKA and PKG in bovine airway epithelial cells. Am J Physiol. 1998;275:L827–835. doi: 10.1152/ajplung.1998.275.4.L827. [DOI] [PubMed] [Google Scholar]