

Abstract
Maximum shortening velocity (V0) was determined in single fibres dissected from hind limb skeletal muscles of rabbit and mouse and classified according to their myosin heavy chain (MHC) isoform composition. The values for rabbit and mouse V0 were compared with the values previously obtained in man and rat under identical experimental conditions. Significant differences in V0 were found between fibres containing corresponding myosin isoforms in different species: as a general rule for each isoform V0 decreased with body mass. Myosin isoform distributions of soleus and tibialis anterior were analysed in mouse, rat, rabbit and man: the proportion of slow myosin generally increased with increasing body size. The diversity between V0 of corresponding myosin isoforms and the different myosin isoform composition of corresponding muscles determine the scaling of shortening velocity of whole muscles with body size, which is essential for optimisation of locomotion. The speed of actin translocation (Vf) in in vitro motility assay was determined with myosins extracted from single muscle fibres of all four species: significant differences were found between myosin isoforms in each species and between corresponding myosin isoforms in different species. The values of V0 and Vf determined for each myosin isoform were significantly correlated, strongly supporting the view that the myosin isoform expressed is the major determinant of maximum shortening velocity in muscle fibres.
Adult mammalian skeletal muscles consist of heterogeneous populations of different fibre types generally identified as types 1, 2A, 2X and 2B using myosin heavy chain (MHC) isoform composition as molecular markers. Myosin isoforms give fibres their distinct contractile and energetic properties (Pette & Staron, 1990; Schiaffino & Reggiani, 1996). Among contractile properties, maximum shortening velocity (V0) shows large variations when fibres containing different MHC isoforms are compared. In mammalian skeletal muscles V0 is three to 9 times smaller in fibres containing the slow MHC isoform (type 1) than in fibres that contain any of the three fast MHC isoforms (types 2A, 2X and 2B) (Bottinelli et al. 1994a, 1996; Bottinelli & Reggiani, 2000). Among fast fibres, V0 is lower in 2A than in 2X fibres, and lower in 2X than in 2B fibres (Schiaffino & Reggiani, 1996). The presence of skeletal muscle fibres with greatly different maximum velocities of shortening within the same skeletal muscle is considered to be a major determinant of the skeletal muscle capacity to adjust the shortening velocity to the requirements of movement and locomotion and to generate force and power efficiently during movements at all speeds. During movement and locomotion, muscle fibres generally shorten at a velocity that corresponds to a constant fraction (20–40 %) of V0 (Rome et al. 1990). At such velocity, called optimal velocity (Vopt), power (Rome et al. 1988; Bottinelli et al. 1996) and thermodynamic efficiency (Reggiani et al. 1997; He et al. 2000) are optimised.
Interestingly, variability in V0 has been found not only among skeletal muscle fibres containing different myosin isoforms within the same species (paralogous myosin isoforms), but also among fibres containing corresponding myosin isoforms in different animal species (orthologous myosin isoforms) (Rome et al. 1990; Widrick et al. 1997; Canepari et al. 2000; Hook et al. 2001). Such differences among fibres containing orthologous isoforms are considered essential to preserve the locomotor properties of each species. Fifty years ago, Hill pointed out that, as animals of very variable (> 1000-fold) size move at comparable locomotion speeds (< 4-fold variation), muscles must shorten in vivo with a velocity inversely related to the limb length or to the linear body size, or to the cubic root of the body mass (Hill, 1950). As velocity of shortening in vivo is a constant fraction of V0, Hill's observation implies that V0 varies from species to species in inverse relation with the cubic root of body mass. Two mechanisms might co-operate to make shortening velocity in muscles of small animals higher than in the corresponding muscles of large animals: (1) a higher speed of shortening of both fast and slow fibres, (2) a higher percentage of fast fibres in small mammals than in large ones.
In more recent years the issue has been the object of several studies (Rome et al. 1990; Seow & Ford, 1991; Widrick et al. 1997; Hook et al. 2001). These studies have consistently indicated that in single muscle fibres both shortening velocity and power output (Seow & Ford, 1991) are inversely related to body mass. Even though the relationship can be considered unequivocally settled for slow fibres (Widrick et al. 1997) and slow myosin isoforms (Hook et al. 2001), uncertainty still exists with regard to fast fibres. Fast fibres represent a heterogeneous population of fibres which may contain three distinct myosin isoforms: in previous studies, however, either no attempt has been made to separate the different groups of fast fibres (Seow & Ford, 1991) or only two groups have been identified (Rome et al. 1990).
In this work we aimed to re-examine inter-species variations of the shortening velocity of single muscle fibres, with particular attention to fast fibres. Values for V0 of single rat and human fibres were already available from previous studies from our laboratory (Bottinelli et al. 1994a, 1996). Keeping the same experimental conditions, V0 was determined in rabbit and mouse muscle fibres. The choice of these two species offered the chance to cover a range of body mass of about 2000-fold with four species, each of them approximately 10 times bigger than the other. Additional interest in the mouse is due to its frequent use as an animal model for molecular biology and genetics. The muscles of the rabbit have been often used for biochemical and physiological investigations, although no complete analysis of contractile properties of the four main fibre types is yet available.
When different fibre types are compared and even more so when different animal species are studied, the diversity of a functional parameter such as maximum shortening velocity can be ascribed to a number of factors. For example not only the diversity between myosin isoforms, but also the heterogeneity of other myofibrillar proteins (Greaser et al. 1988) may be implicated. Furthermore, structural diversity in the sarcomere architecture, for example sarcomere length and thin filament length (Kruger et al. 1991) may also play a role. To account for this possibility and to unambiguously attribute the diversity in shortening velocity to orthologues and paralogues of myosin, respectively, the speed of actin filament translocation was also determined in a reconstituted contractile system in vitro (in vitro motility assay, IVMA). This is because actin sliding velocity in IVMA can be referred to myosin without doubt, as it is determined in the absence of sarcomere structure and other myofibrillar proteins.
Finally, myosin isoform composition of corresponding muscles of the four selected species was also analysed to clarify whether an increase in the percentage of fast fibres could also contribute in determining the higher shortening velocity of muscles of smaller species.
The results obtained confirmed the inverse relation between shortening velocity and body mass for slow myosin and also extended it to fast myosin isoforms. The results also demonstrated that the myosin isoforms expressed are the major determinants of the maximum shortening velocity both when comparing different fibres in each species and when comparing corresponding fibres in different species. A preliminary report of these results has been presented in abstract form (Pellegrino et al. 1999).
Methods
Animals and muscle sampling
Three adult male New Zealand rabbits (body weight 3.0–3.3 kg), 12 CD1 male mice (body weight 37–42 g) and six adult male Wistar rats (body weight 340–370 g) were used in this study. Mice were killed by cervical dislocation and the tibialis anterior, gastrocnemius and soleus muscles were dissected. Rabbits were killed by stunning and the soleus, tibialis anterior, extensor digitorum longus (EDL), gastrocnemius, vastus lateralis and psoas muscles were sampled. Rats were killed by ether anaesthesia and soleus, plantaris and tibialis anterior muscles were dissected out. Human muscle samples were collected during orthopaedic surgery from the vastus lateralis, tibialis anterior and soleus muscle of adult (25–45 years) male subjects. All subjects gave informed consent to participate in the study, which was approved by the ethical committee of the University of Pavia, and was carried out in accordance with the declaration of Helsinki. The experimental protocol for the study on animals was approved by the local Animal Ethics Committee; all experimental procedures conformed with the UK Animals (Scientific Procedures) Act 1986. All subjects did not have previous history of muscular or neuromuscular disease. Analysis of actin sliding velocity of human myosin was only performed on fibres dissected from the vastus lateralis muscles. Human biopsy samples as well as samples of rat, rabbit and mouse muscles were immediately immersed in ice cold skinning solution (see below for composition).
Single fibre preparation
Segments of single fibres were manually isolated from muscle samples under a stereomicroscope while immersed in skinning solution. The fibres were then bathed for 1 h in a solution containing 1 % Triton X-100 and afterwards returned to the previous skinning solution. Light aluminium clips were attached to both ends of fibre segments (1.5–2 mm long), which were then transferred to the experimental set-up for mechanical measurements.
Solutions
Skinning, relaxing, pre-activating and activating solutions were prepared as previously described (Bottinelli et al. 1996). Skinning solution had the following composition (mm): potassium propionate 150, magnesium acetate 5, sodium ATP 5, EGTA 5 and KH2PO4 5. Relaxing solution was composed of (mm): KCl 100, imidazole 20, MgCl2 5, sodium ATP 5 and EGTA 5. Preactivating solution had a similar composition except that EGTA concentration was reduced to 0.5 mm, and 25 mm creatine phosphate and 300 U ml−1 creatine phosphokinase were added. Activating solution was similar to relaxing solution with the addition of 5 mm CaCl2, 25 mm creatine phosphate and 300 U ml−1 creatine phosphokinase. The pH of all solutions was adjusted to 7.0 at the temperature at which solutions were used (12 °C).
Experimental set-up
The experimental set-up has been previously described in detail (Bottinelli et al. 1991, 1996). Briefly, three chambers (70 µl) milled in an aluminium plate were filled with relaxing, pre-activating or activating solution; the aluminium plate could be moved to immerse the fibre in any of the three chambers. The fibres were attached to a force transducer at one end and to an electromagnetic puller at the other end. The electromagnetic puller was equipped with an inductance position transducer and driven by a feedback circuit. A stereomicroscope was fitted above the apparatus to view the fibre at 20–60 × magnification during the mounting procedure and during the experiment. The set-up was placed on the stage of an inverted microscope (Axiovert 10, Zeiss, Germany). As the floors of the muscle chambers were made by coverslips, the fibres could be also viewed at 320 × magnification through the eyepieces of the inverted microscope. A video camera fitted to the camera tube of the inverted microscope and connected through an A/D converter to a computer enabled display of the fibres on a monitor at 1000 × magnification, and storage of digitised images during experiments. The signals from the force and displacement transducers were displayed on the screen of a storage oscilloscope (mod 5113, Tektronix, Beaverton, Oregon, USA) and on a chart recorder (WR3701, Graphtec, Japan). The signals after A/D conversion (interface CED 1401 plus, Cambridge, UK) were fed into a personal computer and stored on the hard disk. For data storage, recall and analysis, the software Spike 2 (CED, Cambridge, UK) was used.
Experimental procedure
In all mechanical experiments temperature was set at 12 °C. Sarcomere length (SL), was determined by counting striations in segments of known length at 320 × magnification. Fibre diameters were measured at three different locations along the length of the fibre at 320 × magnification and fibre length was measured using a stereomicroscope fitted over the apparatus at 40 × magnification. Cross-sectional area (CSA) of the specimen was determined from the mean of the three diameters measured at 320 × magnification, assuming a circular shape and without correction for swelling. SL was adjusted to 2.5 µm by varying fibre length at rest. To determine isometric tension (P0) and maximum shortening velocity (V0), fibres were first transferred to pre-activating solution for at least 2 min and then maximally activated (pCa 4.45) for about 40–60 s. For V0 determination the slack-test procedure was employed (Edman, 1979; Bottinelli et al. 1996). Briefly, five instantaneous length changes (slacks) were performed with amplitudes ranging from 5 to 14 % of the resting length. Unloaded shortening velocity (V0) was obtained from the slope of the linear regression between the time required to take up the slack and the amount of shortening imposed and was expressed in fibre length per second or, for comparative purposes, in micrometres per second per half-sarcomere (µm s−1 half-sarcomere−1). At the end of the mechanical experiment the fibre was removed from the set-up and placed in sample solution (Laemmli, 1970) for subsequent electrophoretic analysis of MHC isoform composition.
Fibre typing and myosin isoform identification
The MHC isoform composition of each fibre was determined on 8 % polyacrylamide slab gels after denaturation in SDS (SDS-PAGE) with a procedure derived from that described by Talmadge & Roy (1993). The fibre segment employed in V0 determination or a small fragment of the fibre which was subjected to the myosin extraction procedure (see below) was placed in a small test tube filled with 20 µl of sample buffer (Laemmli, 1970). A fraction of the solution (typically 2 µl) was loaded onto the gels (dimensions: 18 cm wide, 16 cm high and 0.75 mm thick). Electrophoresis was run for 24 h at 275 V. Gels were silver stained for identification of protein bands. Four bands were separated in the region of 200 kDa, corresponding to MHC-1, MHC-2A, MHC-2X and MHC-2B. The identification of the bands was based on Western blots using anti-MHC monoclonal antibodies (F8 specific for slow MHC, SC71 specific for MHC-2A, G6 specific for MHC-2B) kindly provided by Professor S. Schiaffino (Padova). The same electrophoresis protocol was used to determine the MHC isoform composition of whole muscle samples. Examples of MHC electrophoretical separation in single fibres and in muscle samples are shown in Figure 1.
Figure 1. MHC isoform distribution in soleus (A), tibialis anterior (B) and single muscle fibres (C) of mouse, rat, rabbit and man.
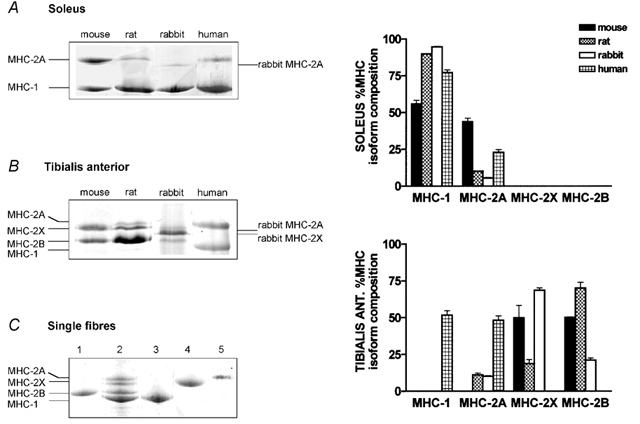
A, different proportions of two MHC isoforms (MHC-2A and MHC-1 or slow) are expressed in mouse, rat, rabbit and human soleus. B, two MHC isoforms (MHC-2X and MHC-2B) are detectable in mouse tibialis anterior, three isoforms (MHC-2A, MHC-2X, MHC-2B) are expressed in rat and in rabbit tibialis anterior and only two (MHC-2A and MHC-1 or slow) in human tibialis anterior. Note the different migration of fast MHC isoforms in rabbit. C, examples of MHC composition of single fibres: lane 1, rat pure fast 2B fibre; lane 3, rabbit pure slow fibre; lane 4, mouse pure fast 2X fibre; lane 5, mouse pure fast 2A fibre. Lane 2 shows a mixed rat muscle sample used as a reference. The relative percentage (mean ±s.e.m.) of MHC isoforms of soleus and tibialis anterior is shown in the histograms on the right-hand side of the figure.
Myosin extraction and in vitro motility assay
Myosin was extracted and purified from single muscle fibres of mouse, rat, rabbit and human muscles according to the procedure previously described in detail (Canepari et al.1999). The assay protocol was derived with minor modifications from that described by Anson (1992). The myosin sample, suspended in myosin-activity buffer (MAB (mm): Mops 25, KCl 600, MgCl2 2, EGTA 1, DTT 4, pH 7.2), was put as a drop on a coverslip coated with nitrocellulose. The coverslip was then used to construct a flow cell with a 30 µl channel. After 5 min, the flow cell was washed with 50 µl of 0.5 mg ml−1. bovine serum albumin (BSA) in a buffer containing (mm): Mops 25, KCl 25, MgCl2 4, EGTA 1, DTT 4, pH 7.2 (AB buffer). After 60 s, 50 µl of rhodamine- phalloidin labelled F-actin (20 nm) with 0.5 mg ml−1 BSA in AB buffer were infused and allowed to bind in rigor to the myosin for 120 s, after which 50 µl of 0.5 mg ml−1 BSA in AB buffer were infused to wash out unbound actin. Finally, 50 µl of anti-fade or AF buffer were prepared by adding the following to AB buffer: 0.5 mg ml−1 BSA, 200 µg ml−1 glucose oxidase, 36 g ml−1 catalase and 5 µg ml−1 glucose. This solution acts as an oxygen-scavenging system that reduces the rate of fluorescence fading due to photodegradation. Movement of the actin filaments was initiated by the infusion of 50 µl of AF buffer containing 2 mm ATP into the flow cell.
The flow cell was mounted on the stage of a fluorescence microscope (Zeiss Axiolab). A water-glycol ethylene solution from an Endocal Neslab thermostat was circulated through a coil-pipe created in the microscope stage and in a jacket of Perspex surrounding the microscope objective in order to have a constant experimental temperature of 25 °C. Actin filaments were visualised in epi-fluorescence with the Zeiss filter set 487 915–9901 passing 535 to 560 nm for excitation and > 580 nm in fluorescence. A HBO 100 W mercury lamp excited fluorescence. A Zeiss Plan-Neofluar objective oil immersion lens with 1.3 NA and 100 × magnification was used. Images were recorded at a rate of 50 frames s−1 by an intensified CCD camera (Extended ISI, Photonic Science, UK) which was connected with a videotape recorder, TV monitor and computer through a frame grabber interface (PXC200F, Image Nation, USA).
Recorded images were analysed by a software (written by A. Rubini, Pavia, Italy) that allowed us to minimise the background noise, select the rate of acquiring the frames (from 1 frame s−1 for very slow-moving filaments to 25 frames s−1 for very fast-moving filaments) and to choose the duration of data acquisition (from 1 to 100 s). In each frame, actin filaments were identified by calculating the x-y coordinates of their centroids and their length. The path followed by a centroid represented the filament movement. Fields next to centroid locations were scanned and each captured image in sequence was used to generate a series of centroid paths and calculate the velocity of each filament. At the end of the automatic analysis the program showed the path along which each filament moved allowing us to discard or accept the filament for further statistical analysis. Filaments were accepted for velocity analysis if they fulfilled the following criteria: (1) length above 1 µm, (2) good contrast against the background, and (3) constant speed movement along straight or gently curving tracks. For each myosin sample the velocities of 50–100 filaments were measured and their distribution characterised according to parametric statistics. Velocity was expressed in µm s−1.
Analysis of scaling with body size
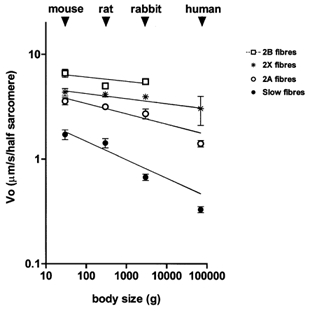
The relation between a functional parameter and body mass was conveniently described using a logarithmic plot. The equation Y = aXb was interpolated to the experimental data. Y is the functional parameter, X is body mass and a and b are variables whose numerical values were determined by minimising a cost function represented by the sum of the squares of the differences between experimental data and equation predictions. The value of b is the exponent of the equation, i.e. the scaling factor or allometric coefficient. If the functional parameter decreases with increasing body size the value of b is negative. The dimensions of a depend on the dimensions of the functional parameter (Y) that are considered. When maximum shortening velocity (V0), peak power (Wmax) of single muscle fibres and actin sliding velocity (Vf) are related to body mass, a dimensions are µm s−1 half-sarcomere−1 g−b (Fig. 3), W l−1 g−b (Fig. 6) and µm s−1 g−b, respectively (Fig. 4).
Figure 3. Relation between maximum shortening velocity (V0) of muscle fibres containing myosin orthologues and average body mass of mouse, rat, rabbit and man.
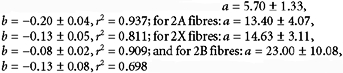 |
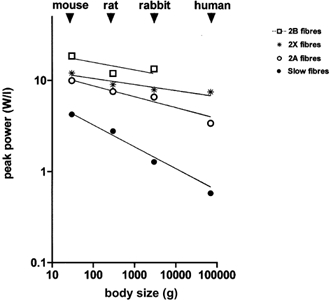
Figure 6. Relation between peak power output and body mass in mouse, rat, rabbit and man.
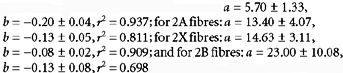 |
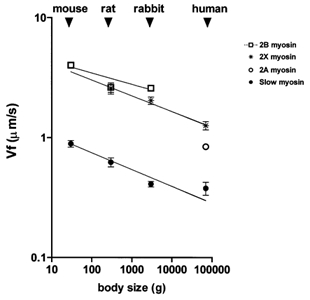
Figure 4. Relation between actin translocation velocity (Vf) by myosin orthologues in in vitro motility assay and average body mass of mouse, rat, rabbit and man.
Sequence comparison
Myosin heavy chain sequences were found at the NCBI (National Center for Biotechnological Information; Bethesda, MD, USA) protein resource with the following GI numbers: human MHC-1 107137, MHC-2A 4808813, MHC-2X 4808815, MHC-2B 4808811; rabbit MHC-1 2144825, MHC-2X 940233; rat MHC-1 56657; mouse MHC-1 16508127, MHC-2A 14250231 and 20881585, MHC-2X 20883346, MHC-2B 9581821 (small fragment of LMM). Sequences were aligned using the BLAST program available at NCBI. Non-conservative differences were identified by placing residues into one of the following six categories: acidic, D, E; basic H, K, R; polar N, C, Q, G, S, T, Y; hydrophobic A, L, I, C, M, F, W, V; proline P. To avoid problems with numbering of residues, the human MHC-1 was used as a reference.
Statistical analysis
All data were expressed as means ± s.e.m. Statistical significance of the differences between means was assessed by analysis of variance followed by the Student-Newman-Keuls test. A probability of less than 5 % (P < 0.05) was considered to be statistically significant.
Results
MHC isoform identification
The electrophoresis protocol described in the Methods allowed the separation of all the major MHC isoforms expressed in adult skeletal muscles from the four species selected for this study (see Fig. 1). For the rabbit, rat and mouse samples, four bands were detectable in the 200 kDa region of the gel corresponding to (from the fastest to the slowest migrating band): MHC-1 (or slow isoform), MHC-2B, MHC-2X and MHC-2A (or fast isoforms). As expected (Smerdu et al. 1994), only three bands (MHC-1, MHC-2A, MHC-2X, in order of migration speed from the fastest to the slowest band) were observed in human muscle samples. MHC-1 migrated in the same position in all four species, and MHC-2B migrated in the same position in the three species in which it was found (mouse, rat, rabbit); however, differences were present in the migration positions of MHC-2X and MHC-2A, as also shown in previous studies (Hamalainen & Pette, 1995). MHC-2A migrated in the same position in mouse, rat and man samples, but migrated faster (lower position in the gel) in rabbit; the band for MHC-2X was located in the highest position above MHC-2A (slowest migration rate) in the human samples, in a lower position (just below MHC-2A) in mouse and rat, and in an even further lower position in rabbit. In Fig. 1 the positions of MHC isoforms in mouse and rat are indicated on the left side of the panels, and the positions of rabbit MHC isoforms, if different, are indicated by arrows on the right side.
The MHC isoform distributions of a typical slow (soleus) and a typical fast (tibialis anterior) muscle in mouse, rat, rabbit and man are shown in Fig. 1 (A and B). In both muscles the relative composition of the MHC isoforms varied among species according to the general rule that, with increasing body mass, the muscles became richer in the slow myosin isoform and the fast myosin isoforms, and MHC-2B, in particular, became less abundant. This is clearly shown by the progressive increase MHC-1 content from mouse, to rat and to rabbit and by the decreasing content of MHC-2A in mouse, rat and rabbit. There was, however, a notable exception to this rule: the MHC-1 content of human soleus was lower than that in the rabbit and rat. In the tibialis anterior muscles, MHC-1 or slow isoform was only expressed in human tibialis. MHC-2A, although accompanied by MHC-2X and MHC-2B, was also present in rat and rabbit tibialis, whereas only MHC-2X and MHC-2B were expressed in mouse tibialis.
Maximum shortening velocity and MHC isoform composition in rabbit and mouse single fibres
Single fibres (n = 120) were dissected from rabbit muscles and characterised with regard to their maximum shortening velocity, isometric tension and MHC isoform composition. Pure fibres (i.e. fibres containing only one MHC isoform, with a resolution of 1 %; Bottinelli et al. 1994b) were classified into four groups on the basis of MHC isoform content: type 1, type 2A, type 2X and type 2B, containing MHC-1, MHC-2A, MHC-2X and MHC-2B, respectively; the mean values (± s.e.m.) of maximum shortening velocity (V0) of the four groups are reported in Table 1. Significant differences were present among all four groups. All except one of the slow fibres came from the soleus, whereas fast fibres were sampled from different muscles. This random sampling was performed to minimise possible factors of variation, such as the myosin light chain (MLC) isoform composition (Sweeney et al. 1988; Bottinelli et al. 1994a) thus making the samples more representative. Comparison of V0 values (measured in µm s−1 half-sarcomere−1) separated for muscle of origin showed that inter-muscle differences were not significant: for type 2A fibres, EDL fibres had a V0 value of 2.291 ± 0.271 and tibialis anterior fibres a V0 of 2.730 ± 0.176; for type 2X fibres, V0 was 3.620 ± 0.179 in EDL fibres, 3.517 ± 0.336 in psoas fibres, 4.103 ± 0.993 in gastrocnemius fibres and 4.161 ± 0.240 in vastus lateralis fibres; for type 2B fibres V0 was 4.931 ± 0.431 in psoas fibres and 5.773 ± 0.334 in gastrocnemius fibres. The lack of significant differences in V0 in relation to the muscle of origin was in accordance with the conclusions of our previous work on human muscle fibres (Harridge et al. 1996).
Table 1.
Maximum shortening velocity (V0) determined with the slack test protocol in rabbit and in mouse single muscle fibres
| Rabbit | Mouse | Rat* | Man† | |
|---|---|---|---|---|
| Slow fibres | 0.671 ± 0.047 (n = 20) | 1.708 ± 0.181 (n = 17) | 1.417 ± 0.144 (n = 12) | 0.330 ± 0.022 (n = 24) |
| Fast 2A fibres | 2.696 ± 0.299 (n = 20) | 3.560 ± 0.280 (n = 22) | 3.145 ± 0.138 (n = 8) | 1.401 ± 0.101 (n = 20) |
| Fast 2X fibres | 3.921 ± 0.141 (n = 46) | 4.340 ± 0.353 (n = 13) | 4.144 ± 0.243 (n = 15) | 3.022 ± 0.935 (n = 4) |
| Fast 2B fibres | 5.476 ± 0.275(n = 17) | 6.587 ± 0.578 (n = 22) | 4.98 1 ± 0.227 (n = 36) | — |
Fibres are grouped according to their MHC isoform composition as determined by SDS-PAGE. V0 values (expressed in μm s−1 half-sarcomere−11) are given as means ±s.e.m., with the number of fibres in parentheses. Values obtained in rat and human muscles are added for comparison. Variance analysis on V0 values shows significant differences between all paralogues in mouse, rat, rabbit and man (except 2A vs. 2X fibres in mouse), and between orthologues for slow fibres (all different from each other except mouse vs. rat), fast 2A fibres (all different from each other except rat vs. rabbit and rat vs. mouse) and fast 2B fibres (only mouse vs. rat). No significant difference was present among fast 2X fibres.
From Bottinelli et al. (1994b), V0 expressed in μm s−1 half-sarcomere−1.
From Bottinelli et al. (1996), V0 expressed in μm s−1 half-sarcomere.−1
Maximum shortening velocity was determined in 90 single fibres dissected from mouse muscles. MHC isoform identification revealed 74 pure fibres, containing a single MHC isoform (see above): these pure fibres were divided into four groups which contained MHC-2B, MHC-2X, MHC-2A or MHC-1. The mean values of maximum shortening velocity are reported in Table 1. Variance analysis showed that all differences were statistically significant except the difference between 2A and 2X fibres.
Maximum shortening velocity in four mammalian species and scaling with body mass
The values of V0 obtained in mouse and rabbit fibres were compared with the values previously determined in rat (Bottinelli et al. 1994b) and human (Bottinelli et al. 1996) fibres. The results of the compilation are shown in Table 1. As can be seen, the corresponding isoforms in different species (orthologous isoforms) produced different values of V0. The V0 values for slow fibres (type 1) were significantly lower in human than in rabbit, which in turn had lower V0 values than rat and mouse fibres. When comparing V0 values of fast fibres, for 2A fibres all differences were statistically significant except those between rat vs. rabbit and rat vs. mouse, and 2X fibres did not show any statistically significant difference. Finally, mouse 2B fibres shortened at a speed higher than rat 2B fibres, however no significant difference was present between rat and rabbit 2B fibres and between mouse and rabbit 2B fibres.
Figure 2 shows the mean values of specific tension (P0/CSA) of the same fibres whose V0 values are reported in Table 1. The values ranged between 40 and 75 mN mm−2 in agreement with our previous measurements at 12 °C without correction for swelling induced by membrane removal (Bottinelli et al. 1994b, 1996). The specific tension varied rather widely among different fibre types within the same species and among corresponding fibre types of different species. However, no consistent relation was observed between P0/CSA of corresponding fibre types in different species and body size in accordance with previous observations on single muscle fibres (Seow & Ford, 1991) and with theoretical considerations (McMahon, 1975).
Figure 2. Comparison between the values of isometric tension (P0/CSA) of single muscle fibres of mouse, rat, rabbit and man.
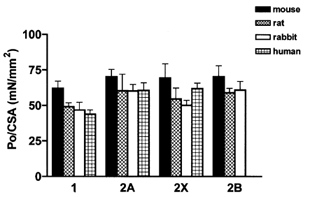
Variance analysis on P0/CSA values does not show significant differences between paralogues in mouse, rat, rabbit and man; significant differences between orthologues (mouse vs. man) are present in slow fibres but not in fast fibres.
In Figure 3 average V0 values of the four fibre types in the four animal species were plotted vs. average body mass in a logarithmic plot and the allometric equation was fitted to the data points. For slow fibres a steep decrease of V0 with body mass was evident and the allometric coefficient for V0 was −0.175. Fast fibres also showed a dependence of V0 on body mass: the allometric coefficients were −0.098 for 2A fibres, −0.048 for 2X fibres and −0.041 for 2B fibres.
In vitro motility assay and scaling with body mass
The speed of actin translocation in the in vitro motility assay (Vf) with pure myosin isoforms prepared from single fibres was measured for various myosin isoforms in the four animal species (mouse, rat, rabbit, man). As seen in Table 2, differences were present not only when myosin isoforms were compared within a species but also when corresponding myosin isoforms were compared in the different species.
Table 2.
Speeds of actin filament translocation (Vf) in in vitro motility assay with myosin extracted from single muscle fibres of mouse, rat, rabbit and man
| Rabbit | Mouse | Rat | Man | |
|---|---|---|---|---|
| Slow myosin | 0.410 ± 0.022 (n = 10) | 0.889 ± 0.056 (n = 4) | 0.624 ± 0.053 (n = 12) | 0.378 ± 0.047 (n = 13) |
| Fast 2A myosin | — | — | — | 0.841 ± 0.034 (n = 9) |
| Fast 2X myosin | 2.037 ± 0.144 (n = 11) | — | 2.580 ± 0.277 (n = 8) | 1.257 ± 0.099(n = 4) |
| Fast 2B myosin | 2.585 ± 0.034 (n = 4) | 4.023 ± 0.191(n = 6) | 2.621 ± 0.242 (n = 8) | — |
Values are means ± s.e.m., with the number of assays in parentheses. Variance analysis shows significant differences between paralogues in mouse (slow vs. 2B), rat (slow vs. 2B and slow vs. 2X), rabbit (slow vs. 2X, slow vs. 2B and 2X vs. 2B) and man (slow vs. 2A, slow vs. 2X and 2A vs. 2X), and between orthologues for slow myosin (all different from each other except rabbit vs. man and rabbit vs. rat), fast 2X myosin (rabbit vs. man and rabbit vs. rat), and fast 2B myosin (mouse vs. rat and mouse vs. rabbit).
In Fig. 4 the values of speed of actin translocation for pure myosin isoforms are plotted vs. the body mass in a logarithmic scale. Vf of slow myosin decreased with increasing body size with an allometric coefficient of −0.140; among fast myosins the allometric coefficient was −0.131 for 2X myosin and −0.094 for 2B myosin. Actually, the Vf of fast 2B myosins scaled with body size in a complex way: scaling occurred between mouse and rat, but not between rat and rabbit, in accordance with the trend observed for V0. Although Vf data were less complete than V0 data, the variations of Vf with body mass appeared qualitatively similar to those of V0. The correlation between V0 and Vf was, therefore, tested and the results are shown in Fig. 5: the two parameters were found to be highly correlated (P < 0.0001); the slope of the correlation (0.529) showed that, for each myosin, V0 was about 2 times higher than Vf under the experimental conditions used in this study.
Figure 5. Relation between V0 and Vf in in vitro motility assay for all myosin orthologues examined in this study.
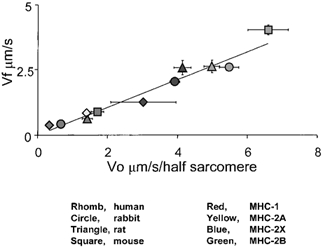
Linear regression analysis indicates a highly significant correlation (P < 0.0001) between V0 and Vf, and the regression line has a slope 0.529 and r2= 0.915.
Discussion
In this study, maximum shortening velocity (V0) and isometric tension (P0) were determined in single muscle fibres from adult mice and rabbits. By using an appropriate electrophoretic method (Talmadge & Roy, 1993) we were able to overcome the difficulties encountered in previous studies in the separation of MHC isoforms of rabbit muscle fibres (Greaser et al. 1988; Sweeney et al. 1988) and thereby unambiguously classify muscle fibres on the basis of their MHC isoform composition. The results obtained showed the expected differences in V0 among fibres containing distinct MHC isoforms: both in mouse and rabbit fibres V0 increased from type 1 to type 2A to type 2X and type 2B. The most interesting aspect of the new data on mouse and rabbit, however, was the combination of the new data with previous data on rat and human fibres obtained in the same laboratory and under the same experimental conditions. This combination resulted in the most precise functional comparison to date between corresponding MHC isoforms (orthologous isoforms) in four mammalian species, in addition to the comparison between the paralogous myosins, i.e. the myosin isoforms in the same species. Previously, similar comparisons had been performed but only for slow fibres (Widrick et al. 1997), or for slow and fast fibres without reliable identification of various fast fibre types (Rome et al. 1990; Seow & Ford, 1991).
The results from our study support the view that the functional and structural diversity among orthologous myosin isoforms is the basis of the scaling of shortening velocity with body mass, a phenomenon first hypothesised by A. V. Hill (1950) and analysed in more recent studies (Rome et al. 1990; Seow & Ford, 1991). The present results allowed us to describe the relation between V0 and body mass of all adult fibre types present in the skeletal muscles of the four species with a body mass range of about 2000-fold. In accordance with previous findings (Rome et al. 1990; Seow & Ford, 1991; Widrick et al. 1997), V0 of fibres containing MHC-1 decreased regularly with increasing body mass and the allometric coefficient (-0.175) was in good agreement with the values obtained in previous studies (-0.179, Rome et al. 1990; −0.125, Seow & Ford, 1991; and −0.18, Widrick et al. 1997). A significant scaling of V0 with body size was also observed for the three types of fast fibres (2A, 2X and 2B fibres). Scaling was more evident for slow fibres than for fast fibres. Type 1 fibres from humans had V0 values about 2, 4 and 5 times lower than type 1 fibres from rabbit, rat and mouse respectively. On the other hand, V0 of type 2A and 2X fibres from humans was just 50 and 30 % slower, respectively, than V0 of type 2A and 2X fibres from mice. The lower impact of body size on the V0 of fast fibres has an important implication: the ratio between V0 values of the fastest and the slowest fibres in human muscles (2X and slow fibres, respectively) is larger (9.15) than the ratio between V0 values of the fastest and the slowest fibres (2B and slow fibres) in the rat (3.5) and in the mouse (3.85) and similar to that (8.1) calculated in the rabbit. Thus, the lack of 2B fibres in human muscles does not reduce the range of V0 variation among fibres.
Although a significant scaling occurs for all three fast fibre types, the paired comparisons do not show any significant difference between V0 values of rat and rabbit fast fibres in spite of a 10-fold difference in body mass. This lack of difference was overlooked in previous studies that compared rat and rabbit fast fibres (Rome et al. 1990; Seow & Ford, 1991), probably because not all MHC isoforms were precisely identified. In the study by Rome et al. (1990) the combination of immunohistochemistry and electrophoresis may have misclassified 2B fibres, whereas in the study by Seow & Ford (1991) fibres were simply classified as either slow or fast depending on the muscle of origin and no separation of the three fast fibre types (types 2A, 2X and 2B) was performed. The results obtained in this study underline the need for a precise identification of the MHC isoforms and suggest that for fast fibres the scaling exists as a general comparison among animal species, but exceptions might possibly occur in relation to peculiar features of locomotion, as discussed below.
Scaling of actin sliding velocity in IVMA with body mass and the myosin structure-function relation
Previous work (see reviews Schiaffino & Reggiani, 1996; Bottinelli & Reggiani, 2000) has consistently shown that myosin isoforms are the major determinants of V0 of single muscle fibres, but also that V0 might be affected by other myofibrillar proteins and by the geometry of the sarcomere. It was therefore of interest to test whether the V0 values of corresponding fibres types in different species might depend on factors other than myosin isoform composition. The IVMA performed on pure myosin isoforms extracted from single muscle fibres made it possible to measure Vf, the velocity of sliding of fluorescent actin filaments, which could be unambiguously related to myosin isoforms as no sarcomere structure and no other myofibrillar proteins were present. The results from this study showed that: (1) significant differences in Vf existed between paralogous as well as between orthologous myosin isoforms, (2) the Vf of slow myosins scaled with body mass with an allometric coefficient (-0.140) similar to that obtained for the V0 of slow fibres (-0.175) in this study and that determined for Vf in a recent study (-0.128; Hook et al. 2001)); the Vf of fast 2X and fast 2B myosin isoforms also scaled with body mass with allometric coefficients of −0.131 and −0.094, respectively and (3) a highly significant correlation between Vf and V0 existed over a range of velocities of about 20-fold. The latter observation does not imply that V0 and Vf had the same values. On the contrary, for each myosin isoform Vf was much lower (approximately 2 times) than V0. Such a difference has been discussed in detail by Thedinga et al. (1999) and is probably due to the different conditions in which V0 and Vf are determined. In in vitro motility assays, sarcomere organisation is lost and myosin is randomly distributed. Moreover, in most studies, V0 is determined at lower temperature, higher ionic strength and lower free magnesium than Vf. The effect of temperature, which would make Vf higher than V0, is probably cancelled out by the lack of an ordered sarcomere structure (Thedinga et al. 1999). On the other hand, ionic strength might play a role in lowering Vf in relation to V0. In fact, as discussed by Thedinga et al. (1999), whereas V0 is rather independent of ionic strength (Gulati & Podolsky, 1981; Brenner, 1986), Vf is significantly decreased at lower ionic strength (Homsher et al. 1992). There are no reports on the effect of variations of free magnesium concentration on V0 and Vf. Whatever the origin of the difference in absolute values of V0 and Vf, the very good correlation between the two velocities supports the view that the observed differences in V0 between fibres containing distinct myosin isoforms is mainly due to their myosin isoform composition.
The molecular basis of the functional diversity among myosin isoforms can probably be found in the actin binding properties or in the ATPase activity of the myosin head. The amino acid sequences of several MHC isoforms considered in this study are available in databases (see Methods): all four human MHC isoforms (1, 2A, 2X and 2B: although MHC-2B is not expressed in human muscles, the gene has been identified in human genome), three mouse isoforms (1, 2A, 2X and a fragment of 2B) and two rabbit isoforms (1, 2X). These sequences allow paired comparisons revealing higher identity among orthologues than among paralogues: the identity of the four human MHC isoforms (full length) is between 80.6 % (1 compared to 2B) and 94.8 (2A compared to 2X), whereas the identity between orthologues ranges from 96 % (human vs. rabbit MHC-2X and human vs. mouse MHC-2A) to 97 % (human vs. rat slow MHC, 27 non-conserved residue substitutions) and 99 % (mouse vs. rat slow MHC, only nine non-conserved substitutions). Many regions are completely identical: among them is the Pi loop, several helices forming the nucleotide pocket, several regions of the actin binding surface including the sites of hydrophobic interaction and the hypertrophic cardiomyopathy (HCM) loop, and the converter domain. The myosin light chain binding regions and part of the S2 subfragment are also very conserved.
The surface loops are among the least conserved regions of the MHC head when MHC paralogues are compared (see Table 3): in slow compared to fast MHC isoforms the loop 1 at the opening of the ATP pocket is shorter, lacks one negative charge and is more stiff due to the presence of a proline; one additional proline is also present in MHC-2B. The loop 2 on the actin binding surface is also shorter in slow than in fast MHC and contains an additional proline: among fast isoforms MHC-2A has the longest loop 2. Interestingly, whereas loops 1 and 2 appear very conserved when slow MHC orthologues are compared (see Table 3), some diversity appears when fast MHC orthologues are compared: some non-conservative substitutions in loop 1 can be identified when comparing human and mouse, and loop 2 is longer in mouse than in human MHC-2X. The conclusion that surface loops 1 and 2 are very diverse among myosin paralogues but almost identical among myosin orthologues is in agreement with previously published comparisons between distant myosin isoforms (Goodson et al. 1999) and between rat and human slow myosin isoforms (Canepari et al. 2000). Studies on chimerical myosins with a modified loop 2 (Uyeda et al. 1994) or loop 1 (Sweeney et al. 1998) and comparison of myosin paralogues in human genoma (Weiss et al. 1999) support the view that the two loops can actually play a modulatory role. If this is true, the conservation of loops 1 and 2 is important to preserve the specialisation of myosin isoforms (Goodson et al. 1999).
Table 3.
Comparison of superficial loop sequences in orthologous MHC isoforms of mouse, rat, rabbit and man
| Species | Loop 1 | Loop 2 | Loop 3 |
|---|---|---|---|
| MHC-1 or slow | |||
| Man | AIG DRSKKDQSPGKG TLE | FA NYAGADAPIEKGKGKAKKGSSFQTVSAL | FQ KPRNIKGKPEAH FSLI |
| Rabbit | Sequence not available | FA NYAGADAPVEKGKGKAKKGSSF QTVSAL | FQ KPRNIKGKPEAHF ALI |
| Rat | AIG DRSKKDQTPGKG TLE | FA NYAGADAPVDKGKGKAKKGSSF QTVSAL | FQ KPRNI KGKQEAH FSLI |
| Mouse | AIG DRSKKDQTPGKG TLE | FA NYAGADAPADKGKGKAKKGSSF QTVSAL | FQ KPRNVKGKQEAH FSLV |
| MHC-2A | |||
| Man | VTG EKKKEEITSGKIQG TLE | FS GAQTAEGEGAGGGA-KKGGKKKGSSF QTVSAL | FQ KPKWKGKAEAH FALI |
| Mouse | VTG DKKKEEATSGKMQG TLE | FS GAQTAEAEASSGGAAKKGAKKKGSSF QTVSAL | FQ KPKWKGKAEAH FALI |
| MHC-2X | |||
| Man | VTG EKKKEEVTSGKMQG TLE | FV GATGAEAEAGGGKKGGKKKGSSF QTVSAL | FQ KPKPAKGKPEAH FSLI |
| Rabbit | VTG DKKKEEATSGKMQG TLE | LF TGTAAAEAE-GGGKKGGKKKGSSF QTVSAL | FQ KPKPAKRKVEAH FSLV |
| Mouse | VTG EKKKEEATSGKMQG TLE | LF SGAAAAAEAESGGGGGKKGAKKKGSSF QTVSAL | FQ KPKPAKGKVEAH FSLV |
Non-conservative changes compared with the human isoform are underlined.
The secondary actin binding loop (loop 3) shows pronounced diversity when both paralogues and orthologues are compared (see Table 3): with the human paralogues the secondary actin binding loops contain two prolines in slow MHC, one in MHC-2A and three in MHC-2X and MHC-2B. When orthologues are compared, up to three non-conserved substitutions can be found in the loop or in the flanking regions. A complete comparison between orthologues reveals several ‘hot spots’ where the non-conservative diversities tend to localise. The comparison of the slow MHC orthologues points to the following regions: (1) in the vicinity of the N-terminus in the spectrin homology domain (residues 4, 65), (2) in a group of amino acids close to the helices forming the ATP binding pocket (residues 135–136), (3) around the α-helix located at the opening of the ATP binding pocket (residues 331–345), (4) in the helices which form the end of the myosin head not far from the HCM loop (residue 424), (5) in loop 3 and flanking regions (residues 561, 573, 585) and (6) in the first portion of the S2 subfragment (residues 847–859). Some of these regions seem to be relevant also when fast orthologues are compared (the comparison is only possible between human and rabbit MHC-2X and between human and mouse MHC-2A and MHC-2X): for example one or two substitutions are present in the region close to the N-terminus and other residue substitutions can be found close to the helices forming the ATP pocket (residues 135, 140), in the loop 3 region (residues 570, 573, 585, 591) and in the S2 fragment (residues 859, 862, 870, 879). Loop 2, which appears conserved when slow orthologous isoforms are compared, shows some diversity when fast orthologous isoforms are compared (see above and Table 3). In conclusion the observed differences in shortening velocity or in speed of actin translocation seem to be based on structural differences located on the actin binding surface (loop 2 and the secondary actin binding loop), close to the catalytic site and to its opening (loop 1 and adjacent helices) and, surprisingly, also in the S2 subfragment. Interestingly, recent findings show that the rate of ADP release from the acto-myosin complex is different among myosin isoforms and is a major determinant of the differences in maximum shortening velocity among rat muscle fibres (Weiss et al. 2001). Such findings are consistent with the observation that some structural diversity among MHC isoforms occurs close to the catalytic site and to its opening.
The focus of this study was on MHC isoforms, and myosin isoforms were identified on the basis of their MHC isoform: it is not unlikely, however, that MLC isoforms may also contribute to determining the functional properties of myosin. It is worth noting that V0 and Vf were generally determined on distinct fibres, due to the need to use very long fibres to prepare sufficient myosin for the in vitro motility assay. As fibres were classified only on the basis of their MHC isoform composition and there was no attempt to also identify the MLC isoform, there is a chance that alkali MLC isoform composition differed in fibres used for V0 and fibres used for Vf determination. This would affect V0, particularly in the case of fast 2B and 2X fibres of rabbit (Sweeney et al. 1988) and rat (Bottinelli et al. 1994a), and might partially explain the lack of proportion between V0 and Vf values of 2X and 2B myosin (see Fig. 5).
Orthologous myosin isoforms, myosin isoform expression and scaling of muscle velocity with body size
All fibres examined in this study belonged to hind limb muscles, which are mainly used for posture and locomotion. As mentioned in the Introduction, the inverse relation between maximum shortening velocity and body mass in various animal species has been considered essential to preserve the locomotor properties of each species (Hill, 1950; Ford, 1984; Rome et al. 1990). The variation of maximum shortening velocity of a muscle can originate both from its fibre type composition (i.e. the proportion of fast fibres) and from the maximum shortening velocity of its fibres. The results of this study support the view that both mechanisms co-operate. First, the scaling of V0 with body mass has been found to occur in all fibre types. Second, although generalisations are not possible, the comparison of the myosin isoform composition of soleus and tibialis anterior in the four species was in agreement with previous observations (Hamalainen & Pette, 1995) that larger species do have a higher proportion of slow muscle fibres than smaller species. Fibre type composition, therefore, seems to contribute to the scaling of velocity of skeletal muscles in vivo with body size. In this respect, it must pointed out that the allometric coefficient of muscle shortening velocity predicted by theoretic analysis, (-0.33 (Hill 1950), −0.25 (McMahon, 1973, 1975) and −0.23 (Lindstedt et al. 1985)) is larger than the allometric coefficients (from −0.041 to −0.175) actually found for the V0 of single muscle fibres. This might be explained by a modification of the elastic theory first proposed by MacMahon (1984). However, the interspecies difference in fibre type composition of the muscles represents an alternative or additional explanation of such a discrepancy.
Interestingly, rabbit slow fibres align with those of mouse, rat and man, whereas rabbit fast fibres seem to represent an exception, being faster than predicted on the basis of the allometric equation. The reason why V0 of slow rabbit fibres scales with body size, as does V0 of mouse, rat and human slow fibres, whereas V0 of fast rabbit fibres is equal to if not higher than V0 of rat fast fibres, may be found in different locomotion patterns. Postural tasks and locomotion at slow speed mainly require recruitment of slow fibres (Burke et al. 1971). At slow speeds, locomotion is similar in all four species, i.e. all four species walk. To maintain similar walking speeds through a ≈2000-fold range of body size, it is expected that V0 of slow fibres scales with body size in the same way for all four species. Faster speeds of locomotion, however, require recruitment of fast fibres in addition to slow fibres. It is worth noting that the allometric coefficient for the stride frequency at the trot-gallop transition (-0.15; Heglund & Taylor, 1988) is similar to the allometric coefficient of V0 of single muscle fibres. The mouse and rat can reach higher locomotion speed with gallop, whereas the rabbit uses only one asymmetrical gait, the half-bound (Simons, 1999). The half-bound of the rabbit may require higher muscle power than gallop to generate comparable speeds of movement. Therefore fibres with higher maximum shortening velocity may be necessary to produce the required higher power.
It is also remarkable that V0 values of human muscle fibres align with those of fibres of other animals in spite of the bipedal locomotion of humans being clearly different from quadrupedal locomotion of mouse, rat and rabbit. This is true not only for slow fibres (see also Widrick et al. 1997) but also, as shown for the first time in this study, for fast fibres which are essential for running.
Scaling of velocity of shortening and energetic cost of locomotion
The energetic cost of locomotion per gram of body weight increases with decreasing body mass with an allometric coefficient of −0.3 (Taylor et al., 1982). Rome et al. (1990) observed that the scaling of maximum shortening velocity with body size is not sufficient to account for the increased cost of locomotion. To explain this discrepancy, it has been proposed that skeletal muscle fibres in small animals have a higher tension cost than in large animals, i.e. they require more ATP to develop a given amount of force (Taylor et al. 1982). Two recent findings on the energetic properties of single muscle fibres suggest that such an explanation is unlikely. Firstly the energy cost of tension generation shows large variation among fibres containing myosin paralogues, but little variation, and therefore virtually no scaling with body size, among fibres containing myosin orthologues (Bottinelli et al. 1994b; Potma et al. 1994; Stienen et al. 1996). Tension cost in slow fibres (in µmol J s−1 at 12 °C, measuring ATP consumption rate with an enzyme-linked photometric assay) varies from 0.66 in rat, to 0.48 in rabbit and 0.56 in human. Tension cost of fast 2X fibres is 1.8 in rat and 1.76 in human and tension cost of fast 2B fibres is 2.82 in rat and 3.16 in rabbit. Extrapolation to physiological temperature predicts an increase in tension cost as ATP hydrolysis rate increases more than tension development (Stienen et al. 1996; Hilber et al. 2001). This increase, however, should not cause an inter-species difference, which, on the other hand, might be produced by the higher body temperature of small mammals compared to large mammals. Secondly, the peak of thermodynamic efficiency of the chemomechanical transduction during loaded shortening is rather similar in fibres containing different myosin isoforms. Determinations of peak efficiency in rat fibres yielded 28 % in fast 2B fibres and 38 % in slow fibres (ATP consumption rate was measured with an enzyme linked photometric assay at 12 °C; Reggiani et al. 1997); in human muscles peak efficiency was 21 % in slow fibres and 27 % in fast 2A fibres (ATP consumption rate was measured at 12 °C with a fluorescent Pi probe; He et al. 2000); in rabbit psoas fibres, a peak efficiency of 25 % was obtained using the photometric assay (Potma & Stienen, 1996) and 36 % using the Pi probe (He et al. 1999). The analysis of temperature dependence of efficiency points to a higher efficiency at physiological temperature (He et al. 2000) and there is no evidence that differences among isoforms may appear at higher temperature.
Neither a higher tension cost nor a lower thermodynamic efficiency of muscle seems sufficient to explain the higher energetic cost of locomotion in smaller species. Power output, on the other hand, shows relevant changes when comparing fibres containing myosin paralogues and orthologues. Peak power can be calculated by multiplying P0 by V0 by a constant factor which for intact fibres can be approximated to 0.06 (Woledge et al. 1985). Such a factor for demembranated fibres at low temperature, due to the higher curvature of the force-velocity relation (see Julian et al. 1986), can be more precisely estimated at 0.04 under the assumption that peak power is reached at approximately 20 % P0 and 20 % V0 (Bottinelli et al. 1991, 1996; Reggiani et al. 1997; He et al. 2000; McDonald, 2000). In Fig. 6 the calculated values of peak power (per unit muscle volume) are plotted vs. the body mass, and allometric equations are fitted to the data. Peak power of single muscle fibres scales with body size with allometric coefficients of −0.239 for slow fibres, −0.119 for fast 2A fibres, −0.083 for 2B fibres and −0.066 for 2X fibres. As muscles in vivo shorten at the velocity at which peak power is developed (Rome et al. 1988), it is expected that in vivo skeletal muscles of small animals develop higher power relative to their mass than those of large animals. This conclusion is consistent with previous observations and theoretical considerations. The observation that the power-to-weight ratio is much higher in small than in large animals was made centuries ago by Galileo and was more recently confirmed by MacMahon (1984). A careful consideration of differences in velocity and power among species (Ford, 1984) suggests that the intrinsic muscle power, i.e. the power-to-weight ratio of the muscle, should be proportional to the inverse of muscle length. As efficiency is approximately invariant (see previous paragraph), the ATP consumption during contractions against a load is expected to vary in proportion to power output and therefore in inverse proportion to body size. The allometric coefficients of peak power (see above, Fig. 6) are still below the value (-0.3) determined for energy cost of locomotion; however, a further factor must be considered when moving from single fibres to whole muscles. This factor is the fibre type composition: the expression of fast myosin is higher in the muscles of small animal species (see Fig. 1). This factor will further increase the difference in power developed and the energy consumed by whole muscles between small and large animals and an allometric coefficient of −0.3 will probably be reached. It is reasonable to conclude that the higher energy cost of locomotion of smaller animals depends on the higher intrinsic power developed by their muscles, not on the fact that their muscles are intrinsically more energy consuming than muscles of larger animals (lower thermodynamic efficiency and/or a higher tension cost).
Acknowledgments
This work was supported by European Union contract HPRN-CT-2000-0091 and by a grant from the Italian Ministry of University and Research (Cofin 2000). The authors wish to thank Professor Alberto Minetti for interesting discussions and suggestions and Dr Susan Bortolotto for careful reading of the manuscript.
References
- Anson M. Temperature dependence and Arrhenius activation energy of F-actin velocity generated in vitro by skeletal myosin. J Mol Biol. 1992;224:1029–1038. doi: 10.1016/0022-2836(92)90467-x. [DOI] [PubMed] [Google Scholar]
- Bottinelli R, Betto R, Schiaffino S, Reggiani C. Unloaded shortening velocity and myosin heavy chain and alkali light chain isoform composition in rat skeletal muscle fibres. J Physiol. 1994a;478:341–349. doi: 10.1113/jphysiol.1994.sp020254. [DOI] [PMC free article] [PubMed] [Google Scholar]
- Bottinelli R, Canepari M, Pellegrino MA, Reggiani C. Force-velocity properties of human skeletal muscle fibres: myosin heavy chain isoform and temperature dependence. J Physiol. 1996;495:573–586. doi: 10.1113/jphysiol.1996.sp021617. [DOI] [PMC free article] [PubMed] [Google Scholar]
- Bottinelli R, Canepari M, Reggiani C, Stienen GJ. Myofibrillar ATPase activity during isometric contraction and isomyosin composition in rat single skinned muscle fibres. J Physiol. 1994b;481:663–675. doi: 10.1113/jphysiol.1994.sp020472. [DOI] [PMC free article] [PubMed] [Google Scholar]
- Bottinelli R, Reggiani C. Human skeletal muscle fibres: molecular and functional diversity. Prog Biophys Mol Biol. 2000;73:195–262. doi: 10.1016/s0079-6107(00)00006-7. [DOI] [PubMed] [Google Scholar]
- Bottinelli R, Schiaffino S, Reggiani C. Force-velocity relations and myosin heavy chain isoform compositions of skinned fibres from rat skeletal muscle. J Physiol. 1991;437:655–672. doi: 10.1113/jphysiol.1991.sp018617. [DOI] [PMC free article] [PubMed] [Google Scholar]
- Brenner B. The necessity of using two parameters to describe isotonic shortening velocity of muscle tissues: the effect of various interventions upon initial shortening velocity (vi) and curvature (b) Basic Res Cardiol. 1986;81:54–69. doi: 10.1007/BF01907427. [DOI] [PubMed] [Google Scholar]
- Burke RE, Levine DN, Zajac FE., III Mammalian motor units: physiological-histochemical correlation in three types in cat gastrocnemius. Science. 1971;174:709–712. doi: 10.1126/science.174.4010.709. [DOI] [PubMed] [Google Scholar]
- Canepari M, Rossi R, Pellegrino MA, Bottinelli R, Schiaffino S, Reggiani C. Functional diversity between orthologous myosins with minimal sequence diversity. J Muscle Res Cell Motil. 2000;21:375–382. doi: 10.1023/a:1005640004495. [DOI] [PubMed] [Google Scholar]
- Canepari M, Rossi R, Pellegrino MA, Reggiani C, Bottinelli R. Speeds of actin translocation in vitro by myosins extracted from single rat muscle fibres of different types. Exp Physiol. 1999;84:803–806. [PubMed] [Google Scholar]
- Edman KA. The velocity of unloaded shortening and its relation to sarcomere length and isometric force in vertebrate muscle fibres. J Physiol. 1979;291:143–159. doi: 10.1113/jphysiol.1979.sp012804. [DOI] [PMC free article] [PubMed] [Google Scholar]
- Ford LE. Some consequences of body size. Am J Physiol. 1984;247:H495–507. doi: 10.1152/ajpheart.1984.247.4.H495. [DOI] [PubMed] [Google Scholar]
- Goodson HV, Warrick HM, Spudich JA. Specialized conservation of surface loops of myosin: evidence that loops are involved in determining functional characteristics. J Mol Biol. 1999;287:173–185. doi: 10.1006/jmbi.1999.2565. [DOI] [PubMed] [Google Scholar]
- Greaser ML, Moss RL, Reiser PJ. Variations in contractile properties of rabbit single muscle fibres in relation to troponin T isoforms and myosin light chains. J Physiol. 1988;406:85–98. doi: 10.1113/jphysiol.1988.sp017370. [DOI] [PMC free article] [PubMed] [Google Scholar]
- Gulati J, Podolsky RJ. Isotonic contraction of skinned muscle fibers on a slow time base: effects of ionic strength and calcium. J Gen Physiol. 1981;78:233–257. doi: 10.1085/jgp.78.3.233. [DOI] [PMC free article] [PubMed] [Google Scholar]
- Hamalainen N, Pette D. Patterns of myosin isoforms in mammalian skeletal muscle fibres. Microsc Res Tech. 1995;30:381–389. doi: 10.1002/jemt.1070300505. [DOI] [PubMed] [Google Scholar]
- Harridge SD, Bottinelli R, Canepari M, Pellegrino MA, Reggiani C, Esbjornsson M, Saltin B. Whole-muscle and single-fibre contractile properties and myosin heavy chain isoforms in humans. Pflugers Arch. 1996;432:913–920. doi: 10.1007/s004240050215. [DOI] [PubMed] [Google Scholar]
- He ZH, Bottinelli R, Pellegrino MA, Ferenczi MA, Reggiani C. ATP consumption and efficiency of human single muscle fibers with different myosin isoform composition. Biophys J. 2000;79:945–961. doi: 10.1016/S0006-3495(00)76349-1. [DOI] [PMC free article] [PubMed] [Google Scholar]
- He ZH, Chillingworth RK, Brune M, Corrie JE, Webb MR, Ferenczi MA. The efficiency of contraction in rabbit skeletal muscle fibres determined from the rate of release of inorganic phosphate. J Physiol. 1999;517:839–854. doi: 10.1111/j.1469-7793.1999.0839s.x. [DOI] [PMC free article] [PubMed] [Google Scholar]
- Heglund NC, Taylor CR. Speed stride frequency and energy cost per stride: how do they change with body size and gait? J Exp Biol. 1988;138:301–318. doi: 10.1242/jeb.138.1.301. [DOI] [PubMed] [Google Scholar]
- Hill AV. The dimensions of animals and their muscular dynamics. Science Progress. 1950;38:209–229. [Google Scholar]
- Homsher E, Wang F, Sellers JR. Factors affecting movement of F-actin filaments propelled by skeletal muscle heavy meromyosin. Am J Physiol. 1992;262:C714–723. doi: 10.1152/ajpcell.1992.262.3.C714. [DOI] [PubMed] [Google Scholar]
- Hook P, Sriramoju V, Larsson L. Effects of aging on actin sliding speed on myosin from single skeletal muscle cells of mice rats and humans. Am J Physiol Cell Physiol. 2001;280:C782–788. doi: 10.1152/ajpcell.2001.280.4.C782. [DOI] [PubMed] [Google Scholar]
- Julian FJ, Rome LC, Stephenson DG, Striz S. The maximum speed of shortening in living and skinned frog muscle fibres. J Physiol. 1986;370:181–199. doi: 10.1113/jphysiol.1986.sp015929. [DOI] [PMC free article] [PubMed] [Google Scholar]
- Kruger M, Wright J, Wang K. Nebulin as a length regulator of thin filaments of vertebrate skeletal muscles: correlation of thin filament length nebulin size and epitope profile. J Cell Biol. 1991;115:97–107. doi: 10.1083/jcb.115.1.97. [DOI] [PMC free article] [PubMed] [Google Scholar]
- Laemmli UK. Cleavage of structural proteins during the assembly of the head of bacteriophage T4. Nature. 1970;227:680–685. doi: 10.1038/227680a0. [DOI] [PubMed] [Google Scholar]
- Lindstedt SL, Hoppeler H, Bard KM, Thronson HA., Jr Estimate of muscle-shortening rate during locomotion. Am J Physiol. 1985;249:R699–703. doi: 10.1152/ajpregu.1985.249.6.R699. [DOI] [PubMed] [Google Scholar]
- McDonald KS. Ca2+ dependence of loaded shortening in rat skinned cardiac myocytes and skeletal muscle fibres. J Physiol. 2000;525:169–181. doi: 10.1111/j.1469-7793.2000.00169.x. [DOI] [PMC free article] [PubMed] [Google Scholar]
- McMahon T. Size and shape in biology. Science. 1973;179:1201–1204. doi: 10.1126/science.179.4079.1201. [DOI] [PubMed] [Google Scholar]
- McMahon T. Muscles Reflexes and Locomotion. Princeton, NJ, USA: Princeton University Press; 1984. pp. 234–293. [Google Scholar]
- McMahon TA. Using body size to understand the structural design of animals: quadrupedal locomotion. J Appl Physiol. 1975;39:619–627. doi: 10.1152/jappl.1975.39.4.619. [DOI] [PubMed] [Google Scholar]
- Pellegrino MA, Bottinelli R, Canepari M, Rossi R, Reggiani C. Fibre types and shortening velocity in rabbit muscles: comparison with rat and human. Pflugers Arch(n2) 1999;438 [Google Scholar]
- Pette D, Staron RS. Cellular and molecular diversities of mammalian skeletal muscle fibers. Rev Physiol Biochem Pharmacol. 1990;116:1–76. doi: 10.1007/3540528806_3. [DOI] [PubMed] [Google Scholar]
- Potma EJ, Stienen GJ. Increase in ATP consumption during shortening in skinned fibres from rabbit psoas muscle: effects of inorganic phosphate. J Physiol. 1996;496:1–12. doi: 10.1113/jphysiol.1996.sp021660. [DOI] [PMC free article] [PubMed] [Google Scholar]
- Potma EJ, van Graas IA, Stienen GJ. Effects of pH on myofibrillar ATPase activity in fast and slow skeletal muscle fibers of the rabbit. Biophys J. 1994;67:2404–2410. doi: 10.1016/S0006-3495(94)80727-1. [DOI] [PMC free article] [PubMed] [Google Scholar]
- Reggiani C, Potma EJ, Bottinelli R, Canepari M, Pellegrino MA, Stienen GJ. Chemo-mechanical energy transduction in relation to myosin isoform composition in skeletal muscle fibres of the rat. J Physiol. 1997;502:449–460. doi: 10.1111/j.1469-7793.1997.449bk.x. [DOI] [PMC free article] [PubMed] [Google Scholar]
- Rome LC, Funke RP, Alexander RM, Lutz G, Aldrige H, Scott F, Freadman M. Why animals have different fiber types? Nature. 1988;335:824–827. doi: 10.1038/335824a0. [DOI] [PubMed] [Google Scholar]
- Schiaffino S, Reggiani C. Molecular diversity of myofibrillar proteins: gene regulation and functional significance. Physiol Rev. 1996;76:371–423. doi: 10.1152/physrev.1996.76.2.371. [DOI] [PubMed] [Google Scholar]
- Seow CY, Ford LE. Shortening velocity and power output of skinned muscle fibers from mammals having a 25,000-fold range of body mass. J Gen Physiol. 1991;97:541–560. doi: 10.1085/jgp.97.3.541. [DOI] [PMC free article] [PubMed] [Google Scholar]
- Simons RS. Running breathing and visceral motion in the domestic rabbit (Oryctolagus cuniculus): testing visceral displacement hypotheses. J Exp Biol. 1999;202:563–577. doi: 10.1242/jeb.202.5.563. [DOI] [PubMed] [Google Scholar]
- Smerdu V, Karsch-Mizrachi I, Campione M, Leinwand L, Schiaffino S. Type IIx myosin heavy chain transcripts are expressed in type IIb fibers of human skeletal muscles. Am J Physiol. 1994;267:C1723–1728. doi: 10.1152/ajpcell.1994.267.6.C1723. [DOI] [PubMed] [Google Scholar]
- Stienen GJ, Kiers JL, Bottinelli R, Reggiani C. Myofibrillar ATPase activity in skinned human skeletal muscle fibres: fibre type and temperature dependence. J Physiol. 1996;493:299–307. doi: 10.1113/jphysiol.1996.sp021384. [DOI] [PMC free article] [PubMed] [Google Scholar]
- Sweeney HL, Kushmerick MJ, Mabuchi K, Sreter FA, Gergely J. Myosin alkali light chain and heavy chain variations correlate with altered shortening velocity of isolated skeletal muscle fibers. J Biol Chem. 1988;263:9034–9039. [PubMed] [Google Scholar]
- Sweeney HL, Rosenfeld SS, Brown F, Faust L, Smith J, Xing J, Stein LA, Sellers JR. Kinetic tuning of myosin via a flexible loop adjacent to the nucleotide binding pocket. J Biol Chem. 1998;273:6262–6270. doi: 10.1074/jbc.273.11.6262. [DOI] [PubMed] [Google Scholar]
- Talmadge RJ, Roy RR. Electrophoretic separation of rat skeletal muscle myosin heavy-chain isoforms. J Appl Physiol. 1993;75:2337–2340. doi: 10.1152/jappl.1993.75.5.2337. [DOI] [PubMed] [Google Scholar]
- Taylor CR, Heglund NC, Maloiy GM. Energetics and mechanics of terrestrial locomotion. I. Metabolic energy consumption as a function of speed and body size in birds and mammals. J Exp Biol. 1982;97:1–21. doi: 10.1242/jeb.97.1.1. [DOI] [PubMed] [Google Scholar]
- Thedinga E, Karim N, Kraft T, Brenner B. A single-fiber in vitro motility assay. In vitro sliding velocity of F-actin vs. unloaded shortening velocity in skinned muscle fibers. J Muscle Res Cell Motil. 1999;20:785–796. doi: 10.1023/a:1005658825375. [DOI] [PubMed] [Google Scholar]
- Uyeda TQ, Ruppel KM, Spudich JA. Enzymatic activities correlate with chimaeric substitutions at the actin-binding face of myosin. Nature. 1994;368:567–569. doi: 10.1038/368567a0. [DOI] [PubMed] [Google Scholar]
- Weiss S, Rossi R, Pellegrino MA, Bottinelli R, Geeves MA. Differing ADP release rates from myosin heavy chain isoforms define the shortening velocity of skeletal muscle fibers. J Biol Chem. 2001;276:45902–45908. doi: 10.1074/jbc.M107434200. [DOI] [PubMed] [Google Scholar]
- Weiss A, Schiaffino S, Leinwand LA. Comparative sequence analysis of the complete human sarcomeric myosin heavy chain family: implications for functional diversity. J Mol Biol. 1999;290:61–75. doi: 10.1006/jmbi.1999.2865. [DOI] [PubMed] [Google Scholar]
- Widrick JJ, Romatowski JG, Karhanek M, Fitts RH. Contractile properties of rat rhesus monkey and human type I muscle fibers. Am J Physiol. 1997;272:R34–42. doi: 10.1152/ajpregu.1997.272.1.R34. [DOI] [PubMed] [Google Scholar]
- Woledge RC, Curtin NA, Homsher E. Energetic Aspects of Muscle Contraction. London: Academic Press; 1985. Monographs of the Physiological Society No. 41. [PubMed] [Google Scholar]