

Abstract
Despite the obvious role of hypoxia in eliciting respiratory acclimatisation in humans, the function of the peripheral chemoreflex is uncertain. We investigated this uncertainty using 3 h of isocapnic hypoxia as a stimulus (end-tidal PCO2, 0.5–1.0 mmHg above eucapnia; end-tidal PO2, 50 mmHg), hypothesising that this stimulus would induce an enhancement of the peripheral chemoreflex ventilatory response to hypoxia. Current evidence conflicts as to whether this enhancement is mediated by an increase in the sensitivity or a decrease in the threshold of the peripheral chemoreflex ventilatory response to carbon dioxide. Employing a modified rebreathing technique to assess chemoreflex function, we found evidence of the latter in nine healthy volunteers (six male, three female). Testing consisted of pairs of isoxic rebreathing tests at high and low levels of oxygen, performed before, immediately after and 1 h after a 3 h isocapnic hypoxic exposure. No parameters changed significantly in the high-oxygen rebreathing tests. In the low-oxygen rebreathing tests there were no changes in non-chemoreflex ventilatory drives, or in the sensitivity to carbon dioxide, but the carbon dioxide response threshold decreased (≈1.5 mmHg) immediately after exposure, and the decrease persisted for 1 h (one-way repeated-measures ANOVA; P < 0.05). We repeated the protocol in five of the original nine volunteers, but this time exposing them to isocapnic normoxia. No trends or significant changes were observed in any of the rebreathing test parameters. These findings demonstrate that in the earliest stages of acclimatisation, there is a decrease in the threshold of the peripheral chemoreflex response to carbon dioxide, which persists for at least 1 h after the return to normoxia. We suggest that ventilatory acclimatisation to hypoxia results from this decreased threshold, reflecting an increase in the activity of the peripheral chemoreflex.
Adult humans undergo a ventilatory acclimatisation after prolonged exposure to hypoxia (Sato et al. 1992). A marked increase in ventilation occurs some time after an initial acute hypoxic ventilatory response and subsequent hypoxic ventilatory decline (Easton et al. 1986). Signs of this acclimatisation may be evident as early as 2 h after the initial exposure (Garcia et al. 2001) and are certainly evident after 8 h (Howard & Robbins, 1995).
Ventilatory acclimatisation may be mitigated by alterations in acid-base status. However, when respiratory alkalosis is prevented, by maintaining isocapnia, a response is still observed (Howard & Robbins, 1995). Hence, hypoxia is implicated as playing a major role in ventilatory acclimatisation. In fact, 8 h of hyperoxia has opposite effects to those of hypoxia, thus suggesting that there exists a degree of acclimatisation to normoxia at sea level (Ren et al. 2000).
Despite the obvious role of hypoxia in eliciting acclimatisation in humans, the specific adaptations of the peripheral chemoreflex are uncertain. Recently some investigators observed augmented sensitivities to carbon dioxide for both the central and peripheral chemoreflexes (Fatemian & Robbins, 1998; Tansley et al. 1998). However, earlier work demonstrated that in addition to such increases in sensitivity, there are also increases in overall activities, as evidenced by the leftward shift of ventilatory responses to carbon dioxide (Forster et al. 1971; Sato et al. 1992). Furthermore others, testing the peripheral chemoreflex specifically, also found evidence of an increased overall activity, but increases in the sensitivity to hypoxia occurred only when the depth of hypoxia resulted in a greater than 75 % arterial desaturation (Garcia et al. 2001). Although all these studies are limited to measuring peripheral chemoreflex function via changes in ventilatory response, so that changes may be occurring anywhere along the chemoreflex arc, the implication that the carotid body may be the site of the adaptation is strengthened by the observation that humans with bilaterally resected carotid bodies are unresponsive to hypoxic exposures (Honda, 1992).
The ventilatory response to hypoxia can be completely explained through changes in the peripheral chemoreflex ventilatory response to carbon dioxide (Rapanos & Duffin, 1997); with hypoxia, the sensitivity (slope) of the ventilatory response to carbon dioxide is increased, accompanied by a decreased threshold (Mohan & Duffin, 1997). Thus any enhancement of the ventilatory response to hypoxia brought about by a prolonged exposure to hypoxia could be mediated by an alteration in the peripheral chemoreflex ventilatory response to carbon dioxide, either via an increased sensitivity, or via a decreased threshold, or both. For example, in a recent study of the effects of repeated daily 20 min exposures to hypoxia over 14 days, we demonstrated an enhancement of the isocapnic ventilatory response to hypoxia (Mahamed & Duffin, 2001). We found that this enhancement was produced by a decrease in the threshold of the peripheral chemoreflex ventilatory response to carbon dioxide, rather than an increase in sensitivity, and interpreted the decrease in threshold as indicating an increase in the overall activity of the peripheral chemoreflex for any given level of stimulus. Following the same reasoning, we hypothesise here that the increase in the ventilatory response to isocapnic hypoxia, when it is prolonged (Howard & Robbins, 1995), results from an increase in the overall activity of the peripheral chemoreflex, which would manifest as a decrease in the threshold of the peripheral chemoreflex ventilatory response to carbon dioxide.
We also hypothesise that the earliest detectable signs of peripheral chemoreflex adaptation are evident after 3 h of exposure to hypoxia, because that is when the earliest significant increase in ventilation is evident in humans (see Fig. 2 in Howard & Robbins, 1995). We present data from modified rebreathing tests with which we were able to characterise the respiratory chemoreflexes more fully (Duffin et al. 2000). These tests provide results that support the hypothesis that the threshold of the peripheral chemoreflex ventilatory response to carbon dioxide is decreased after 3 h of exposure to hypoxia, but the sensitivity to carbon dioxide is unchanged. We suggest that the decreased peripheral chemoreflex threshold for carbon dioxide is responsible for the early ventilatory acclimatisation to hypoxia, and suffices to explain the initial changes in ventilation. In addition, we provide evidence that the enhancement of the peripheral chemoreflex responsiveness is not only apparent in the control of breathing as early as 3 h into a hypoxic exposure, but also persists for at least 1 h after return to normoxia.
METHODS
Subjects
This study was approved by the human ethics committee of the University of Toronto and conforms to the Declaration of Helsinki. Nine healthy subjects (six male, three female) volunteered to participate in this study after giving their informed, written consent. Volunteers were free from medication, non-smokers and had no history of cardiorespiratory disease. Their mean ±s.d. age, height and body mass were 27.1 ± 4.5 years, 177.3 ± 8.3 cm and 76.3 ± 12.1 kg, respectively.
Protocol
Each volunteer visited the laboratory on three occasions. The first visit was brief (1.5 h) and consisted of familiarisation runs on all the apparatus that was to be used. On their second visit each subject performed a 3 h, eucapnic-isocapnic, hypoxic-isoxic exposure. The schedule for each volunteer's day proceeded along a similar timetable; subjects arrived at the laboratory at approximately 10.00 h and after ≈15 min, were instrumented with Respibands (Miami Beach, USA) an ear-clip pulse oximeter and a nasal cannula. During a quiet resting period before testing began, their resting end-tidal partial pressures of carbon dioxide and oxygen were recorded via the nasal cannula. At 11.00 h they performed the first pair of rebreathing tests. One hour later, at 12.00 h, the 3 h hypoxic exposure began with 20 min of rest before the sealed chamber reached the final hypoxic level. Isoxia was maintained at an end-tidal partial pressure of 50 mmHg during the exposure and isocapnia was maintained at an end-tidal partial pressure of either 0.5 or 1.0 mmHg above the measured resting level throughout the test. The second pair of rebreathing tests was performed at 15.30 hours, immediately after the subjects left the chamber, and the last pair of tests was performed 1 h later at 16.30 h. Subjects were usually discharged at 17.00 h. The third visit was identical to the second visit except chamber exposures were at an end-tidal isoxic partial pressure equal to each subject's resting normoxic level.
Modified rebreathing
A modification of Read's original rebreathing test (Read, 1967), described by Casey et al. (1987) and Duffin & McAvoy (1988), was used to assess respiratory chemoreflex parameters. The method has been updated (Mohan & Duffin, 1997), and the paper now includes a detailed review of the interpretation of rebreathing test results (Duffin et al. 2000).
Briefly, the two modifications to Read's rebreathing technique are the inclusion of a prior hyperventilation and the maintenance of isoxia throughout the test. The former facilitates subthreshold and suprathreshold estimates of ventilation and enables a carbon dioxide threshold to be discerned rather than extrapolated. The latter modification, with a background of hyperoxia, diminishes the peripheral chemoreflex contribution to breathing, while with a background of hypoxia, the peripheral chemoreflex contribution is augmented. Subtraction of the two responses allows for the separation of central and peripheral respiratory chemoreflex responses to carbon dioxide.
Rebreathing tests were performed in pairs in a fixed order, always beginning with a hypoxic rebreathing test followed by a hyperoxic one. Each rebreathing test consisted of 5 min of hyperventilation, during which volunteers were coached to maintain an end-tidal partial pressure of carbon dioxide between 19 and 25 mmHg. The rebreathing bag initially contained oxygen at the desired isoxic partial pressure, and carbon dioxide at a partial pressure of about 42 mmHg. Rebreathing began at the end of expiration and was followed by three deep breaths, producing rapid equilibration of carbon dioxide partial pressures in the bag, lungs and arterial blood to that of mixed venous blood. This equilibration was verified by observation of a plateau in end-tidal carbon dioxide partial pressure, and was a prerequisite for continuing the test. Rebreathing tests were terminated either when ventilation exceeded 100 l min−1 or when the end-tidal partial pressure of carbon dioxide exceeded 60 mmHg. Some volunteers had tests terminated at lower levels of ventilation because of self-reported discomfort.
During rebreathing tests, all subjects were seated upright and wore a mouthpiece, nose clips and an ear oximeter probe while having their ventilation measured using a turbine (VMM 110 with VMM-2A transducer; Alpha Technologies, Aliso Viejo, USA). Samples of tidal gases were drawn near the mouth via a narrow bore sampling tube at a rate of 60 ml min−1 so that partial pressures could be measured using a mass spectrometer (MGA 1100, Perkin Elmer). A three-way, T-shaped valve (2100 Series; Hans Rudolph, Kansas City, USA) permitted switching subjects from breathing room air to rebreathing from a 10 l plastic bag (filled with 5–7 l of premixed gas). While rebreathing, isoxia was maintained under computer control and achieved by supplementing oxygen to the bag side of the three-way valve.
Chamber exposures
Chamber exposures were approximately 3.5 h in length. They each began with 20 min of rest, followed by a 15 min transition to hypoxia and ended after 3 h of hypoxic exposure. All subjects sat in a chamber with internal dimensions of 2.2 m long, 2.0 m wide and 2.2 m high, yielding a volume of 9.7 m3. The chamber was sealed and contained a humidifier, an air conditioner, fans, a desk, a chair, a reclining lawn chair, a portable computer and a radio for the subjects to use at their discretion. In addition, most monitoring equipment was contained within the room, and signals were passed through the chamber wall in wires to a remote computer data acquisition system. Two windows, one small (0.7 m2) and one large (2.25 m2) permitted the subject to view out of the building and to see the experimenter, respectively. Communication was via a battery-operated personal communication device (Talkabout FR50, Motorola). While in the chamber, tidal gases were sampled from a nasal cannula, oximetry data was collected via an ear-clip sensor and ventilation was measured using inductance plethysmography (Respitrace 200; NIMS, Miami Beach, USA)
End-tidal carbon dioxide and oxygen were maintained at partial pressures based on measurements taken prior to any testing during a period of relaxed and quiet wakefulness. Isoxia was maintained at the measured euoxic partial pressure before hypoxic exposure, and carbon dioxide was maintained 0.5 or 1.0 mmHg above the eucapnic partial pressure throughout the test. During the hypoxic exposure, the subjects’ end-tidal oxygen partial pressure was maintained at a level of 50 mmHg. To quickly reach this low oxygen level, nitrogen gas was released manually into the chamber at a very high flow; a pressure-release valve prevented the chamber pressure from rising more than 1 cmH2O above ambient pressure while rapidly flooding the chamber with gases.
Isocapnic control exposures were performed with isoxia maintained at the euoxic end-tidal partial pressure throughout the test. To simulate the noise and disturbance to the subject caused by manually flooding the chamber with nitrogen during hypoxic exposures, compressed room air was flooded into the chamber for approximately 15 min for a time corresponding to the transition from normoxia to hypoxia.
The general strategy for controlling end-tidal gases during exposure was to supplement or remove gases as they deviated from their target levels. Volumes of gases were delivered or removed under computer control, based on feedback signals comprising the average of end-tidal values collected on a breath-by-breath basis over a 2 min interval. Raising levels of carbon dioxide or oxygen was achieved by supplying them from compressed tanks. Lowering carbon dioxide was achieved by circulating chamber air through a carbon dioxide absorbent crystal (Baralyme; Allied Health Care Products, St Louis, USA) with a fan in a subsidiary duct and lowering oxygen was achieved by adding nitrogen from a compressed tank.
Data acquisition
A 16 bit analog-to-digital converter (National Instruments, AT-MIO-16XE-50) digitised analog signals for on-line computer analysis using specially written software (LabVIEW, National Instruments, source code available on request). The software calculated tidal volumes, inspiratory and expiratory times, ventilation and both end-tidal and inspired partial pressures of both carbon dioxide and oxygen on a breath-by-breath basis. This measurement system was calibrated before each experimental session using gases of known concentrations, and a calibrated 3 l volume syringe (model 5530, Hans Rudolph). The same computer that acquired data during the exposures and rebreathing tests was also responsible for controlling the chamber carbon dioxide absorber circuit fan and the oxygen, nitrogen and carbon dioxide supply valves.
Data analysis
Rebreathing test data were accumulated on a breath-by-breath basis. Since end-tidal carbon dioxide levels rise linearly during a rebreathing test, they were plotted against time and regressed to yield a predicted level of carbon dioxide. This procedure minimises the effects of noise artefacts and aberrant measures from the carbon dioxide signal, allowing regression techniques to fit the ventilation vs. end-tidal partial pressure of carbon dioxide. Ventilation was then plotted against the predicted partial pressure of carbon dioxide and fitted with a model equation composed of three segments. The model has been described in previous work (Duffin et al. 2000).
In brief, the model fits an exponential decline to a basal level of ventilation before the first break point in ventilation. Beyond this first breakpoint and before the next one, if it exists, the model fits a straight line through the ventilation points. Finally, if a second break point exists, a straight line is fitted from it through the rest of the ventilation points. All segments are fitted through an iterative process whereby thresholds and other parameters are varied slightly to obtain an optimal fit to the observed data by minimising the sum of squares (Levenberg-Marquardt algorithm). The process is automated and performed using algorithms written specifically to operate within a commercial graphics package (SigmaPlot 5.0, SPSS). The main test parameters obtained were: subthreshold or basal ventilation (V̇Eb), first and second thresholds for carbon dioxide (V̇Et1 and V̇Et2, respectively), and first and second slopes (V̇Es1 and V̇Es2, respectively). Not all subjects reached their second break point in ventilation before rebreathing tests were terminated; therefore, for the purpose of this study, V̇Et2 and V̇Es2 were not considered for further statistical analysis.
The 3 h chamber exposure data were also accumulated on a breath-by-breath basis. Ventilation data were obtained via inductance plethysmography, but left uncalibrated for volume. Therefore we plotted ventilation measures relative to baseline. These data were then filtered to remove points obtained while moving around or while eating. The breath-by-breath data were then placed in 5 min bins for graphical display and trend analysis.
Statistical analysis
Parameters obtained from rebreathing tests were contrasted to determine the effects of hypoxic or normoxic isocapnic exposures using repeated measures analysis of variance (RMANOVA) with a significance level of 0.05. Where appropriate, significant changes were characterised further by Student-Newmans-Keuls pairwise comparisons. Trends revealed through statistical analysis were also confirmed graphically. Data are reported as means ± s.e.m. unless stated otherwise.
RESULTS
Each of the nine volunteers completed the entire hypoxic exposure protocol; five also completed an isocapnic room air control exposure. Subjects were permitted to move about the chamber, but in general chose to remain seated and partially reclined, reading or using a computer for miscellaneous activities during the experiment. Although two subjects reported having a mild headache during the hypoxic exposure, they completed the protocol nonetheless. Volunteers were also permitted to eat during the first 1.5 h of exposure; inductance plethysmography became erratic during these times, and so ventilation measurements acquired while eating or moving about were removed from further analysis.
Response to isocapnic exposures
During chamber exposures, the mean ± s.d. end-tidal carbon dioxide partial pressure was 38.8 ± 0.2 mmHg during the isocapnic hypoxic exposure and 39.9 ± 0.6 mmHg during the isocapnic normoxic exposure. Isoxia was maintained at a mean ± s.d. end-tidal level of 51.9 ± 0.8 mmHg for the hypoxic exposures and at an end-tidal level of 105.1 ± 1.5 mmHg for the normoxic control exposures. It took an average of 15 ± 3 min to reach the desired hypoxic level from resting pre-exposure levels. The level of hypoxia chosen resulted in an arterial oxygen desaturation of 10.4 % from a mean ± s.d. pre-exposure level of 95.2 ± 0.8 % to an average level of 84.7 ± 1.4 %. The breath-by-breath data of a typical isocapnic hypoxic exposure for a single subject are shown in Fig. 1.
Figure 1. The respiratory measures for a typical subject during the 3 h exposure to isocapnic, isoxic hypoxia.
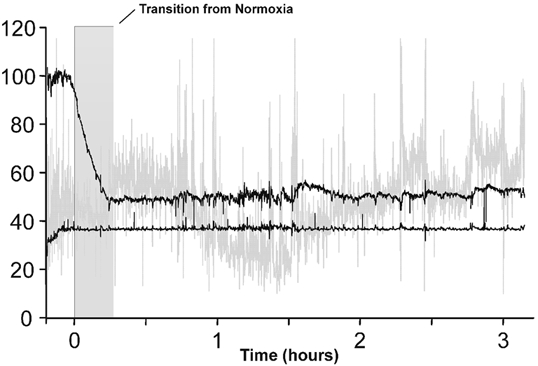
The end-tidal partial pressure of carbon dioxide was held 0.5–1.0 mmHg above eucapnia, and the end-tidal partial pressure of oxygen was held at 50 mmHg. The top and bottom black lines show end-tidal partial pressures (mmHg) of oxygen and carbon dioxide, respectively, and the grey line shows the relative change in ventilation (arbitrary units).
Figure 2 shows that during the exposure to hypoxia, the average response for all subjects consisted of an acute hypoxic ventilatory response (peak of 72 % over baseline), a subsequent decline in ventilation (trough of 38 % over baseline) and a further ventilatory acclimatisation (maximum of 102 % over baseline). During room air control there was no discernible trend; however, ventilation increased by approximately 29 % over baseline. A further regression analysis of the last 2 h of ventilation data for hypoxic and normoxic exposures revealed that there was a positive and significant correlation in hypoxia (Pearson Product Moment, R2 = 0.64, P < 0.05) and a small negative correlation in normoxia (Pearson Product Moment, R2 = 0.21, P < 0.05).
Figure 2. The mean relative changes in ventilation for all subjects during the 3 h exposure to isocapnic isoxic hypoxia and isocapnic isoxic normoxia.
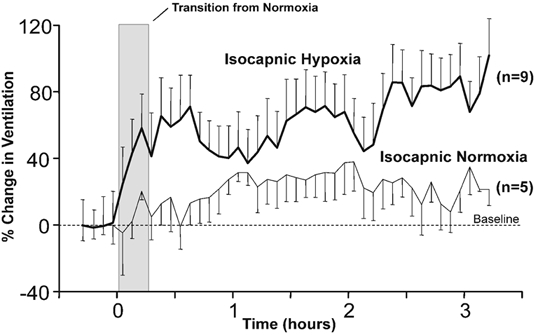
Mean relative changes in ventilation during a 3 h exposure to isocapnic, isoxic hypoxia (thick black line), in which the end-tidal partial pressure of carbon dioxide was held 0.5–1.0 mmHg above eucapnia and the end-tidal partial pressure of oxygen was held at 50 mmHg, and during a 3 h exposure to isocapnic, isoxic normoxia (thin black line), in which the end-tidal partial pressure of carbon dioxide was held 0.5–1.0 mmHg above eucapnia and the end-tidal partial pressure of oxygen was held at 105 mmHg. Data are expressed as the means of 5 min averages calculated for each subject and the error bars represent the standard errors.
Changes in chemoreflex control
No significant changes were observed in any rebreathing test parameters for the control exposure, and most were also unchanged by the hypoxic exposure. However, after exposure to hypoxia, we observed a significant decline in the threshold of the ventilatory response to carbon dioxide measured during hypoxic isoxic rebreathing tests. Representative breath-by-breath rebreathing responses are shown in Fig. 3.
Figure 3. Rebreathing test results showing typical changes before and after exposure to isocapnic hypoxia for two representative subjects.
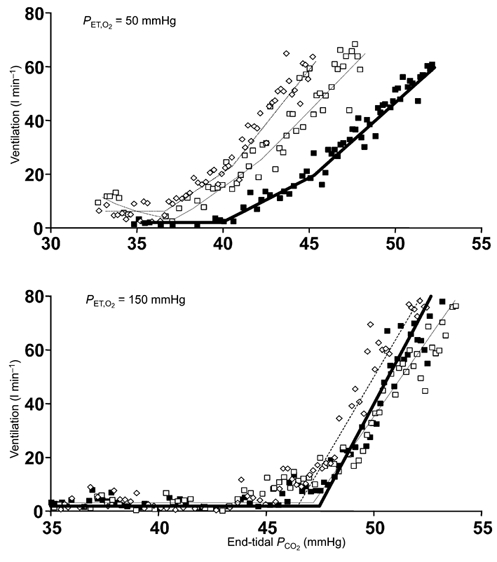
The top graph shows breath-by-breath plots of ventilation vs. end-tidal partial pressure of carbon dioxide during isoxic hypoxic rebreathing tests (50 mmHg) for one subject and the bottom graph shows the same plots for another subject during hyperoxic rebreathing tests (150 mmHg, bottom). The rebreathing tests were done before hypoxic exposure (▪) immediately after the exposure (□) and 1 h later (⋄). The lines (thick, thin and dotted) are the model fits of the breath-by-breath data. PCO2, partial pressure of carbon dioxide.
The threshold for carbon dioxide in hypoxic isoxic tests decreased significantly (one-way RMANOVA, P = 0.012) from the pre-exposure level of 38.7 ± 1.1 to 37.0 ± 1.3 mmHg immediately afterwards, and remained lowered; 1 h later it was 36.9 ± 1.0 mmHg. The averaged findings for all subjects during all rebreathing tests are summarised in Table 1.
Table 1.
Rebreathing test parameters
| Hypoxic | Hyperoxic | |||||
|---|---|---|---|---|---|---|
| Pre | Post | Ih Post | Pre | Post | Ih Post | |
| Hypoxic exposures (n = 9) | ||||||
| Threshold (mmHg PCO2) | 38.7 ± 1.1 | 37.0 ± 1.3* | 36.9 ± 1.0* | 42.4 ± 1.0 | 41.5 ± 1.0 | 41.6 ± 0.9 |
| Sensitivity to CO2 (1 min−1 mmHg−1) | 6.8 ± 1.5 | 7.6 ± 1.9 | 8.4 ± 2 | 5.1 ± 1.3 | 6.0 ± 1.8 | 5.9 ± 1.2 |
| Basal ventilation (1 min−1) | 6.6 ± 2.3 | 6.5 ± 1.8 | 8.4 ± 1.8 | 5.5 ± 1.2 | 6.8 ± 1.6 | 7.4 ± 1.6 |
| Normoxic exposures (n = 5) | ||||||
| Threshold (mmHg PCO2) | 38.7 ± 1.1 | 39.9 ± 1.2 | 40.1 ± 1.8 | 42.8 ± 1 | 44 ± 1.5 | 42.6 ± 1.3 |
| Sensitivity to CO2 (1 min−1 mmHg−1) | 5.8 ± 1.4 | 6.8 ± 1.5 | 8.1 ± 2.2 | 6.4 ± 2.2 | 4.9 ± 1.2 | 5.5 ± 2.6 |
| Basal ventilation (1 min−1) | 6.0 ± 0.8 | 4.8 ± 1.1 | 5.9 ± 0.3 | 3.9 ± 0.6 | 3.5 ± 1.1 | 4.1 ± 0.5 |
A comparison of the means ± S.E.M. rebreathing test parameters, measured using isoxic hypoxic (end-tidal partial pressure of oxygen (PO2) 50 mmHg) and hyperoxic (end-tidal PO2 150 mmHg) rebreathing tests, before (Pre), after (Post) and 1 h after (Ih Post) isocapnic (0.5–1.0 mmHg above eucapnia), hypoxic (end-tidal PO2 50 mmHg) and normoxic (end-tidal PO2 105 mmHg) exposures.
Parameters significantly different from pre-exposure measurements.
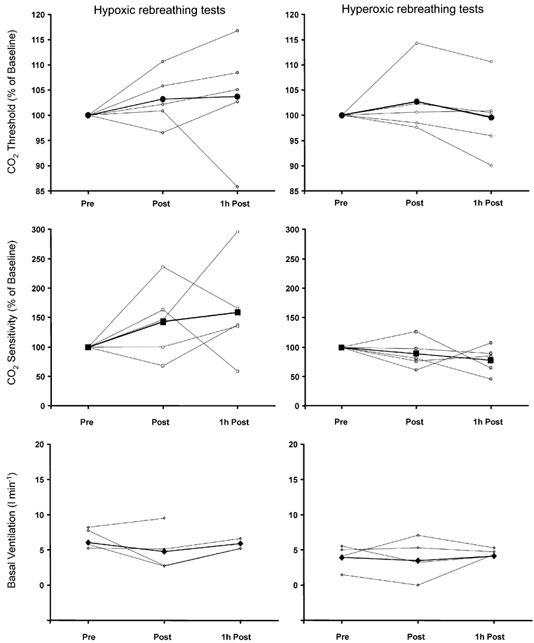
Comparisons of the rebreathing test data between subjects demonstrated a clear pattern in the changing threshold. Figure 4 shows that while immediately after hypoxic exposure (Post), the threshold was always lower than the pre-exposure level (Pre), 1 h later (1 h Post), three volunteers had recovered to their normal pre-exposure carbon dioxide threshold and the remaining six continued to decline. No such patterns were observed in other rebreathing test parameters for either the hypoxic or normoxic, isocapnic exposures (Fig. 4 and Fig. 5). We also attempted to discern any sex bias by analysing separately the data of the three female subjects, but found no differences that warranted treating them separately.
Figure 4. Changes in rebreathing test parameters with exposure to isocapnic hypoxia.
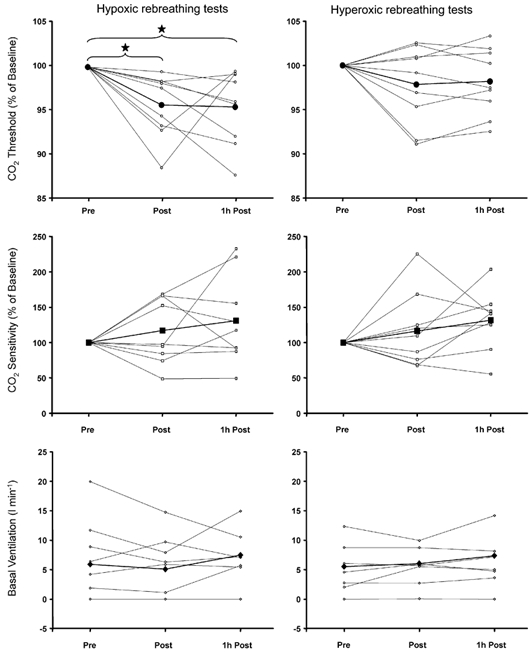
Data for each volunteer are separately plotted for each condition. Thick lines represent the mean of all subjects and * indicates statistical significance (repeated-measures ANOVA, P < 0.05). Pre, before exposure; Post, immediately after exposure; 1h Post, 1 h after the end of exposure.
Figure 5. Changes in rebreathing test parameters with exposure to isocapnic normoxia.
Data for each volunteer are separately plotted for each condition. Thick lines represent the mean of all subjects.
DISCUSSION
The main findings of this study are: (1) after 3 h of isocapnic hypoxic exposure there was an enhanced ventilatory response to carbon dioxide and hypoxia; (2) the peripheral chemoreflex is the likely mediator of the enhanced ventilatory responses, as suggested by the observation of significant changes in rebreathing test parameters only in hypoxic tests; (3) the only rebreathing test parameter to change was the threshold of the response to carbon dioxide, sensitivity was unchanged; and (4) the threshold change persisted for at least 1 h after returning to normoxia.
Since the peripheral chemoreflex only decreased its threshold for carbon dioxide after the 3 h exposure to isocapnic hypoxia, and did not change after 3 h exposure to isocapnic normoxia, we suggest that this change is responsible for the ventilatory acclimatisation to hypoxia, although we acknowledge that this evidence is necessarily correlative. We also suggest that the decreased threshold is the result of an overall increase in peripheral chemoreflex activity.
Chamber exposures
To keep subjects isocapnic and isoxic, we used a chamber similar in form and function to that used by Howard et al. (1995). One of the problems encountered when maintaining end-tidal carbon dioxide and oxygen in a chamber is the quality of the control. We opted not to use the end-tidal forcing strategy proposed by Swanson & Bellville (1975) in favour of a simple feedback control of inspired gases. The errors in end-tidal carbon dioxide and oxygen partial pressures we observed were less than 0.5 and 1.5 mmHg, respectively, and compare favourably with those of other recent studies (Howard & Robbins, 1995; Howard et al. 1995; Fatemian & Robbins, 2001; Garcia et al. 2001). We achieved this degree of control by keeping the chamber well mixed and ensuring that gases could be added or removed very quickly, updating chamber conditions according to measures averaged every 2 min, rather than 5 min (Howard et al. 1995).
The choice of end-tidal isocapnic partial pressure in the chamber was determined specifically for each subject, based on an estimate of their eucapnic end-tidal partial pressure of carbon dioxide. We decided to maintain isocapnia at approximately 1 mmHg above the measured eucapnic level for both the hypoxic and normoxic exposures, and are confident that this moderate hypercapnia did not instigate the chemoreflex parameter changes observed after the hypoxic exposures because they were not observed after the normoxic exposures. We observed no significant changes in chemoreflex parameters in the control series of experiments, therefore we are confident that the observed changes can be attributed to the 3 h of hypoxia. The same reasoning indicates that the rebreathing procedure itself was not the source of the observed changes.
We have reported previously changes in chemoreflex control after single and repeated 20 min exposures to hypoxia (Mahamed & Duffin, 2001). In that study, the hypoxia was realised by using a 10 % oxygen inspirate, with the resulting end-tidal partial pressures of oxygen very near 50 mmHg. We therefore chose to maintain the same level of isoxia for the 3 h hypoxic exposures of the current study. This degree of hypoxia resulted in a roughly 10 % decrease in arterial saturation and, as our findings indicate, was sufficiently low to cause the peripheral chemoreflexes to adapt.
Ventilation measurements
We report a twofold increase in ventilation over the resting baseline measurement after 3 h of hypoxic exposure, similar to that observed within the first 3 h of the 8 h exposure used by Howard & Robbins (1995). This increase in ventilation suggests that an adaptation had indeed taken place. We chose to analyse the last 2 h of chamber exposure, because that is the time period during which we expected to see acclimatisation in ventilation after an initial hypoxic ventilatory decline. Regression analysis of the data from these 2 h of exposure indicated that a ventilatory acclimatisation had occurred, as evidenced by a significant positive correlation in ventilation over time of exposure to hypoxia that was not observed in normoxic exposures. Despite this significant result we question the reliability and accuracy of inductance plethysmography as a measure of ventilation in a freely moving individual, as explained below, and interpret these findings cautiously.
Before testing began, the chest and abdominal bands had their respective gains calibrated automatically by the measurement device, using the ratio of the variance in their individual signals (quantitative diagnostic calibration; Sackner et al. 1989). This calibration was performed while each subject sat upright in a rigid chair. However, after calibration, we permitted our subjects to move about freely in the chamber; they were also allowed to eat within the first 1.5 h of exposure and to drink water at any time throughout the exposure. When subjects moved, ate or drank, we observed that the ventilation measurements were much more variable than at rest, although with no appreciable change in the variability of end-tidal carbon dioxide. These intermittent movements, combined with the fact that our gain calibration was for the seated upright position, probably produced considerable variability and inaccuracies, despite our efforts to exclude them from the analysis. We were therefore cautious in interpreting the ventilatory data resulting from the exposure, and report only the uncalibrated ventilation data. Nevertheless, there appears to have been an increase in ventilation similar to that shown by others using similar hypoxic exposure protocols.
Rebreathing
The use and interpretation of the results of the modified rebreathing test has been discussed extensively in previous reports (Duffin et al. 2000; Mahamed & Duffin, 2001; Mahamed et al. 2001). The rebreathing test parameters are interpreted as measures of the following chemoreflex parameters. The first threshold is the chemoreflex threshold where ventilation begins to increase in response to the combined drives from both chemoreflexes. The second threshold is the patterning threshold where the pattern of the ventilatory response changes from one dominated by increasing tidal volume to one dominated by increasing respiratory frequency. The slopes are the chemoreflex sensitivities. By comparing the differences with hypoxic and hyperoxic isoxic levels, changes can be attributed to the central and peripheral chemoreflexes. The basal or subthreshold ventilation measures the non-chemoreflex drives to breathe.
The modified version of the rebreathing test has distinct advantages over other techniques. The two most important of these advantages are the measures of subthreshold ventilation and an observable carbon dioxide threshold. We have shown previously that subthreshold ventilation and carbon dioxide sensitivity are correlated, but neither of these is correlated with carbon dioxide threshold (Mahamed & Duffin, 2001). Therefore, by measuring both the carbon dioxide threshold and slope, two parameters that do not co-vary significantly, we are able to infer whether changes in activity or sensitivity of chemoreflexes have occurred. Changes in threshold are probably the result of changes in overall activity, while changes in sensitivity are probably due to changes in the efficacy of afferent signalling. Our data therefore suggest that a change in overall activity of the peripheral chemoreflex is responsible for the ventilatory acclimatisation to hypoxia.
Timing of tests
Circadian rhythms are known to have effects on the chemoreflex control of ventilation (Spengler et al. 1997, 2000; Stephenson et al. 2000). Based on the results of Stephenson et al. (2000), who also used a modified version of Read's rebreathing method, all the changes observed could be due to normal circadian influences during the span of the day of experiments. To preclude this possibility we performed an identical series of rebreathing tests on five of the nine subjects before and after an isocapnic normoxic isoxic exposure. We observed no trends in any chemoreflex parameter that would lead us to believe that circadian influences were culpable. We suggest that we were unable to see a circadian response in carbon dioxide threshold as large (approximately −1.5 mmHg) as that observed by Stephenson et al. (2000) over the same time period because our participants were not subjected to a constant routine protocol (Mills et al. 1978; Duffy & Dijk, 2002).
An additional timing issue is recovery of the hypoxic ventilatory response after hypoxic exposure. Easton et al. (1988) reported a near-complete recovery after 15 min of room air breathing, following a 20 min hypoxic exposure that produced a depression in ventilation. This recovery apparently differs from that of an augmenting adaptation produced by longer hypoxic exposures, because Tansley et al. (1998) showed that the ventilatory response to hypoxia was still elevated after 24 h following an isocapnic hypoxic exposure of 48 h. Our results show that there is little evidence of recovery 1 h after a 3 h exposure. We noted that of the nine subjects, six had a decrease in their chemoreflex threshold for an additional hour after exposure, while three recovered theirs to normal levels (see Fig. 4).
Chemoreflex alterations
Several previous investigators have studied the control of breathing in subjects during and after long bouts of hypoxia. Tansley et al. (1998), using an end-tidal forcing technique, found an increase in the sensitivity of the hyperoxic ventilatory response to carbon dioxide after 48 h of isocapnic hypoxia in 10 subjects, and also found progressive increases in the ventilatory response to isocapnic hypoxia during the 48 h exposure. Since similar changes in respiratory control were observed with both isocapnic and poikilocapnic exposures, they concluded that hypoxia alone, without respiratory alkalosis, was enough to produce the ventilatory changes associated with the acclimatisation to hypoxia. These findings of the Oxford laboratory (Tansley et al. 1998) were further confirmed for a shorter, 8 h exposure by Fatemian & Robbins (1998), and again in more detail shortly thereafter (Fatemian & Robbins, 2001).
Our findings differ in some respects, but agree in others. The increase in the hypoxic ventilatory response observed by the Oxford laboratory accords with our finding of a decreased threshold for the ventilatory response to carbon dioxide in hypoxic rebreathing tests with such a decrease producing an enhancement of the ventilatory response to isocapnic hypoxia. However, we observed no changes in the sensitivity to carbon dioxide in hyperoxic rebreathing tests; these would imply a change in the central chemoreflex. Instead, we found that the ventilatory acclimatisation to hypoxia is due solely to changes in the peripheral chemoreflex. This difference in findings could be due to methodology; the end-tidal forcing technique measures chemoreflex sensitivity over a fixed range of end-tidal partial pressures of carbon dioxide, so that changes in the threshold of the ventilatory response to carbon dioxide may also produce changes in the measured sensitivity as the threshold moves into and out of the range of carbon dioxide used for end-tidal forcing (Mohan et al. 1999). The difference may also be a result of the increased length of exposure; 48 and 8 h compared to 3 h in our experiments.
In contrast, our findings concur with those from a recent study utilising 2 h exposures to hypoxia (Garcia et al. 2001). In their study, Garcia et al. (2001) reported that early in the hypoxic exposure there was a rightward shift in the ventilatory response to isocapnic hypoxia (measured as ventilation vs. the percentage decrease in arterial oxygen saturation) that accounted for the observed decline in ventilation. This finding is in complete agreement with our previously published results (Mahamed & Duffin, 2001), which demonstrate that the decline in ventilation is due to an increased peripheral chemoreflex carbon dioxide threshold. Garcia et al. (2001) also found that after 2 h, the ventilatory response to isocapnic hypoxia had returned to normal, and suggested that it was due to the onset of ventilatory acclimatisation. We concur and suggest that if they continued for an additional hour, as we did, they would probably have noticed similar results to our own. In both of these previous studies (Garcia et al. 2001; Mahamed & Duffin, 2001), it was a parallel shift of the measured response that occurred; equivalent in the present and our previous study to the decrease in the threshold of the peripheral chemoreflex response to hypercapnia.
We found that the threshold decrease persisted for at least 1 h after hypoxic exposure. Tansley et al. (1998) have also reported persistent changes in respiratory control after 48 h of isocapnic hypoxic exposure. We therefore suggest that the continued hyperventilation upon relief of prolonged isocapnic hypoxic exposure (Tansley et al. 1997, 1998; Pedersen et al. 2000) is a result of an augmented contribution to breathing from the peripheral chemoreflex during normoxia. Although we did not measure post-exposure ventilation or end-tidal carbon dioxide, our observation of a small but non-significant decrease (≈2 %) in the carbon dioxide threshold measured in hyperoxic rebreathing tests supports this view.
To summarise, because we examined only the first 3 h of the ventilatory acclimatisation to hypoxia, we cannot dispute the findings obtained during longer exposures to hypoxia that both peripheral and central chemoreflex sensitivities are altered. However, our study does demonstrate that in its earliest stages, there is a decrease in the threshold of the peripheral chemoreflex response to carbon dioxide, which persists for at least 1 h after the return to normoxia. We suggest that ventilatory acclimatisation to hypoxia results from this decreased threshold, reflecting an increase in the activity of the peripheral chemoreflex.
Acknowledgments
The authors recognise the valuable technical assistance provided by Bradley Hansen of the University of Western Ontario. This research was jointly funded by the Natural Science and Engineering Research Council of Canada and the Ontario Thoracic Society.
REFERENCES
- Casey K, Duffin J, McAvoy GV. The effect of exercise on the central-chemoreceptor threshold in man. J Physiol. 1987;383:9–18. doi: 10.1113/jphysiol.1987.sp016392. [DOI] [PMC free article] [PubMed] [Google Scholar]
- Duffin J, McAvoy GV. The peripheral-chemoreceptor threshold to carbon dioxide in man. J Physiol. 1988;406:15–26. doi: 10.1113/jphysiol.1988.sp017365. [DOI] [PMC free article] [PubMed] [Google Scholar]
- Duffin J, Mohan RM, Vasiliou P, Stephenson R, Mahamed S. A model of the chemoreflex control of breathing in humans: model parameters measurement. Respir Physiol. 2000;120:13–26. doi: 10.1016/s0034-5687(00)00095-5. [DOI] [PubMed] [Google Scholar]
- Duffy JF, Dijk DJ. Getting through to circadian oscillators: why use constant routines? J Biol Rhythms. 2002;17:4–13. doi: 10.1177/074873002129002294. [DOI] [PubMed] [Google Scholar]
- Easton PA, Slykerman LJ, Anthonisen NR. Recovery of the ventilatory response to hypoxia in normal adults. J Appl Physiol. 1988;64:521–528. doi: 10.1152/jappl.1988.64.2.521. [DOI] [PubMed] [Google Scholar]
- Easton PA, Slykerman LJ, Anthonisen NR. Ventilatory response to sustained hypoxia in normal adults. J Appl Physiol. 1986;61:906–911. doi: 10.1152/jappl.1986.61.3.906. [DOI] [PubMed] [Google Scholar]
- Fatemian M, Robbins PA. Human ventilatory response to CO2 after 8 h of isocapnic or poikilocapnic hypoxia. J Appl Physiol. 1998;85:1922–1928. doi: 10.1152/jappl.1998.85.5.1922. [DOI] [PubMed] [Google Scholar]
- Fatemian M, Robbins PA. Selected contribution: chemoreflex responses to CO2 before and after an 8 h exposure to hypoxia in humans. J Appl Physiol. 2001;90:1607–1614. doi: 10.1152/jappl.2001.90.4.1607. [DOI] [PubMed] [Google Scholar]
- Forster HV, Dempsey JA, Birnbaum ML, Reddan WG, Thoden J, Grover RF, Rankin J. Effect of chronic exposure to hypoxia on ventilatory response to CO2 and hypoxia. J Appl Physiol. 1971;31:586–592. doi: 10.1152/jappl.1971.31.4.586. [DOI] [PubMed] [Google Scholar]
- Garcia N, Hopkins SR, Elliott AR, Aaron E, Weinger MB, Powell FL. Ventilatory response to 2 h sustained hypoxia in humans. Respir Physiol. 2001;124:11–22. doi: 10.1016/s0034-5687(00)00183-3. [DOI] [PubMed] [Google Scholar]
- Honda Y. Respiratory and circulatory activities in carotid body-resected humans. J Appl Physiol. 1992;73:1–8. doi: 10.1152/jappl.1992.73.1.1. [DOI] [PubMed] [Google Scholar]
- Howard LS, Barson RA, Howse BP, McGill TR, McIntyre ME, O'Connor DF, Robbins PA. Chamber for controlling end-tidal gas tensions over sustained periods in humans. J Appl Physiol. 1995;78:1088–1091. doi: 10.1152/jappl.1995.78.3.1088. [DOI] [PubMed] [Google Scholar]
- Howard LS, Robbins PA. Ventilatory response to 8 h of isocapnic and poikilocapnic hypoxia in humans. J Appl Physiol. 1995;78:1092–1097. doi: 10.1152/jappl.1995.78.3.1092. [DOI] [PubMed] [Google Scholar]
- Mahamed S, Ali AF, Ho D, Wang B, Duffin J. The contribution of chemoreflex drives to resting breathing in man. Exp Physiol. 2001;86:109–116. doi: 10.1113/eph8602090. [DOI] [PubMed] [Google Scholar]
- Mahamed S, Duffin J. Repeated hypoxic exposures change respiratory chemoreflex control in humans. J Physiol. 2001;534:595–603. doi: 10.1111/j.1469-7793.2001.00595.x. [DOI] [PMC free article] [PubMed] [Google Scholar]
- Mills JN, Minors DS, Waterhouse JM. Adaptation to abrupt time shifts of the oscillator(s) controlling human circadian rhythms. J Physiol. 1978;285:455–470. doi: 10.1113/jphysiol.1978.sp012582. [DOI] [PMC free article] [PubMed] [Google Scholar]
- Mohan R, Duffin J. The effect of hypoxia on the ventilatory response to carbon dioxide in man. Respir Physiol. 1997;108:101–115. doi: 10.1016/s0034-5687(97)00024-8. [DOI] [PubMed] [Google Scholar]
- Mohan RM, Amara CE, Cunningham MDA, Duffin NJ. Measuring the central-chemoreflex sensitivity in man: rebreathing and steady-state methods compared. Respir Physiol. 1999;115:23–33. doi: 10.1016/s0034-5687(99)00003-1. [DOI] [PubMed] [Google Scholar]
- Pedersen ME, Robach P, Richalet JP, Robbins PA. Peripheral chemoreflex function in hyperoxia following ventilatory acclimatization to altitude. J Appl Physiol. 2000;89:291–296. doi: 10.1152/jappl.2000.89.1.291. [DOI] [PubMed] [Google Scholar]
- Rapanos T, Duffin J. The ventilatory response to hypoxia below the carbon dioxide threshold. Can J Appl Physiol. 1997;22:23–36. doi: 10.1139/h97-003. [DOI] [PubMed] [Google Scholar]
- Read DJC. A clinical method for assessing the ventilatory response to CO2. Australas Ann Med. 1967;16:20–32. doi: 10.1111/imj.1967.16.1.20. [DOI] [PubMed] [Google Scholar]
- Ren X, Fatemian M, Robbins PA. Changes in respiratory control in humans induced by 8 h of hyperoxia. J Appl Physiol. 2000;89:655–662. doi: 10.1152/jappl.2000.89.2.655. [DOI] [PubMed] [Google Scholar]
- Sackner MA, Watson H, Belsito AS, Feinerman D, Suarez M, Gonzalez G, Bizousky F, Krieger B. Calibration of respiratory inductive plethysmograph during natural breathing. J Appl Physiol. 1989;66:410–420. doi: 10.1152/jappl.1989.66.1.410. [DOI] [PubMed] [Google Scholar]
- Sato M, Severinghaus JW, Powell FL, Xu FD, Spellman MJ., Jr Augmented hypoxic ventilatory response in men at altitude. J Appl Physiol. 1992;73:101–107. doi: 10.1152/jappl.1992.73.1.101. [DOI] [PubMed] [Google Scholar]
- Spengler CM, Czeisler CA, Shea SA. An endogenous circadian rhythm of respiratory control in humans. J Physiol. 2000;526:683–694. doi: 10.1111/j.1469-7793.2000.00683.x. [DOI] [PMC free article] [PubMed] [Google Scholar]
- Spengler CM, Oliver H, Czeisler CA, Shea SA. American Thoracic Society. San Francisco, California: Am J Respir Crit Care Med; 1997. Effects of circadian rhythms and sleep deprivation upon metabolism and respiratory control in humans; p. p.A777. [Google Scholar]
- Stephenson R, Mohan RM, Duffin J, Jarsky TM. Circadian rhythms in the chemoreflex control of breathing. Am J Physiol Regul Integr Comp Physiol. 2000;278:R282–286. doi: 10.1152/ajpregu.2000.278.1.R282. [DOI] [PubMed] [Google Scholar]
- Swanson GD, Bellville JW. Step changes in end-tidal CO2: methods and implications. J Appl Physiol. 1975;39:377–385. doi: 10.1152/jappl.1975.39.3.377. [DOI] [PubMed] [Google Scholar]
- Tansley JG, Clar C, Pedersen ME, Robbins PA. Human ventilatory response to acute hyperoxia during and after 8 h of both isocapnic and poikilocapnic hypoxia. J Appl Physiol. 1997;82:513–519. doi: 10.1152/jappl.1997.82.2.513. [DOI] [PubMed] [Google Scholar]
- Tansley JG, Fatemian M, Howard LS, Poulin MJ, Robbins PA. Changes in respiratory control during and after 48 h of isocapnic and poikilocapnic hypoxia in humans. J Appl Physiol. 1998;85:2125–2134. doi: 10.1152/jappl.1998.85.6.2125. [DOI] [PubMed] [Google Scholar]