

Abstract
Fetal pancreatic adaptations to relative hypoglycaemia, a characteristic of intra-uterine growth restriction, may limit pancreatic β-cell capacity to produce and/or secrete insulin. The objective of this study was to measure β-cell responsiveness in hypoglycaemic (H) fetal sheep and ascertain whether a 5 day euglycaemic recovery period would restore insulin secretion capacity. Glucose-stimulated insulin secretion (GSIS) was measured in euglycaemic (E) control fetuses, fetuses made hypoglycaemic for 14 days, and in a subset of 14-day hypoglycaemic fetuses returned to euglycaemia for 5 days (R fetuses). Hypoglycaemia significantly decreased plasma insulin concentrations in H (0.13 ± 0.01 ng ml−1) and R fetuses (0.11 ± 0.01 ng ml−1); insulin concentrations returned to euglycaemic control values (0.30 ± 0.01 ng ml−1) in R fetuses (0.29 ± 0.04 ng ml−1) during their euglycaemic recovery period. Mean steady-state plasma insulin concentration during the GSIS study was reduced in H fetuses (0.40 ± 0.07 vs. 0.92 ± 0.10 ng ml−1 in E), but increased (P < 0.05) in R fetuses (0.73 ± 0.10 ng ml−1) to concentrations not different from those in the E group. Nonlinear modelling of GSIS showed that response time was greater (P < 0.01) in both H (15.6 ± 2.8 min) and R (15.4 ± 1.5 min) than in E fetuses (6.3 ± 1.1 min). In addition, insulin secretion responsiveness to arginine was reduced by hypoglycaemia (0.98 ± 0.11 ng ml−1 in H vs. 1.82 ± 0.17 ng ml−1 in E, P < 0.05) and did not recover (1.21 ± 0.15 ng ml−1 in R, P < 0.05vs. E). Thus, a 5 day euglycaemic recovery period from chronic hypoglycaemia reestablished GSIS to normal levels, but there was a persistent reduction of β-cell responsiveness to glucose and arginine. We conclude that programming of pancreatic insulin secretion responsiveness can occur in response to fetal glucose deprivation, indicating a possible mechanism for establishing, in fetal life, a predisposition to type 2 diabetes.
Environmental influences can augment or diminish fetal growth rates and evidence indicates that fetal organ development and function are permanently altered as a result (Barker, 1998). An important environmental factor for fetal growth is nutrient availability. Glucose is a primary nutrient in fetal life, along with amino acids, lipids and oxygen. The amount of glucose supplied to the fetus accentuates fetal growth, and fetal glucose concentrations are directly correlated with birth weights for humans (Nicolini et al. 1990; Nieto-Diaz et al. 1996). Intra-uterine growth restriction (IUGR) is a frequent complication of human pregnancy and glucose concentrations are reduced in growth-restricted fetuses (Shelley & Neligan, 1966; Nicolini et al. 1990). In fetal sheep, chronic glucose deficiency and hypoglycaemia also restrict fetal growth (DiGiacomo & Hay, 1990; Carver & Hay, 1995). Such conditions can be used experimentally to provide a model of IUGR that results from deficiency of a single nutrient, unlike other models of IUGR, which include deficiencies of a variety of nutrient substrates (oxygen, glucose, amino acids and lipids) from decreased placental nutrient transport.
Increased fetal plasma glucose concentrations in humans, rodents and sheep elicit insulin secretion from the fetal pancreas (Kervran & Girard, 1974; Philipps et al. 1978; Nicolini et al. 1990). Glucose-stimulated insulin secretion (GSIS) of fetal rat islets increases progressively during the final 20 % of gestation (Kervran & Randon, 1980). Similarly, in fetal sheep, the pancreatic responsiveness to glucose increases almost fourfold over the last half of gestation (Aldoretta et al. 1998). In vivo responsiveness of the ovine fetal pancreas correlates very closely with the presence of islet structures and increasing pancreas insulin content during the final third of gestation (Willes et al. 1969; Reddy et al. 1988). These developmental changes resemble human pancreatic development during the last trimester (Falin, 1967; Hellerstrom et al. 1992).
Nutritional deprivation during the final stages of fetal pancreatic development produces detrimental effects on β-cell responsiveness in human and sheep fetuses (Nicolini et al. 1990; Carver et al. 1996). In human pregnancies complicated by IUGR, fetal insulin immunoreactive endocrine cells are decreased and the endocrine mass of the pancreas is reduced (Van Assche et al. 1977). Therefore, fetal nutrient deprivation influences pancreatic function and potentially limits endocrine cell development, which may limit its function during postnatal life.
Epidemiological studies indicate that suboptimal fetal growth, particularly evident in small-for-gestational-aged infants at birth (< 2500 g) and infants with IUGR, develop in utero programming of organs, tissues, cells and/or metabolic axes that lead to adult onset of metabolic and cardiovascular disorders (for review see Barker, 1998). The endocrine pancreas may be a critical tissue that is subject to in utero programming events, because of its roles in nutrient sensing, nutrient concentration regulation and secretion of insulin, an anabolic hormone important for fetal growth (Hales et al. 1991; Barker et al. 1993; Fowden & Hill, 2001). Evidence for this stems from infants who were thin at birth and develop an increased prevalence of impaired glucose tolerance as early as childhood (Phillips et al. 1994; Yajnik et al. 1995; Fall et al. 1998). Rodent models of IUGR have been used to examine the development of the pancreas and also determine transgenerational persistence of altered development (reviewed by Fowden & Hill, 2001). Rodent studies implicate discrete developmental periods for adverse effects of nutritional deprivation on pancreatic development. However, in humans and sheep, less discrete periods of development might result in graded pancreatic aberrations and be specific for the type of insult. Such less discrete periods of development also might enhance the ability to counteract insufficient fetal nutrition.
Chronic hypoglycaemia has been shown to reduce the insulin response in fetal sheep stimulated with glucose. However, insulin secretion responsiveness after a hypoglycaemic insult and the ability of the fetal islets to recover from such a condition has not been addressed. The present study was designed to examine reduced fetal pancreatic insulin secretion responsiveness in fetal sheep made chronically hypoglycaemic by a maternal insulin infusion during the final 20 % of gestation. After we determined reduced insulin secretion responsiveness from hypoglycaemia, we then determined the ability to restore pancreatic function in utero with a 5 day euglycaemic recovery period. Insulin secretion responsiveness and magnitude were measured in euglycaemic and hypoglycaemic fetuses and in hypoglycaemic fetuses that were allowed to recover to euglycaemia. The results demonstrate decreased pancreatic insulin secretion responsiveness following chronic (14 day) hypoglycaemia, which was not fully corrected despite normalization of glucose concentration for 5 days.
METHODS
Animal preparation
Studies were conducted in pregnant Columbia-Rambouillet ewes from Nebekar Ranch, Santa Monica, CA, USA or Southdown ewes from Ovis, Canton, SD, USA during the final 20 % of gestation (term of 147 days post coitus; d.p.c.). Indwelling catheters were surgically placed into the ewe and fetus at 115–120 d.p.c. Ewes were anaesthetized with an intravenous bolus administration of ketamine (4.4 mg kg−1; Fort Dodge Animal Health, Fort Dodge, IA, USA) and diazepam (0.11 mg kg−1; Abbott Laboratories, North Chicago, IL, USA) and maintained under general anaesthesia (1.5 % isoflurane in O2; Abbott Laboratories). A maternal arterial sampling catheter was placed in a femoral artery and two maternal infusion catheters were placed in a femoral vein, all via a single left groin incision. The uterus was exposed by a midline laparotomy and fetal limbs were extracted through a 5 cm incision in the uterus. Fetal sampling catheters were placed in the abdominal aorta via hindlimb pedal arteries and infusion catheters were placed in femoral veins via the saphenous veins. Incisions were closed with silk sutures (Ethicon, Sommerville, NJ, USA), and all catheters were subcutaneously tunnelled to the ewe's flank and kept in a plastic pouch. A single dose of procaine penicillin G (600 000 U, i.m.; Vedco, St Joseph, MO, USA) was given to the ewe and postoperative analgesic (buprenorphine, 0.01 mg kg−1; Reckitt & Colman Pharmaceuticals Inc., Richmond, VA, USA) was administered at 8–12 h intervals for 72 h. Animals were maintained as previously described (Carver et al. 1996). All animal procedures were in compliance with guidelines of the United States Department of Agriculture, the National Institutes of Health, and the American Association for the Accreditation of Laboratory Animal Care. The animal care and use protocols were approved by the University of Colorado Health Sciences Center (UCHSC) Institutional Animal Care and Use Committee.
Experimental design
Animals were randomly placed into one of three treatment groups: euglycaemic (E) animals, hypoglycaemic (H) animals, and hypoglycaemic-recovery (R) animals (Fig. 1). The E ewes were maintained for the same duration as the H and R ewes but received a chronic infusion of 5 % bovine serum albumin (BSA; Sigma Chemicals, St Louis, MO, USA) in saline (0.9 % NaCl; Abbott Laboratories). The H ewes received a chronic intravenous insulin infusion (30–60 pmol min−1 kg−1; Humulin R, Eli Lilly and Co., Indianapolis, IN, USA) in 5 % BSA-saline targeted to produce a 50 % reduction in maternal plasma glucose (from 60–70 to 30–35 mg dl−1). A GSIS study was performed on the fetus after 12–15 days of treatment (Fig. 1). Following the GSIS study, R animals were returned to normal glucose concentrations for a period of 5 days by reducing the maternal insulin infusion to achieve euglycaemia. A second GSIS study was performed on these fetuses.
Figure 1. Schematic study time line for each treatment group.
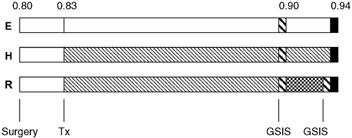
Treatment groups (E, H and R fetuses) are indicated to the left of the bar representing the periods of study with the fraction of term gestation along the top. Postoperative recovery period (□) and experimental treatment (Tx) period (□ for E and  for H) are shown following surgery. After 14 days of hypoglycaemia, the glucose-stimulated insulin secretion (GSIS) study was performed (
 ). The R fetuses were returned to euglycaemia (
 ) and a second GSIS study was performed. All animals were killed for post-mortem evaluation at the same approximate fraction of term gestation, between 135 and 142 days of gestation (▪).
GSIS study
A square-wave hyperglycaemic clamp was used to determine insulin secretion in response to glucose as previously reported (Carver et al. 1996). Briefly, a continuous transfusion of maternal blood into the fetus (8 ml h−1) was started 30 min before baseline sampling to compensate for blood collection throughout the study. At 30, 45 and 60 min, fetal baseline samples were collected in syringes lined with EDTA (Sigma) for plasma glucose and insulin concentrations and in dried heparin (Elkins-Sinn, Inc., Cherry Hill, NJ, USA)-lined syringes for blood gas and oxygen saturation determinations. A 110 mg kg−1 glucose bolus was given to the fetus at 60 min and followed immediately by a continuous infusion of 25 % dextrose (10–13 mg kg−1 min−1; Abbott Laboratories); the infusion rate was varied to maintain an increased (+20 mg dl−1) fetal glucose concentration. After initiating the hyperglycaemic clamp, fetal arterial plasma samples were collected every 5 min during the first 30 min of hyperglycaemia and then at 45, 60, 90 and 120 min after glucose infusion for a study duration of 3 h. During the final hour of the hyperglycaemic clamp, blood was also collected for blood gas and oxygen saturation determinations. During the basal (30–60 min) and steady-state hyperglycaemic clamp (90–120 min) periods, fetal blood was collected in a final concentration of 0.5 mm EDTA and 0.33 mm reduced glutathione for catecholamine concentration measurements. Following the 120 min hyperglycaemic sample, a bolus of arginine (5 mmol kg−1 estimated fetal weight) was injected (4 min) into the fetal circulation and plasma samples were collected at 5, 10, 20 and 30 min for subsequent measurement of insulin concentrations.
Post-mortem examination
After completion of physiological studies, fetal tissues were collected under treatment conditions (euglycaemic, hypoglycaemic or hypoglycaemic-recovery) by anaesthetizing the ewe and fetus with ketamine (4.4 mg kg−1) and diazepam (0.11 mg kg−1). After a hysterectomy, the ewe was killed with concentrated sodium pentobarbitone (10 ml; Sleepaway, Fort Dodge Animal Health) given intravenously. The fetus was removed, weighed and dissected for organ weights.
Biochemical analysis
Blood oxygen saturation and haemoglobin concentrations were measured with an OSM III haemoximeter (Radiometer, Copenhagen, Denmark). Oxygen content was determined as the product of oxygen saturation and oxygen capacity. The pH, PO2 and haematocrit were determined at 39.2 °C (mean core body temperature in the laboratory; Regnault et al. 1999) using an ABL 500 blood gas analyser (Radiometer).
Whole blood collected in EDTA-coated syringes was centrifuged (14 000 g) for 3 min at 4 °C. Plasma was aspirated from the pelleted red blood cells and stored at −70 °C for hormone and amino acid measurements. Plasma glucose and lactate concentrations were measured immediately using a YSI model 2700 select biochemistry analyser (Yellow Springs Instruments, Yellow Springs, OH, USA). The arterial concentrations of amino acids were measured using a Dionex 300 model 4500 amino acid analyser (Dionex, Sunnyvale, CA, USA) after deproteinization with sulphosalicyclic acid.
Plasma insulin concentrations were measured by an ovine insulin ELISA (Alpco, Windham, NH, USA). Other hormones measured in basal and hyperglycaemic samples included glucagon, with a glucagon radioimmunoassay (Linco Research Inc., St Charles, MI, USA), and catecholamines by HPLC using Dionex methodology.
Statistical analysis
Insulin secretion during the GSIS studies was fitted to a sigmoid curve to estimate insulin concentration (Insulinijk):
where Ci is the basal mean insulin concentration, Di is the maximal mean insulin concentration, Ri is the rate of insulin accumulation, timeijk is the study time (min) and Hi is the time at which the insulin levels are at half-maximal. Fitting was carried out with a nonlinear mixed effects model and differences were determined between treatment groups (SAS Proc NLMIXED; SAS Institute Inc., 1999). The variability between animals and repeated measures for each animal was accounted for in the model.
Statistical analysis of differences for arginine-stimulated insulin secretion for a treatment group consisted of an analysis of variance (ANOVA) that accounted for sample time and animal variation (Proc MIXED; SAS Institute Inc., 1999). Biochemical, haematologic and hormone measurements were analysed by general linear means ANOVA and means were separated by least square means. Differences between basal and hyperglycaemic periods were analysed with Students t test, and Tukey's test for multiple comparisons was used to determine differences between treatment groups (SAS Institute Inc., 1999).
RESULTS
Experimental treatment
The hypoglycaemic treatment reduced maternal arterial plasma glucose concentrations by approximately 50 % and fetal arterial plasma glucose concentrations by 45–55 % (Fig. 2A). The mean (± s.e.m.) plasma glucose concentration was 22.2 ± 0.2 mg dl−1 in euglycaemic (E) fetuses, 10.8 ± 0.4 mg dl−1 in hypoglycaemic (H) fetuses and 11.0 ± 0.3 mg dl−1 in hypoglycaemic-recovery (R) fetuses during their hypoglycaemic treatment (P < 0.01; E vs. H or R). The mean fetal plasma glucose concentration in R fetuses during the euglycaemic recovery period was 21.7 ± 0.8 mg dl−1, not different from the mean plasma glucose concentration in E fetuses.
Figure 2. Glucose and insulin concentrations for treatment period.
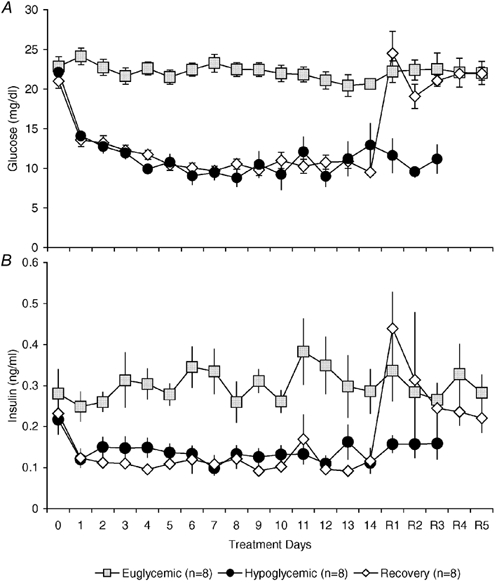
Daily fetal glucose (A) and insulin concentrations (B) for euglycaemic, hypoglycaemic and hypoglycaemic-recovery fetuses during treatment. Values are means ± s.e.m..
Fetal plasma insulin concentrations decreased in parallel with fetal plasma glucose concentrations (Fig. 2B). The mean (± s.e.m.) plasma insulin concentration was 0.30 ± 0.01 ng ml−1 in E fetuses, 0.13 ± 0.01 ng ml−1 in H fetuses, and 0.11 ± 0.01 ng ml−1 in R fetuses during their hypoglycaemic treatment (P < 0.05 E vs. H or R). In R fetuses during the euglycaemic recovery period, the mean fetal plasma insulin concentration increased significantly to 0.29 ± 0.04 ng ml−1, not different from the mean value in E fetuses.
Glucose-stimulated insulin secretion
Fetal GSIS was determined with a square-wave hyperglycaemic clamp that increased fetal plasma glucose concentrations by ≈20 mg dl−1 or about twice the normal fetal glucose concentration. Eight E fetuses were studied at a mean gestational age of 134 d.p.c. with gestational ages ranging from 130 to 138 d.p.c. Two GSIS studies were performed on three E fetuses at 132–133 d.p.c. and then again 5 days later at 137–138 d.p.c. There was no difference in plateau insulin secretion between these two studies, which was 0.70 ± 0.04 ng ml−1 at 132–133 d.p.c. and 0.72 ± 0.06 ng ml−1 at 137–138 d.p.c. Fetal gestational age at GSIS determination was similar for all treatment groups.
The mean plasma insulin concentration in E fetuses during the basal period was 0.35 ± 0.04 ng ml−1 and reached a maximum concentration of 0.92 ± 0.10 ng ml−1 during the hyperglycaemic sampling period (Fig. 3 and Table 1). Basal and maximal mean plasma insulin concentrations for H fetuses were lower (P < 0.01) than in the respective GSIS period in E fetuses, with a basal concentration of 0.09 ± 0.03 ng ml−1 and plateau concentration of 0.40 ± 0.07 ng ml−1. The increase in fetal plasma glucose concentration during the hyperglycaemic clamp was slightly greater (P < 0.05) in H fetuses (23.3 ± 1.1 mg dl−1) than E fetuses (20.4 ± 1.0 mg dl−1). The increase in insulin concentration was significantly lower (P < 0.05) in H fetuses, 0.31 ± 0.06 ng ml−1, compared to E fetuses, 0.56 ± 0.07 ng ml−1.
Figure 3. Glucose-stimulated insulin secretion.
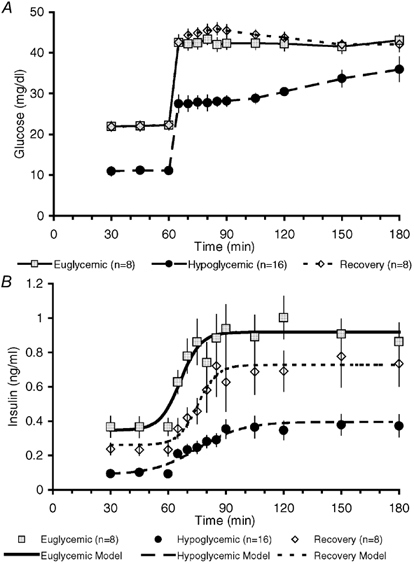
Fetal plasma glucose (A) and insulin concentrations (B) during the 3 h GSIS study. Nonlinear modelling of insulin secretion is represented with a different style of line for each treatment group. The increment in glucose concentration (A) was not different among the three groups. Statistical differences are presented in the Results section.
Table 1.
Measurements during the GSIS study
| Euglycaemic fetuses | Hypoglycaemic fetuses | Recovery fetuses | ||||
|---|---|---|---|---|---|---|
| Period 1 | Period 2 | Period 1 | Period 2 | Period 1 | Period 2 | |
| Glucose (mgdl−1) | 22.4 ± 1.2 | 42.8 ± 1.6* | 10.4 ± 0.5† | 33.7 ± 1.2*† | 21.9 ± 0.5 | 42.3 ± 1.0* |
| Lactate(mM) | 1.58 ± 0.08 | 2.01 ± 0.16* | 1.23 ± 0.09† | 1.96 ± 0.11* | 1.85 ± 0.70 | 2.27 ± 0.73 |
| Insulin(ng ml−1) | 0.35 ± 0.04 | 0.92 ± 0.1* | 0.09 ± 0.03† | 0.40 ± 0.07*† | 0.26 ± 0.04‡ | 0.73 ± 0.10*‡ |
| Glucagon (pg ml−1) | 59.0 ± 8.3 | 67.9 ± 7.3 | 61.2 ± 5.7 | 54.9 ± 5.9 | 56.4 ± 7.1 | 56.0 ± 7.4 |
| I/G(ngmg−1) | 1.76 ± 0.22 | 2.33 ± 0.27 | 0.91 ± 0.08† | 1.32 ± 0.22*† | 1.08 ± 0.18† | 1.76 ± 0.31 |
Differences (P < 0.05) between basal and hyperglycaemic period within treatment.
Differences (P < 0.05) between euglycaemic treatment for same GSIS period.
Differences (P < 0.05) between treatment groups compared to E fetuses for the same GSIS period.
To ensure that the decrease in maximal insulin secretion in H fetuses was not a result of their lower absolute plasma glucose concentration at the start of the hyperglycaemic clamp, GSIS studies were performed to examine higher hyperglycaemic concentrations. In four H fetuses, plasma glucose concentrations were increased by ≈30 mg dl−1 to 39.4 ± 1.9 mg dl−1, equivalent to the mean glucose concentration achieved during the hyperglycaemic clamp in E fetuses (42.8 ± 1.6 mg dl−1). No additional augmentation of the increase in fetal plasma insulin concentration was found in these H fetuses during the hyperglycaemic period (0.18 ± 0.09 vs. 0.31 ± 0.06 ng ml−1 with the 23.3 ± 1.1 mg dl−1 glucose concentration increase). The mean plateau in plasma insulin concentration (0.30 ± 0.11 ng ml−1) was significantly less (P < 0.05) than that in E fetuses (0.92 ± 0.06 ng ml−1).
Modelling of insulin secretion indicated that the ability of the fetal pancreas to respond to glucose was blunted in H fetuses. The mean (± s.e.m.) half-time estimate to reach maximal plasma insulin concentration (Hi) during the hyperglycaemic clamp was increased (P < 0.01) in H fetuses (15.6 ± 2.8 min) compared to E fetuses (6.3 ± 1.1 min). In addition, the rate of increase in insulin concentration (Ri), estimated at the half-time to reach maximal plateau insulin concentration, was reduced (P < 0.05) in H (-11.7 ± 2.7, derivative 0.007 ± 0.002 ng ml−1 min−1) compared to E fetuses (-5.3 ± 1.2, 0.027 ± 0.007 ng ml−1 min−1; Fig. 3). Acute insulin secretion for H fetuses was estimated at the same time (6.3 min) as for E fetuses and was less (P < 0.01), being 0.006 ± 0.001 ng ml−1 min−1 (Fig. 4).
Figure 4. Acute insulin secretion.
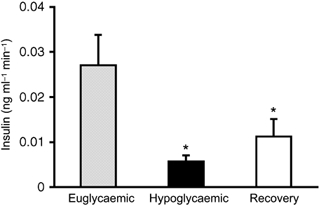
Acute insulin secretion was examined at the estimated half-time response for E fetuses, 6.3 min following glucose stimulation. The rate of change of plasma insulin concentration (ng ml−1 min−1) at this time point was significantly decreased in H (P < 0.01) and R fetuses (P = 0.05) from E fetuses at this early period, but H and R fetuses were not different from each other.
To test whether restoration of normal plasma glucose concentrations in chronically hypoglycaemic fetuses could restore pancreatic insulin secretion in response to acute hyperglycaemia, we examined pancreatic responsiveness in fetuses that were returned to euglycaemia for 5 days. The mean plasma insulin concentration during the basal period of the GSIS study was 0.26 ± 0.04 ng ml−1 and increased to a maximum mean plateau concentration of 0.73 ± 0.10 ng ml−1 (Fig. 3 and Table 1). These mean plasma insulin concentrations were not different from those observed in E fetuses during the respective period of the GSIS study. Basal and maximal plasma insulin concentrations in R fetuses were greater (P < 0.05) than the plasma insulin concentrations in H fetuses during the same period of GSIS. Glucose-stimulated insulin secretion in R fetuses remained blunted; the half-time estimate (Hi) after onset of hyperglycaemia between basal and maximum insulin concentration (15.4 ± 1.5 min) was greater (P < 0.01) than that of E fetuses (6.3 ± 1.1 min). The half-time estimate for insulin response in R fetuses was not different from that of H fetuses. However, the rate of increase in insulin concentration at the half-time estimate was increased (Ri = −5.0 ± 1.0, derivative 0.023 ± 0.006 ng ml−1 min−1; P < 0.05) from that of H fetuses and not different from E fetuses. Acute insulin secretion, determined by the rate of insulin change at the half-time in E fetuses (6.3 min), was reduced (0.011 ± 0.004 ng ml−1 min−1; P = 0.05) compared with E fetuses (0.027 ± 0.007 ng ml−1 min−1) and not different from H fetuses (0.006 ± 0.001 ng ml−1 min−1; Fig. 4).
The mean plasma insulin-to-glucose concentration (I/G) ratio during the basal and hyperglycaemic period of the GSIS study was reduced (P < 0.05) in H fetuses (Table 1). The I/G ratio for R fetuses also was lower (P < 0.05) than in E fetuses during the basal period of the GSIS study following the 5 day euglycaemic correction, but was not reduced during the hyperglycaemic period.
Arginine stimulation of insulin secretion
Insulin concentration following the arginine bolus reached maximum values after 5 min in all treatment groups (Fig. 5). Insulin secretion in response to arginine was significantly reduced from the mean plasma concentration of 1.82 ± 0.18 ng ml−1 in E fetuses to 0.98 ± 0.11 ng ml−1 in H (P < 0.05) and 1.21 ± 0.15 ng ml−1 (P < 0.05) in R fetuses. There was no significant difference in insulin responsiveness to arginine between H and R fetuses after 5 days of euglycaemic recovery.
Figure 5. Arginine-stimulated insulin secretion.
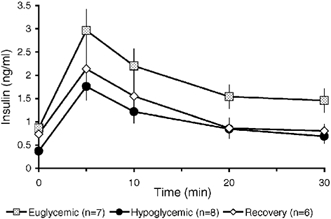
Arginine-stimulated insulin secretion was significantly reduced in both hypoglycaemic and euglycaemic-recovered fetuses compared to control, euglycaemic fetuses.
Haematological values
Haematological variables during the GSIS study are shown in Table 2. Values of pH, oxygen saturation, PO2 and O2 content tended to decrease during the hyperglycaemic clamps in all three treatment groups.
Table 2.
Haematological data for the GSIS
| Euglycaemic fetuses | Hypoglycaemic fetuses | Recovery fetuses | ||||
|---|---|---|---|---|---|---|
| Period 1 | Period 2 | Period 1 | Period 2 | Period 1 | Period 2 | |
| pH | 7.35 ± 0.01 | 7.33 ± 0.01* | 7.36 ± 0.01 | 7.32 ± 0.01 | 7.36 ± 0.01 | 7.34 ± 0.01 |
| O2 Saturation (%) | 53.1 ± 2.4 | 47.3 ± 2.9* | 65.6 ± 1.8† | 60.6 ± 1.8† | 51.5 ± 2.4 | 49.1 ± 2.1 |
| PO2(mmHg) | 21.7 ± 0.8 | 20.3 ± 0.8* | 22.2 ± 1.0 | 21.1 ± 1.0 | 20.3 ± 0.9 | 20.3 ± 0.8 |
| O2(mM) | 3.5 ± 0.2 | 3.1 ± 0.2* | 3.6 ± 0.2 | 3.3 ± 0.2 | 2.7 ± 0.1† | 2.6 ± 0.1† |
| Haematocrit (%) | 34.1 ± 0.5 | 34.1 ± 0.6 | 29.2 ± l.0† | 29.4 ± 0.9 † | 30.4 ± 4 1.1† | 30.5 ± 1.1† |
Differences (P < 0.05) between basal and hyperglycaemic period within treatment.
Differences (P < 0.05) between treatment groups compared to E fetuses for same GSIS period.
Additional treatment parameters
No differences in plasma glucagon concentrations were observed among the three treatment groups or during the GSIS study periods (Table 1). The concentrations of catecholamines, adrenaline and noradrenaline, were determined during GSIS periods and no differences were found in response to the acute hyperglycaemia in the GSIS study. However, an increase (P < 0.05) in plasma noradrenaline was observed in R fetuses (437 ± 55 pg ml−1) compared with E fetuses (269 ± 37 pg ml−1) and H fetuses (262 ± 25 pg ml−1).
Arterial plasma concentrations of six amino acids were increased (P < 0.05) in H fetuses (Table 3). Plasma glutamate concentrations in H fetuses decreased (P < 0.05) from those in E fetuses (Table 3). After euglycaemic recovery, the plasma concentrations of lysine and ornithine were reduced (P < 0.05) compared with E fetuses.
Table 3.
Fetal arterial plasma amino acid concentration
| Ammo acid (μm) | Euglycaemic | Hypoglycaemic | Recovery |
|---|---|---|---|
| Citrulline | 175.3 ± 35.6 | 267.6 ± 19.6* | 189.9 ± 26.0 |
| Cysteine | 7.2 ± 1.3 | 15.1 ± 2.2* | 6.7 ± 0.9 |
| Glutamate | 35.3 ± 5.8 | 16.7 ± 1.5* | 33.7 ± 4.5 |
| Lysine | 90.1 ± 12.5 | 124.6 ± 11.9* | 52.6 ± 6.03* |
| Ornithine | 80.9 ± 8.1 | 104.6 ± 17.8 | 57.7 ± 9.6* |
| Proline | 138.9 ± 16.3 | 199.2 ± 15.6* | 118.4 ± 12.4 |
| Taurine | 46.6 ± 13.1 | 225.5 ± 44.2* | 75.3 ± 14.1 |
| Threonine | 263.9 ± 72.3 | 417.9 ± 37.8* | 397.3 ± 53.6 |
Differences (P < 0.05) between means ± S.E.M. for treatment groups compared to E fetuses.
Post-mortem analysis
Following the final GSIS studies, the fetuses were returned to their previous treatment conditions and then killed and examined post-mortem (Table 4) between 135 and 142 d.p.c. The ratio of males to females was equivalent for each group. Significant reductions (P < 0.05) in fetal weight (18.8 %), crown-rump length, ponderal index and liver weight were seen in H fetuses, but there was no difference in brain weight from E fetuses. The 5 day recovery period was able to reestablish fetal weight, crown-rump length, ponderal index and liver weight in R fetuses, but the mean brain weight was increased by 11.8 % (P < 0.05) above that of E fetuses. There was no difference in placental weight among the treatment groups.
Table 4.
Post-mortem data
| Eudycaemic animals | Hypodycaemic animals | Recovery animals | |
|---|---|---|---|
| Gestationalage(d.p.c.) | 138.4 ± 0.6 | 139.3 ± 1.6 | 138.8 ± 0.6 |
| Sex ratio (% males) | 33 | 33 | 38 |
| Fetal weight (kg) | 3.94 ± 0.14 | 3.20 ± 0.17* | 3.98 ± 0.15 |
| Crown rump length (cm) | 52.5 ± 2.0 | 43.2 ± 2.2* | 54.2 ± 1.2 |
| Ponderal index (g cm−3± 100) | 2.69 ± 0.29 | 4.17 ± 0.74* | 2.56 ± 0.20 |
| Brain weight (g) | 43.2 ± 2.0 | 42.4 ± 1.7 | 48.3 ± 0.9* |
| Liver weight (g) | 121.9 ± 10.8 | 94.7 ± 4.0* | 113.3 ± 8.1 |
Differences (P < 0.05) between means ± S.E.M. for treatment groups compared to E fetuses.
DISCUSSION
In this study we have shown reduced β-cell insulin secretion responsiveness to glucose and arginine stimulation in fetal sheep as a result of chronic glucose deprivation during the final 20 % of gestation. We have also shown that reduction in two parameters of pancreatic β-cell responsiveness, insulin secretion in response to arginine and the time to reach maximal insulin concentration in response to acute hyperglycaemia, persist even after euglycaemic recovery of the fetus (Fig. 3 and Fig. 5), although the magnitude of fetal insulin concentration in response to acute hyperglycaemia was significantly improved after 5 days of euglycaemic recovery. This reduced capacity of fetal β-cells to respond normally to glucose and arginine stimulation after euglycaemic recovery indicates that fetal β-cells can be programmed to secrete less insulin as a result of glucose deprivation.
Several groups have documented pancreatic responsiveness in fetal sheep to glucose, amino acids and pharmacological agents (Philipps et al. 1979; Fowden, 1980a; Carver et al. 1996). A glucose bolus administered to a fetal sheep resulted in peak plasma insulin concentrations at 15 min (Fowden, 1980a), whereas during a hyperglycaemic clamp insulin concentrations plateau at 20 min (Philipps et al. 1978). In hyperglycaemic clamp studies, insulin secretion responsiveness is implied to represent primarily a second-phase insulin secretion response (Philipps et al. 1978; Grodsky, 1989). However, fetal sheep may possess biphasic insulin secretion as a combination of acute insulin secretion (first-phase, 0–15 min) and second-phase (>20 min), but acute insulin secretion is not as robust as observed in postnatal life. A slight decrease in insulin plasma concentration occurs at the 20 min sampling period (Fig. 3); while not a significant decline, it was observed in all E fetuses studied. Therefore, GSIS secretion in fetal sheep may represent a biphasic response that was not previously identified due to lower sampling frequency in the previous studies.
Maturation of pancreatic responsiveness to glucose increases 3.7-fold during the last half of gestation, and GSIS between 122 and 137 days gestation increases 1.5-fold (Aldoretta et al. 1998). In the present study, chronic hypoglycaemia for 14 days starting at 120–125 d.p.c. resulted in a ≈50 % inhibition of GSIS, similar to previous observations for a 10–11 day hypoglycaemic period (Carver et al. 1996). These studies indicate that the development or maturation of insulin responsiveness during the final portion of gestation is inhibited by chronic hypoglycaemia in fetal sheep. In addition, a hypoglycaemic insult was also shown to significantly blunt the response time of GSIS and reduce the arginine stimulation of insulin secretion, indicating a reduction of β-cell responsiveness for acute insulin secretion.
Two factors influencing insulin secretion may be development of β-cell mechanisms to respond to secretagogues and alteration of pancreatic architecture. Global malnutrition or protein deprivation in the pregnant rat during the final week of gestation and through lactation reduces insulin content, β-cell mass and proliferation, as well as islet vascularization in the offspring (Snoeck et al. 1990; Dahri et al. 1991; Garofano et al. 1997, 1998). However, morphometric analysis may not completely explain the decreased responsiveness in H fetuses, because pancreatectomies in humans in which a large portion of the pancreas was removed rarely led to fasting hyperglycaemia (Brooks, 1979). Therefore, β-cell secretion capacity may be limited by modification of cellular metabolism or cell secretory pathways.
Five days of nutrient recovery following a 14 day period of hypoglycaemia is sufficient to allow the decreased plasma insulin concentration during the basal and maximum periods of the GSIS to return to normal values (values equivalent to those of the control or E group). Therefore, development of second-phase insulin secretion in fetal sheep can occur during the final days of gestation. No enhancement of GSIS occurred during this period for E fetuses. The improvement in β-cell insulin secretion following hypoglycaemia appears to be attributable to increasing the circulating glucose concentration to normal fetal levels. This observation indicates a potential for glucose-specific treatment when hypoglycaemia is a principal feature of fetal development, such as occurs in cases of IUGR.
In addition to reduced GSIS, arginine-stimulated insulin secretion was reduced in fetuses that were chronically hypoglycaemic. Furthermore, 5 days of euglycaemic recovery did not improve the hypoglycaemia-reduced pancreatic responsiveness to arginine (Fig. 5). Normal maturation of pancreatic responsiveness to arginine increases from 75 to 122 d.p.c. and then plateaus during the final days of fetal life, or during the treatment period in the present study (Aldoretta et al. 1998). In rodent islets, arginine has been shown to depolarize the β-cell membrane by promoting Ca2+ uptake via voltage-insensitive channels to augment insulin secretion (Beigelman et al. 1977; Henquin & Meissner, 1981; Herchuelz et al. 1984). These effects do not appear to require metabolism of arginine to elicit the insulin response (Hellman et al. 1971; Hermans et al. 1987). The combination of increased response time of GSIS and decreased arginine-stimulated insulin secretion indicates that the impairment of GSIS by chronic hypoglycaemia is, at least in part, due to a limitation in the capacity of β-cells to secrete insulin.
Defects in arginine-stimulated insulin secretion have been identified in patients with non-insulin-dependent diabetes mellitus (NIDDM; Hollander et al. 1982; Ward et al. 1984b; Dimitriadis et al. 1985). Furthermore, acute insulin response to increased plasma glucose concentration was absent in NIDDM (Ward et al. 1984a; Kahn et al. 2001). Insulin-to-glucose ratios were reduced in the NIDDM patients, and increased basal glucose concentration has been suggested as a compensatory mechanism for diminished β-cell function (Ward et al. 1984b). Both of these defects were observed during the basal period in the hypoglycaemic fetal sheep even after 5 days of glycaemic recovery and may indicate early signs of β-cell failure to secrete insulin. If abnormal insulin secretion mechanisms are programmed in utero by hypoglycaemia, this may partly provide an explanation of how IUGR infants, who were hypoglycaemic as fetuses, develop limitations of pancreatic insulin secretion and impaired glucose tolerance in later life (Phillips et al. 1994; Yajnik et al. 1995; Fall et al. 1998).
Plasma glucagon concentrations do not appear to be stimulated by chronic glucose deprivation. The fetal α-cells appear unresponsive to changes in plasma glucose concentration, but are not unable to secrete glucagon (Fowden & Hill, 2001). Therefore, differences in fetal plasma glucagon concentration resulting from hypoglycaemia were not expected.
The magnitude of the GSIS plateau insulin concentration in R fetuses was similar to that in E fetuses (Table 1), but the ability of β-cells to respond to glucose, as measured by the prolonged response time, was significantly reduced (Fig. 3). Insulin secretion in R fetuses could also be confounded by increased noradrenaline concentrations, which have been shown to inhibit insulin secretion (Fowden, 1980b; Jackson et al. 1993, 2000; McMillen et al. 2001). The increased noradrenaline concentrations in R fetuses might be the result of decreased O2 contents (Table 2; Jackson et al. 1993; McMillen et al. 2001). However, these noradrenalrine concentrations are not greater than those of other reported control animals with a normal β-cell response to glucose (Jackson et al. 1993, 2000). Furthermore, the I/G ratio of the R fetuses was not greatly altered, suggesting only slight effects on β-cell insulin secretion (Jackson et al. 2000). A longer response time of increased insulin concentration was also observed in H fetuses, indicating that glucose deprivation for 14 days of gestation caused reduced acute pancreatic β-cell responsiveness.
An interesting observation in these studies is the increased concentrations of the amino acids lysine and taurine in the hypoglycaemic fetuses (Table 3). Like arginine, lysine increases insulin secretion in rat islets at pharmacological concentrations and may enhance insulin secretion at lower, more physiological concentrations by altering cytosolic Ca2+ (Charles et al. 1982; Charles & Henquin, 1983).
Taurine also potentiates GSIS in rat islets cultured with taurine concentrations similar to those in H fetuses (Cherif et al. 1996, 1998). Furthermore, reduced insulin secretion from islets of rat fetuses whose mothers were fed low-protein diets can be corrected by maternal diet supplementation with taurine (Cherif et al. 1998). These data indicate a potentially important role for taurine in the development of fetal islet GSIS and indicate that greater taurine concentrations might potentiate increased insulin secretion. Mechanisms responsible for the effects of taurine have not been determined.
Alterations of taurine concentration by changes in glucose concentration are not uncommon. Taurine concentrations are reduced in fetuses of diabetic pregnant rats (Aerts & Van Assche, 2001). Also, increased taurine concentrations were observed in fetal sheep of ewes that were undernourished during the periconceptual period, indicating that the increased taurine might have been responsible for an increased insulin response to glucose (Petry et al. 2001). Taurine has been shown to influence carbohydrate metabolism by increasing glucose uptake and utilization in myocardial and skeletal muscle and liver tissue and by stimulating hepatic glycogen synthesis (Lampson et al. 1983; Kulakowski & Maturo, 1984). These attributes of taurine are similar to those of insulin and may provide protection of glucose-deprived fetuses by enhancing glucose utilization of critical tissues, particularly when the glucose deprivation also limits pancreatic insulin secretion.
Whether or not the increased concentrations of lysine and taurine in the hypoglycaemic fetuses were effective in promoting basal or GSIS and thus limited the detrimental impact of the hypoglycaemia also needs to be investigated.
Another intriguing observation in this study is that fetal weight in the euglycaemic recovery group was indistinguishable from that of E fetuses at post-mortem examination (Table 4). No differences in sex ratio, gestational age or water content (data not shown) appear to account for this surprisingly rapid correction of fetal weight. Further studies will be necessary to measure body composition, the weights of all organs, and rates of protein synthesis and balance to determine what accounts for the rapid increase in weight and how this came about.
In conclusion, insulin secretion responsiveness to glucose and arginine in the present study was blunted as a result of chronic hypoglycaemia. Developmental aberrations in β-cell secretion mechanisms are suggested to reduce the insulin secretion response in a similar manner to those observed in NIDDM. The function of the pancreas remains at least partly blunted even after 5 days of euglycaemic recovery, indicating the possibility that fetal pancreatic islet/β-cell programming can occur with a deficiency of glucose.
Acknowledgments
This work was supported by NIH grant HD60773 (W. W. H., Principal Investigator (PI)) and The Children's Hospital Research Institute, Denver, CO, USA (W. W. H., PI). Sean W. Limesand was supported by NIH NRSA DK60300–1 (S. W. L., PI) and NIH institutional training grant HD07186 (W. W. H., PI). The authors thank Gary O. Zerbe, PhD, Department of Preventive Medicine and Biometrics, University of Colorado School of Medicine, for statistical consultation.
REFERENCES
- Aerts L, Van Assche FA. Low taurine, gamma-aminobutyric acid and carnosine levels in plasma of diabetic pregnant rats: consequences for the offspring. Journal of Perinatal Medicine. 2001;29:81–84. doi: 10.1515/JPM.2001.012. [DOI] [PubMed] [Google Scholar]
- Aldoretta PW, Carver TD, Hay WWJ. Maturation of glucose-stimulated insulin secretion in fetal sheep. Biology of the Neonate. 1998;73:375–386. doi: 10.1159/000014000. [DOI] [PubMed] [Google Scholar]
- Barker DJ, Hales CN, Fall CH, Osmond C, Phipps K, Clark PM. Type 2 (non-insulin-dependent) diabetes mellitus, hypertension and hyperlipidaemia (syndrome X): relation to reduced fetal growth. Diabetologia. 1993;36:62–67. doi: 10.1007/BF00399095. [DOI] [PubMed] [Google Scholar]
- Barker DJP. Mother, Babies and Health in Later Life. Edinburgh: Churchill Livingstone; 1998. [Google Scholar]
- Beigelman PM, Ribalet B, Atwater I. Electric activity of mouse pancreatic beta-cells. II. Effects of glucose and arginine. Journal de Physiologie. 1977;73:201–217. [PubMed] [Google Scholar]
- Brooks JR. Operative approach to pancreatic carcinoma. Seminars in Oncology. 1979;6:357–367. [PubMed] [Google Scholar]
- Carver TD, Anderson SM, Aldoretta PW, Hay WWJ. Effect of low-level basal plus marked ‘pulsatile’ hyperglycemia on insulin secretion in fetal sheep. American Journal of Physiology. 1996;271:E865–871. doi: 10.1152/ajpendo.1996.271.5.E865. [DOI] [PubMed] [Google Scholar]
- Carver TD, Hay WWJ. Uteroplacental carbon substrate metabolism and O2 consumption after long-term hypoglycemia in pregnant sheep. American Journal of Physiology. 1995;269:E299–308. doi: 10.1152/ajpendo.1995.269.2.E299. [DOI] [PubMed] [Google Scholar]
- Charles S, Henquin JC. Distinct effects of various amino acids on 45Ca2+ fluxes in rat pancreatic islets. Biochemical Journal. 1983;214:899–907. doi: 10.1042/bj2140899. [DOI] [PMC free article] [PubMed] [Google Scholar]
- Charles S, Tamagawa T, Henquin JC. A single mechanism for the stimulation of insulin release and 86Rb+ efflux from rat islets by cationic amino acids. Biochemical Journal. 1982;208:301–308. doi: 10.1042/bj2080301. [DOI] [PMC free article] [PubMed] [Google Scholar]
- Cherif H, Reusens B, Ahn MT, Hoet JJ, Remacle C. Effects of taurine on the insulin secretion of rat fetal islets from dams fed a low-protein diet. Journal of Endocrinology. 1998;159:341–348. doi: 10.1677/joe.0.1590341. [DOI] [PubMed] [Google Scholar]
- Cherif H, Reusens B, Dahri S, Remacle C, Hoet JJ. Stimulatory effects of taurine on insulin secretion by fetal rat islets cultured in vitro. Journal of Endocrinology. 1996;151:501–506. doi: 10.1677/joe.0.1510501. [DOI] [PubMed] [Google Scholar]
- Dahri S, Snoeck A, Reusens-Billen B, Remacle C, Hoet JJ. Islet function in offspring of mothers on low-protein diet during gestation. Diabetes. 1991;40:115–120. doi: 10.2337/diab.40.2.s115. [DOI] [PubMed] [Google Scholar]
- DiGiacomo JE, Hay WWJ. Fetal glucose metabolism and oxygen consumption during sustained hypoglycemia. Metabolism. 1990;39:193–202. doi: 10.1016/0026-0495(90)90075-n. [DOI] [PubMed] [Google Scholar]
- Dimitriadis GD, Pehling GB, Gerich JE. Abnormal glucose modulation of islet A- and B-cell responses to arginine in non-insulin-dependent diabetes mellitus. Diabetes. 1985;34:541–547. doi: 10.2337/diab.34.6.541. [DOI] [PubMed] [Google Scholar]
- Falin LI. The development and cytodifferentiation of the islets of Langerhans in human embryos and foetuses. Acta Anatomica. 1967;68:147–168. doi: 10.1159/000143023. [DOI] [PubMed] [Google Scholar]
- Fall CH, Stein CE, Kumaran K, Cox V, Osmond C, Barker DJ, Hales CN. Size at birth, maternal weight, and type 2 diabetes in South India. Diabetic Medicine. 1998;15:220–227. doi: 10.1002/(SICI)1096-9136(199803)15:3<220::AID-DIA544>3.0.CO;2-O. [DOI] [PubMed] [Google Scholar]
- Fowden AL. Effects of arginine and glucose on the release of insulin in the sheep fetus. Journal of Endocrinology. 1980a;85:121–129. doi: 10.1677/joe.0.0850121. [DOI] [PubMed] [Google Scholar]
- Fowden AL. Effects of adrenaline and amino acids on the release of insulin in the sheep fetus. Journal of Endocrinology. 1980b;87:113–121. doi: 10.1677/joe.0.0870113. [DOI] [PubMed] [Google Scholar]
- Fowden AL, Hill DJ. Intra-uterine programming of the endocrine pancreas. British Medical Bulletin. 2001;60:123–142. doi: 10.1093/bmb/60.1.123. [DOI] [PubMed] [Google Scholar]
- Garofano A, Czernichow P, Breant B. In utero undernutrition impairs rat beta-cell development. Diabetologia. 1997;40:1231–1234. doi: 10.1007/s001250050812. [DOI] [PubMed] [Google Scholar]
- Garofano A, Czernichow P, Breant B. Beta-cell mass and proliferation following late fetal and early postnatal malnutrition in the rat. Diabetologia. 1998;41:1114–1120. doi: 10.1007/s001250051038. [DOI] [PubMed] [Google Scholar]
- Grodsky GM. A new phase of insulin secretion. How will it contribute to our understanding of β-cell function? Diabetes. 1989;38:673–678. doi: 10.2337/diab.38.6.673. [DOI] [PubMed] [Google Scholar]
- Hales CN, Barker DJ, Clark PM, Cox LJ, Fall C, Osmond C, Winter PD. Fetal and infant growth and impaired glucose tolerance at age 64. British Medical Bulletin. 1991;303:1019–1022. doi: 10.1136/bmj.303.6809.1019. [DOI] [PMC free article] [PubMed] [Google Scholar]
- Hellerstrom C, Andesson A, Sandler S. Structure and biochemical maturation of the fetal endocrine pancreas. In: Herrera E, Knopp RH, editors. Perinatal Biochemistry. Boca Raton, FL, USA: CRC Press, Inc.; 1992. pp. 181–192. [Google Scholar]
- Hellman B, Sehlin J, Taljedal IB. Effects of glucose and other modifiers of insulin release on the oxidative metabolism of amino acids in micro-dissected pancreatic islets. Biochemical Journal. 1971;123:513–521. doi: 10.1042/bj1230513. [DOI] [PMC free article] [PubMed] [Google Scholar]
- Henquin JC, Meissner HP. Effects of amino acids on membrane potential and 86Rb+ fluxes in pancreatic beta-cells. American Journal of Physiology. 1981;240:E245–252. doi: 10.1152/ajpendo.1981.240.3.E245. [DOI] [PubMed] [Google Scholar]
- Herchuelz A, Lebrun P, Boschero AC, Malaisse WJ. Mechanism of arginine-stimulated Ca2+ influx into pancreatic B cell. American Journal of Physiology. 1984;246:E38–43. doi: 10.1152/ajpendo.1984.246.1.E38. [DOI] [PubMed] [Google Scholar]
- Hermans MP, Schmeer W, Henquin JC. The permissive effect of glucose, tolbutamide and high K+ on arginine stimulation of insulin release in isolated mouse islets. Diabetologia. 1987;30:659–665. doi: 10.1007/BF00277325. [DOI] [PubMed] [Google Scholar]
- Hollander PM, Asplin CM, Palmer JP. Glucose modulation of insulin and glucagon secretion in nondiabetic and diabetic man. Diabetes. 1982;31:489–495. doi: 10.2337/diab.31.6.489. [DOI] [PubMed] [Google Scholar]
- Jackson BT, Cohn HE, Morrison SH, Baker RM, Piasecki GJ. Hypoxia-induced sympathetic inhibition of the fetal plasma insulin response to hyperglycemia. Diabetes. 1993;42:1621–1625. doi: 10.2337/diab.42.11.1621. [DOI] [PubMed] [Google Scholar]
- Jackson BT, Piasecki GJ, Cohn HE, Cohen WR. Control of fetal insulin secretion. American Journal of Physiology - Regulatory, Integrative and Comparative Physiology. 2000;279:R2179–2188. doi: 10.1152/ajpregu.2000.279.6.R2179. [DOI] [PubMed] [Google Scholar]
- Kahn SE, Montgomery B, Howell W, Ligueros-Saylan M, Hsu CH, Devineni D, McLeod JF, Horowitz A, Foley JE. Importance of early phase insulin secretion to intravenous glucose tolerance in subjects with type 2 diabetes mellitus. Journal of Clinical Endocrinology and Metabolism. 2001;86:5824–5829. doi: 10.1210/jcem.86.12.8105. [DOI] [PubMed] [Google Scholar]
- Kervran A, Girard JR. Glucose-induced increase of plasma insulin in the rat foetus in utero. Journal of Endocrinology. 1974;62:545–551. doi: 10.1677/joe.0.0620545. [DOI] [PubMed] [Google Scholar]
- Kervran A, Randon J. Development of insulin release by fetal rat pancreas in vitro: effects of glucose, amino acids, and theophylline. Diabetes. 1980;29:673–678. doi: 10.2337/diab.29.9.673. [DOI] [PubMed] [Google Scholar]
- Kulakowski EC, Maturo J. Hypoglycemic properties of taurine: not mediated by enhanced insulin release. Biochemical Pharmacology. 1984;33:2835–2838. doi: 10.1016/0006-2952(84)90204-1. [DOI] [PubMed] [Google Scholar]
- Lampson WG, Kramer JH, Schaffer SW. Potentiation of the actions of insulin by taurine. Canadian Journal of Physiology and Pharmacology. 1983;61:457–463. doi: 10.1139/y83-070. [DOI] [PubMed] [Google Scholar]
- McMillen IC, Adams MB, Ross JT, Coulter CL, Simonetta G, Owens JA, Robinson JS, Edwards LJ. Fetal growth restriction: adaptations and consequences. Reproduction. 2001;122:195–204. doi: 10.1530/rep.0.1220195. [DOI] [PubMed] [Google Scholar]
- Nicolini U, Hubinont C, Santolaya J, Fisk NM, Rodeck CH. Effects of fetal intravenous glucose challenge in normal and growth retarded fetuses. Hormone and Metabolic Research. 1990;22:426–430. doi: 10.1055/s-2007-1004939. [DOI] [PubMed] [Google Scholar]
- Nieto-Diaz A, Villar J, Matorras-Weinig R, Valenzuela-Ruiz P. Intrauterine growth retardation at term: association between anthropometric and endocrine parameters. Acta Obstetrica et Gynecologica Scandinavica. 1996;75:127–131. doi: 10.3109/00016349609033303. [DOI] [PubMed] [Google Scholar]
- Petry CJ, Ozanne SE, Hales CN. Programming of intermediary metabolism. Molecular and Cellular Endocrinology. 2001;185:81–91. doi: 10.1016/s0303-7207(01)00627-x. [DOI] [PubMed] [Google Scholar]
- Philipps AF, Carson BS, Meschia G, Battaglia FC. Insulin secretion in fetal and newborn sheep. American Journal of Physiology. 1978;235:E467–474. doi: 10.1152/ajpendo.1978.235.5.E467. [DOI] [PubMed] [Google Scholar]
- Philipps AF, Dubin JW, Raye JR. Response of the fetal and newborn lamb to glucose and tolbutamide infusions. Pediatric Research. 1979;13:1375–1378. doi: 10.1203/00006450-197912000-00015. [DOI] [PubMed] [Google Scholar]
- Phillips DI, Barker DJ, Hales CN, Hirst S, Osmond C. Thinness at birth and insulin resistance in adult life. Diabetologia. 1994;37:150–154. doi: 10.1007/s001250050086. [DOI] [PubMed] [Google Scholar]
- Reddy S, Bibby NJ, Elliott RB. An immunofluorescent study of insulin-, glucagon-, pancreatic polypeptide- and somatostatin-containing cells in the early ovine fetal pancreas. Quarterly Journal of Experimental Physiology. 1988;73:225–232. doi: 10.1113/expphysiol.1988.sp003135. [DOI] [PubMed] [Google Scholar]
- Regnault TR, Orbus RJ, Battaglia FC, Wilkening RB, Anthony RV. Altered arterial concentrations of placental hormones during maximal placental growth in a model of placental insufficiency. Journal of Endocrinology. 1999;162:433–442. doi: 10.1677/joe.0.1620433. [DOI] [PubMed] [Google Scholar]
- SAS Institute Inc. SAS/STAT User's Guide. Vol. 8. Cary, NC, USA: SAS Institute Inc.; 1999. [Google Scholar]
- Shelley HJ, Neligan GA. Neonatal hypoglycaemia. British Medical Bulletin. 1966;22:34–39. doi: 10.1093/oxfordjournals.bmb.a070433. [DOI] [PubMed] [Google Scholar]
- Snoeck A, Remacle C, Reusens B, Hoet JJ. Effect of a low protein diet during pregnancy on the fetal rat endocrine pancreas. Biology of the Neonate. 1990;57:107–118. doi: 10.1159/000243170. [DOI] [PubMed] [Google Scholar]
- Van Assche FA, De Prins F, Aerts L, Verjans M. The endocrine pancreas in small-for-dates infants. British Journal of Obstetrics and Gynaecology. 1977;84:751–753. doi: 10.1111/j.1471-0528.1977.tb12486.x. [DOI] [PubMed] [Google Scholar]
- Ward WK, Beard JC, Halter JB, Pfeifer MA, Porte DJ. Pathophysiology of insulin secretion in non-insulin-dependent diabetes mellitus. Diabetes Care. 1984a;7:491–502. doi: 10.2337/diacare.7.5.491. [DOI] [PubMed] [Google Scholar]
- Ward WK, Bolgiano DC, McKnight B, Halter JB, Porte DJ. Diminished B cell secretory capacity in patients with noninsulin-dependent diabetes mellitus. Journal of Clinical Investigation. 1984b;74:1318–1328. doi: 10.1172/JCI111542. [DOI] [PMC free article] [PubMed] [Google Scholar]
- Willes RF, Boda JM, Stokes H. Cytological localization of insulin and insulin concentration in the fetal ovine pancreas. Endocrinology. 1969;84:671–675. doi: 10.1210/endo-84-3-671. [DOI] [PubMed] [Google Scholar]
- Yajnik CS, Fall CH, Vaidya U, Pandit AN, Bavdekar A, Bhat DS, Osmond C, Hales CN, Barker DJ. Fetal growth and glucose and insulin metabolism in four-year-old Indian children. Diabetic Medicine. 1995;12:330–336. doi: 10.1111/j.1464-5491.1995.tb00487.x. [DOI] [PubMed] [Google Scholar]