

Abstract
Galvanic vestibular stimulation (GVS) in animals modulates the firing of otolith and semicircular canal afferents alike. Here, we look for postural responses evoked by GVS from the otolith organs and semicircular canals. To minimise the modifying effects of somatosensory input on the response, low-intensity (0.3–0.5 mA) GVS was applied for 8 s while subjects stood on foam rubber with the feet together and strapped to the floor. The response had three phases: (i) a rapid movement during the first second, (ii) a slower movement that persisted throughout the stimulus, and (iii) a rapid partial return movement after GVS stopped. The three movement velocities were significantly different. The GVS response therefore appears to be the sum of a step response that returns to the starting point when the stimulus stops, and a constant-velocity ramp response for the duration of the stimulus without a return movement. Subjects' responses differed in size and profile, some with the step or ramp responses almost exclusively but most with a combination of both. The ‘step-plus-ramp’ model was tested by comparing the three velocities. If the responses add, the initial velocity should not be different from the sum of the velocities during the ramp-only period and the step-only period at offset. ANOVA and pairwise comparisons confirmed this. It is concluded that postural responses to GVS arise through stimulation of both otolith and canal afferents.
Stimulation of the vestibular system with a small current passed between the mastoid processes (galvanic vestibular stimulation; GVS) causes a prolonged body sway in standing human subjects (Coats, 1973; Nashner & Wolfson, 1974). This stimulus causes subjects to adopt a new final tilted position relative to gravity after an initial sway response towards the anodal ear (Popov et al. 1986; Inglis et al. 1995; Hlavacka et al. 1996; Day et al. 1997). It is not clear why the change in vestibular afference produced by this stimulus should cause this relatively static tilted posture of the body. The otolith organs respond to linear accelerations of the head and amongst other things normally provide the signal of head tilt relative to the gravitational field, whereas the semicircular canals respond to angular accelerations of the head. Thus, the static nature of the GVS postural response could mean that it simply arises from an altered otolith signal. However, in animal studies, GVS modulates the discharge rate of firing of both otolith and semicircular canal afferents alike (Goldberg et al. 1984). The discharge rate of vestibular afferents is increased on the cathodal side and decreased on the anodal side (Lowenstein, 1955; Goldberg et al. 1984; Courjon et al. 1987). Based on this animal work, a selective effect on otolith afferents by GVS in man would be surprising.
From first principles, it could be expected that a postural response based on semicircular canal signals would produce a more continuous change in posture than the static tilt that is usually observed. There are a number of possible explanations for this discrepancy but perhaps the most compelling comes from the GVS-evoked behaviour of a subject with a severe somatosensory loss (Day & Cole, 2002). In this deafferented subject, who was tested while seated, GVS produced a relatively large response that consisted of a continuous tilting of the head and trunk for the entire period that the stimulus remained on. This continuous tilting behaviour, which was observed with stimulus intensities ranging from 0.5 to 1.5 mA, suggested that semicircular canal afferents were recruited by the stimulus and contributed to the subject's postural response. It is possible, therefore, that the absence of a continuous tilt in healthy subjects arises from their intact somatosensory input. Thus, somatosensory feedback about the early developing GVS response could be used to modify or arrest later stages of the response. Without somatosensory feedback, the deafferented subject's response presumably developed freely over time without modification.
The present study seeks evidence for contributions from otolith and semicircular canal afferents to the GVS body-sway response in healthy subjects. We have attempted to minimise the modifying influence of somatosensory feedback in a number of ways. First, the subject's feet were strapped to the floor so that, relative to the base of support, large excursions of the centre of mass of the body were possible without threatening balance. Second, proprioceptive and cutaneous feedback of the laterally directed response was reduced by requesting subjects to stand with feet together (Day et al. 1997) on thick foam rubber and with heavy sandbags placed over the feet. Blindfolding the subjects prevented visual feedback. However, the size of the GVS response increases when visual cues are absent, when subjects stand on an unstable support surface, and with the feet close together (Britton et al. 1993; Fitzpatrick et al. 1994; Day et al. 1997). Thus, we used low stimulus intensities of 0.3 and 0.5 mA to permit a long time period in which the vestibular response could be seen before it was arrested by somatosensory feedback. As discussed above, it could be expected that a response based on an otolith signal would appear as a static tilt or position change whereas the semicircular canal signal would produce a more continuous response. Both of these responses to GVS were observed in the deafferented subject (Day & Cole, 2002). Long stimulus durations are used in the present experiments so that the two responses, which are likely to have different time courses, can be identified. Some of these findings have been presented in abstract form (Fitzpatrick et al. 2001).
METHODS
Subjects
Ten healthy adults, aged 24–47 years, with no history of neurological disease or trauma took part in the experiments. Subjects provided informed written consent to participate in these experiments, which conformed with the standards set by the Declaration of Helsinki and had been approved by the institute's human ethics committee.
Stimulus
Stimulus electrodes (3 cm2 AgCl) were attached over each mastoid process and stabilised with an elastic headband. A constant-current source was used to pass an 8 s step impulse of current at 0.3 or 0.5 mA between the electrodes. This bipolar stimulus was applied with the anode on the right or on the left. Some subjects could perceive the 0.5 mA stimuli as cutaneous paraesthesia but were not told of the different stimulus polarities.
Setup and protocol
The experiment was designed so that visual and somatosensory input about body position and sway were minimised. Subjects stood quietly in a darkened room with their eyes closed and with their arms folded during the trials. They stood on a piece of 2 cm thick foam with their feet 5 cm apart and anchored to the floor with foam-covered straps across the front of the feet and from around the ankles to the back of the heels (Fig. 1). Heavy sandbags were placed on top of the feet to increase stability by weighing them down, and to diminish the acuity of sensory input from the soles of the feet by reducing the relative pressure changes. They also produced some degree of ischaemia in the feet as subjects reported paraesthesia and numbness by the end of the experiment.
Figure 1. Experimental setup.
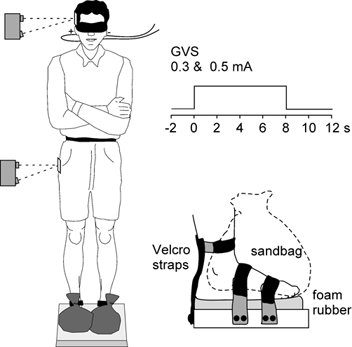
Subjects stood with the feet strapped to the floor and sandbags on top of the feet as shown in the inset. Optical displacement devices were targeted at the side of the pelvis and head to measure lateral body sway. Bilateral bipolar GVS was applied as 8 s step pulses.
For each stimulus intensity, 32 trials were made: 16 anode-right and 16 anode-left stimuli. The presentation order of the 0.3 and 0.5 mA stimuli were block-randomised in groups of eight. The presentation order of the different polarities was randomised within each block. Subjects were given approximately a 30 s rest between individual trials during which they were encouraged to move. There were 2 min breaks between each block during which subjects sat.
Measurement
Lateral body sway was measured for 14 s, including 2 s pre-stimulus, by two optical displacement devices (MEL Mikroelektronik, Eching, Germany: M5L/200) that were targeted at markers on the sides of the head and pelvis. The signals were sampled at 200 Hz using an analog-digital interface and stored for later analysis. For each stimulus intensity, movements at the head and pelvis were averaged across trials for each subject.
RESULTS
Figure 2 shows the head and pelvis movement produced by each stimulus. Each trace shows the mean for all subjects with the data normalised in the direction of the anode. The displacement was greater with the 0.5 mA than with the 0.3 mA stimulus, and greater at the head than at the pelvis,
Figure 2. Mean sway response for all subjects.
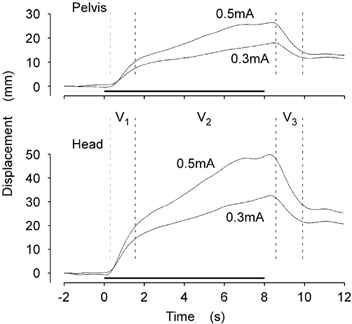
The group mean lateral displacement at the pelvis (top) and head (bottom) are shown for the 0.3 and 0.5 mA stimuli. GVS was applied for the period indicated by the horizontal lines (0–8 s). Visual inspection revealed three distinct phases of the response (V1, V2, V3).
Visual inspection of these data indicated that the response could be divided into three discrete intervals. First, there was an initial, and relatively rapid, displacement towards the anodal side during the first second after stimulus onset (V1). This was followed by a period of slower movement in the same direction that persisted for the duration of the stimulus (V2). After the stimulus was stopped, there was a relatively rapid movement back in the opposite direction for a second or so (V3). This return movement did not come back to the original starting position before the movement stopped. Thus, a new equilibrium position was attained at the end of the movement.
This pattern of movement appears as if it is the sum of two separate responses, as illustrated in Fig. 3A. One is a step and plateau response (S) that returns to the starting point when the stimulus ceases. The other is a ramp response (R) that produces a constant velocity movement for the duration of the stimulus and then stops, without a return movement, when the stimulus stops.
Figure 3. Step-plus-ramp model of the response.
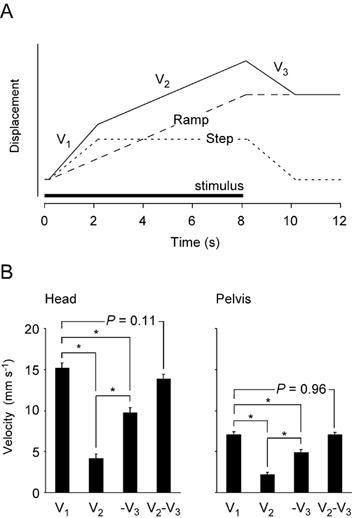
A, the response (continuous line) was modelled as the sum of a step or position response (dotted line) and a ramp or velocity response (dashed line). The step response was assumed to have the same onset and offset speeds, as determined by the GVS response and movement dynamics of the body. The model was tested with the responses from individual subjects by comparing the movement velocities during the periods V1, V2 and V3. B, mean sway velocities in the direction of the anode are shown for each phase of the response (V1, V2, V3, mean ± s.e.m.). Data are shown for the head (left) and pelvis (right). The data were calculated individually and averaged across the subjects group. Negative V3 is shown because it was the movement in the reverse direction when the stimulus stopped. V1 was not shown to be significantly different from the sum of V2 and -V3, a result consistent with the step-plus-ramp model.
The step-plus-ramp model (Fig. 3A) was tested by comparing the sway velocities during the three movement phases (V1, V2 and V3). If the step and ramp responses add, then V1 should equal the sum of V2 (ramp only) and -V3 (step only). For each subject, and both stimuli (i.e. 20 responses), these velocities were determined from the regression slopes of the individual head and pelvis curves for the periods (V1: 0.4–0.9 s), (V2: 1.6–6.0 s) and (V3: 8.4–8.9 s). These intervals were also chosen by visual inspection and because they agreed well with a similar, although much larger response, seen in a recent study of a man with severe somatosensory loss (Day & Cole, 2002).
Four mean velocities are shown in Fig. 3B for the head and the pelvis: three for the periods V1, V2 and V3, and one for the calculated velocity V2 - V3. ANOVA of these data (four groups of 20 responses), showed that the three velocities were significantly different at the head (F3,76 = 72.6, P < 0.001) and at the pelvis (F3,76 = 51.5, P < 0.001). Pairwise comparisons showed that there was no significant difference between V1 and V2 - V3 at the head (α= 0.05, P = 0.11) or the pelvis (P = 0.96). Thus, the velocity of the initial movement can be considered equal to the sum of the ramp and step velocities illustrated in Fig. 3A.
The individual responses for each polarity and stimulus amplitude for all 10 subjects are shown in Fig. 4. Inspection showed that they also approximated the sum of step and ramp responses of varying amplitudes. However, there were differences between subjects in the magnitudes and profiles of these responses. For example, subject 7 responded with the step response almost exclusively with the 0.3 mA stimulus and showed a relatively small ramp response at 0.5 mA. In contrast, subject 1 had a ramp response and no step response at 0.3 mA, with a relatively small step response appearing at 0.5 mA. Most subjects had a more balanced combination of the step and ramp responses, seen clearly in subjects 2 and 4. In addition, there are indications that the ramp and step responses were affected differently by the stimulus intensity in different subjects. For example, subject 3 had no ramp response at 0.3 mA but this became large at 0.5 mA without an increase in the step response. Conversely, subjects 1 and 2 developed larger step responses with the higher stimulus intensity without much change in the ramp responses.
Figure 4. Responses of individual subjects.
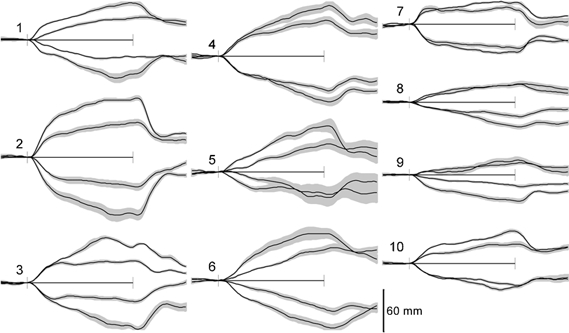
The sway responses (mean of 16 trials ± s.e.m.) for the 10 subjects, with the anode-right above the axis (movement R) and anode left below the axis (movement L). For every subject, the smaller response is for the 0.3 mA stimulus and the larger for the 0.5 mA stimulus. The records are for 14 s, with the 8 s period of the stimulus indicated between the axis markers.
In five subjects, stimuli of 0.5 mA were delivered for periods longer than 20 s. With this stimulus, subjects developed an oscillatory movement of the head. The responses are shown in Fig. 5. After initial large movements of 37.4 ± 8.0 mm that lasted 6.1 ± 2.0 s (mean ± s.d.), the movement reversed and then started a to and fro movement with a mean period of 5.6 ± 1.6 s and an amplitude of 22.1 ± 8.1 mm, about half that of the initial movement amplitude.
Figure 5. Head movements with prolonged stimulation.
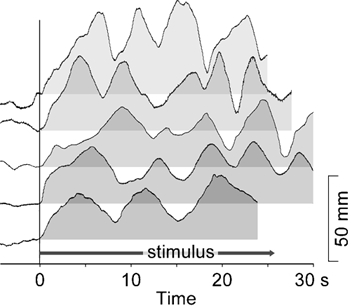
Responses for five subjects of lateral head displacement during sustained GVS at 0.5 mA. The response of each subject is shown relative to its own baseline, zeroed at the point of stimulus onset. After onset, the stimulus is applied for the entire duration shown, which varied slightly between subjects. For each subject, after an initial movement in the direction of the anode, a movement commences that oscillates between a baseline that is displaced approximately 20 mm from the start position with a limit at approximately 40 mm.
DISCUSSION
These results show that sway reactions evoked by GVS can be described as the sum of two separate responses: a step response and a ramp response. Given that GVS similarly affects the firing of both otolith and semicircular canal afferents in monkeys (Goldberg et al. 1984), the most parsimonious explanation for these findings is that GVS also stimulates both afferent types in human subjects and produces responses in accord with the known properties of the otolith organs and semicircular canals. Thus, we propose that the step or position response arises through an effect on otolith afferents, and the ramp or velocity response arises through an effect on canal afferents.
The postural response to GVS was recently described for a deafferented human subject (I.W.) while sitting (Day & Cole, 2002), and his body sway reaction was similar in shape and timing to those described here. It also was best described as the addition of a position or step response and a continuous velocity response. The big difference in his sway response was that it was ten times larger than those reported here. This must reflect the greater weighting of the vestibular signal into the overall postural control system when somatosensory input is not available, rather than a fundamentally different response arising from his unique situation. Similar, although smaller, effects can be seen in subjects with peripheral sensory neuropathy (Horak & Hlavacka, 2001), and the opposite effect is seen when additional sensory input is available (Britton et al. 1993).
The sway reactions to GVS commonly observed in previous studies appear to have only a position, or step profile, in which the subject attains a new steady-state realignment of the body (e.g. Inglis et al. 1995). Why have the ramp responses been observed in the present study? In the single deafferented subject (I.W.) the step and ramp responses are very clear because, having little other sensory input, he depended almost exclusively on the vestibular input to maintain posture and there was no modifying effect of somatosensory feedback on his developing response. Thus, in the present experiment, largely unmodified responses were secured by increasing subjects’ reliance on vestibular input and minimising somatosensory feedback information. Subjects stood with eyes shut, and the foam support reduced the acuity of sensory input from the feet. The sandbags were applied to reduce the relative changes of pressure under the feet that occur with sway, but they may also have had an effect by producing some sensory loss through sustained partial ischaemia. Standing with feet together reduced the lateral sway-induced proprioceptive feedback from the legs (Day et al. 1997), and standing on foam increased the reliance on vestibular information (Fitzpatrick et al. 1994). To this end, subjects here stood with the feet together on foam. A relatively long stimulus was used so that it was possible to distinguish an immediate from a prolonged response. Furthermore, the stimuli were delivered at relatively low intensities so that the reactions would be slow and prevent rapid movements to a limit of stability that could evoke stronger and more abrupt postural reactions based on other sensory inputs. Finally, the feet were strapped to the floor to encourage greater excursions of sway before abrupt postural corrections of this type were made. This was done because it had been observed that during voluntary sway with the feet strapped down, subjects were unconcerned when they took the centre of mass of the body beyond the base of support; a situation much like leaning a long way forward on skis. Thus, the specific postural conditions used here have enhanced the GVS response at low stimulus levels and enabled the dual responses to be identified. Despite this, it should be noted that both the step and ramp responses produced here should contribute to the GVS reaction that is seen with more conventional postural conditions.
Several hypotheses have been proposed to explain how the nervous system interprets the GVS signal and organises the postural response. These tend to be static in nature, such as GVS producing a vestibular error signal of body alignment (Lund & Broberg, 1983), a realignment of the body to an altered representation of the gravitational vertical (Inglis et al. 1995), or a postural reaction as if the ground support surface had been tilted (Day et al. 1997). The step response observed in the present study is consistent with these hypotheses. Approximately three-quarters of utricular hair cells are excited by ipsilateral head tilt and one-quarter by contralateral tilt, whereas there is an approximately equal division between saccular hair cells that are excited by upward and downward accelerations (Gresty et al. 1992). Thus, if GVS altered the discharge rate of the population of utricular afferents, it would produce a net signal of static tilt also consistent with these concepts. We therefore propose that the step response probably arises through a GVS effect on utricular afferents that produces a signal of static head tilt.
Another explanation is required to explain the dynamic ramp response to GVS. The adequate stimulus for excitation of the semicircular canals is angular acceleration of the head. Thus, if GVS at these intensities alters the firing of canal afferents and produces a net response, it should produce a signal of continuous angular movement for the duration of the stimulus. Postural reactions based on such afferent signals should look like the ramp responses observed here. In animal studies, GVS affects the firing of afferents from both the otolith organs and semicircular canals (Goldberg et al. 1984). Similarly, a number of studies on the human ocular response to GVS have concluded that both otolith and semicircular canal afferents are recruited by the stimulus (Zink et al. 1997, 1998; Kleine et al. 1999; Schneider et al. 2000), although the currents used were much higher than in the present experiments. With low-intensity current steps, comparable in profile and magnitude to those used here (4 s at 0.3–0.5 mA), the predominant ocular response is a torsion in which the eyes continue to rotate throughout the 4 s of stimulation (Séverac Cauquil et al. 2002). The continuous eye movement that they observed, and suggested arose through semicircular canal involvement, had a similar profile to the postural response described in the present paper. We therefore propose that the postural ramp response is based on a canal response to GVS that signals angular acceleration of the head.
The response profiles varied between subjects, with some having relatively large ramp responses and others large step responses. Similarly, increasing the stimulus intensities from 0.3 to 0.5 mA did not produce the same increments in the position and velocity responses across the different subjects. These differences most probably arise through a simple peripheral stimulus-receptor effect in which some idiosyncratic selectivity develops between canal and otolith afferents at low stimulus intensities. In a similar way, differences in macular structure could explain the considerable inter-subject variability of otolith vestibulo-ocular responses to GVS (Kleine et al. 1999). Alternatively, it may indicate that subjects use different sensory strategies to stand, applying different weightings to the different types of information that come from the otolith organs and semicircular canals. It is conceivable that those subjects with large ramp responses use the input to control body movement and those with step-only responses use the signal to control body alignment with respect to the feet but not the more dynamic components of body sway.
Clearly, a problem will arise if the GVS and the ramp movement persist for a long time: either you fall or a sensory conflict arises and the balance is corrected. To look at this, GVS was applied for longer than 20 s in five subjects. This produced an interesting continuous lateral nodding of the head, and to a lesser extent the trunk. The baseline position for this nod was offset from the starting point and could be explained by the constant step position or otolith response. The saw-tooth oscillation then corresponds to the ramp or canal response that repeatedly reaches another postural limit and this causes a rapid resetting to the offset baseline position. This limit is presumably based on proprioceptive inputs. It is appealing that the word nystagmus, which is related to the word νυσταζω (nystazho) meaning to nod the head in tiredness, is borrowed from Greek to describe oscillatory eye movements. Here, the nod of the head produced by GVS reflects the literal meaning of the word.
Acknowledgments
This work was supported by the National Health and Medical Research Council of Australia, and the Medical Research Council of Great Britain.
REFERENCES
- Britton T, Day BL, Brown P, Rothwell JC, Thompson PD, Marsden CD. Postural electromyographic responses in the arm and leg following galvanic vestibular stimulation in man. Exp Brain Res. 1993;94:143–151. doi: 10.1007/BF00230477. [DOI] [PubMed] [Google Scholar]
- Coats AC. Effect of varying stimulus parameters on the galvanic body-sway response. Ann Otol Rhinol Laryngol. 1973;82:96–102. doi: 10.1177/000348947308200119. [DOI] [PubMed] [Google Scholar]
- Courjon JH, Precht W, Sirkin DW. Vestibular nerve and nuclei unit responses and eye movement responses to repetitive galvanic stimulation of the labyrinth in the rat. Exp Brain Res. 1987;66:41–48. doi: 10.1007/BF00236200. [DOI] [PubMed] [Google Scholar]
- Day BL, Cole J. Vestibular-evoked postural responses in the absence of somatosensory information. Brain. 2002;125:2081–2088. doi: 10.1093/brain/awf212. [DOI] [PubMed] [Google Scholar]
- Day BL, Severac CauquilA, Bartolomei L, Pastor MA, Lyon IN. Human body-segment tilts induced by galvanic stimulation: a vestibularly driven balance protection mechanism. J Physiol. 1997;500:661–672. doi: 10.1113/jphysiol.1997.sp022051. [DOI] [PMC free article] [PubMed] [Google Scholar]
- Fitzpatrick R, Burke D, Gandevia SC. Task-dependent reflex responses and movement illusions evoked by galvanic vestibular stimulation in standing humans. J Physiol. 1994;478:363–372. doi: 10.1113/jphysiol.1994.sp020257. [DOI] [PMC free article] [PubMed] [Google Scholar]
- Fitzpatrick RC, Wardman DL, Marsden JF, Day BL. Proceedings of the International Union of Physiological Sciences Movement and Sensation Symposium. 2001. What does galvanic vestibular stimulation stimulate? p. p.38. [Google Scholar]
- Goldberg JM, Smith CE, Fernandez C. Relation between discharge regularity and responses to externally applied galvanic currents in vestibular nerve afferents of the squirrel monkey. J Neurophysiol. 1984;51:1236–1256. doi: 10.1152/jn.1984.51.6.1236. [DOI] [PubMed] [Google Scholar]
- Gresty MA, Bronstein AM, Brandt T, Dieterich M. Neurology of otolith function. Peripheral and central disorders. Brain. 1992;115:647–673. doi: 10.1093/brain/115.3.647. [DOI] [PubMed] [Google Scholar]
- Hlavacka F, Mergner T, Krizkova M. Control of body vertical by vestibular and proprioceptive inputs. Brain Res Bull. 1996;40:431–435. doi: 10.1016/0361-9230(96)00138-4. [DOI] [PubMed] [Google Scholar]
- Horak FB, Hlavacka F. Somatosensory loss increases vestibulospinal sensitivity. J Neurophysiol. 2001;86:575–585. doi: 10.1152/jn.2001.86.2.575. [DOI] [PubMed] [Google Scholar]
- Inglis JT, Shupert CL, Hlavacka F, Horak FB. Effect of galvanic vestibular stimulation on human postural responses during support surface translations. J Neurophysiol. 1995;73:896–901. doi: 10.1152/jn.1995.73.2.896. [DOI] [PubMed] [Google Scholar]
- Kleine JF, Guldin WO, Clarke AH. Variable otolith contribution to the galvanically induced vestibulo-ocular reflex. NeuroReport. 1999;10:1143–1148. doi: 10.1097/00001756-199904060-00044. [DOI] [PubMed] [Google Scholar]
- Lowenstein O. The effect of galvanic polarization on the impulse discharge from sense endings in the isolated labyrinth of the thornback ray (Raja clavata) J Physiol. 1955;127:104–117. doi: 10.1113/jphysiol.1955.sp005241. [DOI] [PMC free article] [PubMed] [Google Scholar]
- Lund S, Broberg C. Effects of different head positions on postural sway in man induced by a reproducible vestibular error signal. Acta Physiol Scand. 1983;117:307–309. doi: 10.1111/j.1748-1716.1983.tb07212.x. [DOI] [PubMed] [Google Scholar]
- Nashner LM, Wolfson P. Influence of head position and proprioceptive cues on short latency postural reflexes evoked by galvanic stimulation of the human labyrinth. Brain Res. 1974;67:255–268. doi: 10.1016/0006-8993(74)90276-5. [DOI] [PubMed] [Google Scholar]
- Popov KE, Smetanin BN, Gurfinkel VS, Kudinova MP, Shlykov VY. Spatial perception and vestibulomotor responses in man. Neurophysiol 18. 1986:548–553. [PubMed] [Google Scholar]
- Schneider E, Glasauer S, Dieterich M. Central processing of human ocular torsion analyzed by galvanic vestibular stimulation. NeuroReport. 2000;11:1559–1563. [PubMed] [Google Scholar]
- Séverac Cauquil A, Faldon M, Popov K, Day BL, Bronstein AM. Short-latency eye movements evoked by near-threshold galvanic vestibular stimulation. Exp Brain Res. 2002 doi: 10.1007/s00221-002-1326-z. (in the Press) [DOI] [PubMed] [Google Scholar]
- Zink R, Bucher SF, Weiss A, Brandt T, Dieterich M. Effects of galvanic vestibular stimulation on otolithic and semicircular canal eye movements and perceived vertical. Electroencephalogr Clin Neurophysiol. 1998;107:200–205. doi: 10.1016/s0013-4694(98)00056-x. [DOI] [PubMed] [Google Scholar]
- Zink R, Steddin S, Weiss A, Brandt T, Dieterich M. Galvanic vestibular stimulation in humans: effects on otolith function in roll. Neurosci Lett. 1997;232:171–174. doi: 10.1016/s0304-3940(97)00610-1. [DOI] [PubMed] [Google Scholar]