

Abstract
The mechanism for electrical tuning in non-mammalian hair cells rests within the widely diverse kinetics of functionally distinct, large-conductance potassium channels (BK), thought to result from alternative splicing of the pore-forming α subunit and variable co-expression with an accessory β subunit. Inside-out patches from hair cells along the chicken basilar papilla revealed ‘tonotopic’ gradations in calcium sensitivity and deactivation kinetics. The resonant frequency for the hair cell from which the patch was taken was estimated from deactivation rates, and this frequency reasonably matched that predicted from the originating cell's tonotopic location. The rates of deactivation for native BK channels were much faster than rates reported for cloned chicken BK channels including both α and β subunits. This result was surprising since patches were pulled from hair cells in the apical half of the papilla where β subunits are most highly expressed. Heterogeneity in the properties of native chicken BK channels implies a high degree of molecular variation and hinders our ability to identify those molecular constituents.
Large-conductance, BK-type potassium channels are expressed in a variety of cell types (Latorre et al. 1989). This prevalence may reflect some useful characteristics, including a high single-channel conductance, sensitivity to membrane depolarization and cytosolic calcium concentration, and the potential for extensive post-transcriptional modification (Vergara et al. 1998). In some excitable cells, such as neurons (Robitaille et al. 1993), smooth muscle (Nelson et al. 1995), and hair cells (Roberts et al. 1990; Issa & Hudspeth, 1994), BK channels provide negative feedback on the activity of co-localized voltage-gated calcium channels, repolarizing the cell membrane following depolarization-induced calcium influx. The interplay between these two channels has been intensively studied in the hair cells of many non-mammalian vertebrates, where they are responsible for a resonance in the hair cell membrane potential following current injection (Lewis & Hudspeth, 1983; Art & Fettiplace, 1987; Fuchs et al. 1988; Fettiplace & Fuchs, 1999). In the turtle (Crawford & Fettiplace, 1980) and chick (Pantelias et al. 2001), this resonant frequency varies systematically along the tonotopic axis of the auditory sensory epithelium (the basilar papilla), providing a means for intrinsic electrical tuning. The primary determinant of the smooth variation in resonant frequency is the orderly change in macroscopic BK kinetics (Art & Fettiplace, 1987), leading to the proposition that the molecular determinants of functionally distinct BK channels must also be tonotopically distributed (Wu & Fettiplace, 1996; Jones et al. 1999b; Ramanathan & Fuchs, 2002).
The gene responsible for encoding the BK channel pore-forming α subunit (slo) was originally cloned from the slowpoke phenotype in Drosophila (Atkinson et al. 1991), and orthologues were subsequently found in a number of other species (Butler et al. 1993; Dworetzky et al. 1994; Tseng-Crank et al. 1994; Vogalis et al. 1996; Jiang et al. 1997). Functionally distinct isoforms are created via two mechanisms, by alternatively splicing slo-gene transcripts and by modulation using accessory subunits (Jones et al. 1999b; Ramanathan et al. 1999, 2000). Molecular data from chicken papillae indicate the existence of at least eight splice sites and 15 alternative exons in chicken slo (cslo), leading to an enormous number of potential isoforms (Jiang et al. 1997; Navaratnam et al. 1997; Rosenblatt et al. 1997; Fettiplace & Fuchs, 1999; Ramanathan et al. 2000). As a second means for altering function, the channel can co-assemble with β subunits, which increase the apparent calcium sensitivity, shifting the activation curve to more negative voltages and slowing the deactivation rate (Jones et al. 1999b; Nimigean & Magleby, 1999; Ramanathan et al. 1999, 2000). Although the avian β subunit is only 40 % homologous with the mammalian β1 subunit, the topologies are similar (Oberst et al. 1997), and the electrophysiological effects of both molecules are comparable when co-expressed with csloα subunits (Ramanathan et al. 2000). It remains to be determined whether other candidates in the β subunit family exist within the chicken basilar papilla.
In order to vary macroscopic BK kinetics along a tonotopic gradient, individually expressed variants must be functionally distinct and differentially distributed along the papilla. A limited number of BK channels have been cloned from the chicken and expressed in HEK 293 cells (Ramanathan et al. 1999, 2000). Although these clones included only eight different isoforms (four α splice variants forming homomultimeric channels, each with and without β subunits), channel kinetics extended over a 50-fold range (Ramanathan et al. 2000). A recent model indicated that a continuum of resonant frequencies from ∼300 to ∼1100 Hz can be generated in chicken hair cells by simply mixing two kinetically distinct isoforms in each cell, αx-only and αx-plus-β, where x denotes a particular splice variant (Ramanathan & Fuchs, 2002). This model relies on the spatially restricted expression of α variants and the graded expression of β subunits. Recent reports verified the differential distribution of α splice variants in the chicken (Navaratnam et al. 1997; Rosenblatt et al. 1997) and the turtle (Jones et al. 1999b), although the resolution was low and the distributions appeared broad. Additionally, as required by the model, the distribution of β mRNA along the avian basilar papilla formed a gradient from predominance in the low-frequency apex to absence from the high-frequency base (Ramanathan et al. 1999).
Single-channel recordings from turtle hair cells have confirmed the graded distribution of channel kinetics in that species (Art et al. 1995), providing concrete physiological evidence for the native expression of distinct isoforms in an electrically tuned auditory epithelium. The combination of modelling, physiology and molecular techniques in the turtle preparation is particularly elegant because the encoded frequency range is restricted to less than 1 kHz, and the potential number of splice variants also seems limited (Jones et al. 1999b). A comparable examination of BK properties at the single-channel level in the chicken is critical because of the great number of splice variants, the extended auditory frequency range, the demonstrated gradation of β subunits, and the confounding presence of extrinsic mechanical tuning in the chicken basilar membrane (Fettiplace & Fuchs, 1999). In the present study, we have surveyed BK channel properties from hair cells along the chicken basilar papilla, to confirm the proposed tonotopic distribution of channel kinetics and to explore the extent of channel heterogeneity throughout the papilla. Single- and multi-channel recordings revealed the systematic gradation of channel kinetics necessary to produce a resonant frequency matched to the hair cell's tonotopic position. These data also indicated a high degree of heterogeneity in calcium sensitivities at single locations along the papilla. Interestingly, the calcium sensitivities of native channels were similar to cloned channels, yet the kinetics of the native channels were significantly faster than all cslo clones studied to date.
METHODS
Preparation
The care, maintenance, and treatment of animals in these studies followed protocols approved by the Institutional Animal Care and Use Committee of Johns Hopkins University. Post-hatch chicks (Gallus gallus), ranging from 2 to 9 days old, were anaesthetized by intramuscular injection with 0.4 ml of 50 % urethane. After 10 min, the chicks were killed by rapid decapitation. The external auditory canal and middle ear cavity were opened, revealing the base of the bony cochlear capsule. The basilar papilla was extracted through the oval window and immediately placed for 1 min in artificial perilymph (154 mm NaCl, 6 mm KCl, 5 mm CaCl2, 2 mm MgCl2, 5 mm Hepes, buffered to pH 7.4 with NaOH) supplemented with 0.01 % protease (Type XXIV, Sigma). Following this treatment, the basilar papilla was pinned in a Sylgard (Dow Corning Corp.)-coated dish filled with fresh artificial perilymph and microdissected to expose the sensory epithelium. Using fine minutien pins, serial segments of the papilla were isolated, each measuring 0.5–1 mm in length. Segments were mounted on coverslips and placed longitudinally under a pin with the hair bundles of the hair cells directed downward. One of these segments was selected and placed on the stage of an inverted microscope (Nikon Diaphot) fitted with Hoffman contrast enhanced optics.
Prior to recording, a large-tipped micropipette was used to clean debris and supporting cells from the basal surfaces of the hair cells. The segment was oriented such that recordings were taken from tall (afferently innervated) hair cells located along the superior edge of the papilla, with selected hair cells retaining a smooth, luminescent surface. Hair cell location was recorded using an ocular reticule, and measurements were reproducible to within 50 μm. Hair cell position was reported as the percentage distance from the apical end of the papilla.
Electrophysiology
Patch-clamp recordings were made using either an Axopatch-1A or Axopatch 200B amplifier (Axon Instruments), and data were acquired using pCLAMP 8 software (Axon Instruments). Glass electrodes were pulled from borosilicate capillaries (Drummond Scientific Co.) to achieve an electrical resistance of 2.5–6 MΩ for multi-channel patches and 10–15 MΩ for patches with a single BK channel. Electrodes were coated with ski-wax (SWIX) or Sylgard and filled with a high potassium saline buffered to 1 μm free [Ca2+] (Butler et al. 1993) (see below). This solution was also used in constructing an agar bridge to the bath electrode. After seal formation (> 1 GΩ), the patch was observed in cell-attached mode to discern the presence of BK channels in the patch. If channel openings were present with an approximate BK channel conductance, the artificial perilymph bath solution was exchanged with a high potassium saline (142 mm) and submicromolar free [Ca2+]. The patch was excised and the resulting vesicle was broken by brushing the electrode tip against a mound of Sylgard placed on the coverslip. The cytoplasmic surfaces of BK channels in inside-out patches were then washed with various solutions covering a range of free [Ca2+].
In some cases, solution exchange was accomplished by complete manual bath exchange (10 times bath volume). However, in later experiments, focal microperfusion via a quartz micromanifold (QMM, ALA Scientific Instruments, Westbury, NY, USA) delivered solutions directly to the patch electrode at a gentle, low flow rate. The manifold's output tube was 200 μm in diameter and was placed approximately 200 μm opposite the patch electrode. Up to eight different solutions could be individually delivered to the output tube, converging on a dead space of less than 1 μl. During long recordings, the slow flow rate reduced the change in capacitance caused by increasing the volume of fluid in the bath. Before the delivery of a new test solution, the manifold tip was moved away and the new solution was briefly flushed through the small dead space. The various calcium solutions were applied in random order.
Ensemble-averaged recordings from single- and multi-channel patches were obtained in order to determine activation and deactivation kinetics. Inside-out patches containing between 1 and 9 channels were voltage clamped and subjected to various protocols from which transient and steady-state BK properties could be determined for each calcium concentration. Typically, a given patch was exposed to five or more separate calcium solutions. Data were sampled at 20 kHz and low-pass filtered with a 4-pole Bessel filter at a 5 kHz cut-off frequency. Repeated presentations (50–300) were averaged and processed off-line to subtract stray capacitance currents. This was achieved by subtracting from the ensemble-average blank recordings for which no channel openings occurred during a single stimulus presentation (Art et al. 1995). However, these blank recordings were rare in the presence of high calcium. As an alternate method, single exponentials were fitted to voltage pulses to the potassium equilibrium potential (0 mV in the symmetric solutions), where current transients presumably result from capacitance only. This fit was combined with representations of seal resistance and piecewise linearly subtracted from each segment in a recording. Activation and deactivation rates could then be fitted, in most cases, with single exponentials. Curve fits and the determination of steady-state activation was accomplished using Clampfit in the pCLAMP 8 software suite (Axon Instruments). The number of channels per patch was estimated by dividing the maximum conductance in high calcium with the unit conductance obtained from single-channel openings in low open probability conditions.
Extended steady-state recordings were obtained from seven patches that contained only a single channel. Data were sampled at 50 kHz and low-pass filtered at 5 kHz. For each calcium concentration, approximately eight holding voltages were applied, covering the activation range of the channel and each lasting over 1 min in duration. Event idealization was made using half-amplitude threshold crossing, implemented in one or both of two software packages: TAC (Bruxton Corp.) or the QuB software suite (http://www.qub.buffalo.edu/). In most cases, 5–10 % of the recording was discarded due to instability of the channel, transitions to subconductance states, or brief sojourns into alternative gating modes. All recordings were made at room temperature (22–25 °C).
In a few cases, the apparent calcium sensitivity of the channel suddenly decreased. In these instances, the half-activating voltage for a particular calcium concentration shifted positively by more than 80 mV. These channels generally did not return to the higher activation mode. In one single-channel recording, calcium sensitivity returned and the reported data represent activity at the higher gating mode.
Solutions
Inside-out patches were exposed to symmetric potassium solutions containing 142 mm KCl, 0.5 mm MgCl2, 5 mm Hepes, 2 mm of an appropriate calcium buffer, and variable amounts of CaCl2 to give free calcium concentrations of 0.2–100 μm. Calcium buffers included EGTA for ∼0–0.75 μm free calcium, dibromoBAPTA (Molecular Probes Inc., Eugene, OR, USA) for 1–5 μm, and nitrilotriacetic acid for 20–100 μm. Solutions were set to a pH of 7.2 with KOH. MaxChelator software (Bers et al. 1994) was used to estimate the amount of CaCl2 necessary to achieve the desired free Ca2+ concentration. However, free Ca2+ was more precisely determined using a calcium electrode (Microelectrodes, Inc.) calibrated with multiple standard solutions ranging from 0.1 to 100 μm free Ca2+ (CALBUF-2, World Precision Instruments, Sarasota, FL, USA). Stock solutions were stored in the freezer (-4 °C) for up to 6 months and were constructed multiple times during the course of these experiments, calibrated each time with a new calcium electrode. There was no systematic relationship between various BK properties and the different stocks (data not shown). Unless noted otherwise, all chemicals were obtained from Sigma Chemical Co. (St Louis, MO, USA).
Statistical analyses
Where appropriate, Spearman rank tests were performed when exploring correlations between two variables, namely when determining the tonotopic distribution of various channel properties (e.g. conductance, calcium sensitivities, kinetics). Significant correlations are indicated by P values below 0.05. These analyses were conducted using Clampfit in the pCLAMP 8 software suite. Averaged results are reported as mean ± standard error of the mean (±s.e.m.).
RESULTS
To explore the tonotopic distribution of BK channel properties, inside-out patches were pulled from semi-intact epithelial preparations of the chicken basilar papilla where the originating hair cell's location could be precisely determined. Throughout the paper, hair cell (patch) location is expressed as percentage distance from the low-frequency apical end assuming a total papilla length of 4 mm. Data were collected from tall hair cells positioned near the superior edge of the papilla and located between 20 and 60 % from the apical end, covering a frequency range of 200–1000 Hz according to published tonotopic maps (Jones & Jones, 1995). Useful patches were difficult to obtain outside this region, due to a low BK expression density at the extreme apex and poor cellular viability toward the base.
Voltage and calcium-dependent steady-state activation
Continuous stretches of channel gating were obtained from seven patches containing single BK channels, and three of these patches were evaluated at eight or more holding voltages in each of four or more separate calcium concentrations. Data from one such single-channel patch are presented in Fig. 1. Segments of channel openings (upward in all cases) are shown for two calcium concentrations, applied to the cytosolic face of the channel (Fig. 1A and B). The calcium and voltage sensitivity of the BK channel is readily apparent in these traces, with increasing voltage and calcium driving the channel to higher open probabilities. The voltage dependence of the steady-state open probability (Po) followed a Boltzmann function:
| (1) |
where Pmax is the maximum open probability, V1/2 is the half-activating voltage, q is the gating charge, F is Faraday's constant, R is the universal gas constant and T is the absolute temperature (Fig. 1C). The half-activating voltage was approximately 70 mV in 1.0 μm[Ca2+], and −50 mV in 8.3 μm[Ca2+] (middle traces in Fig. 1A and B), illustrating the negative shift in channel activation with increasing calcium (Fig. 1D).
Figure 1. Single-channel currents from a hair cell BK channel in the inside-out patch configuration.
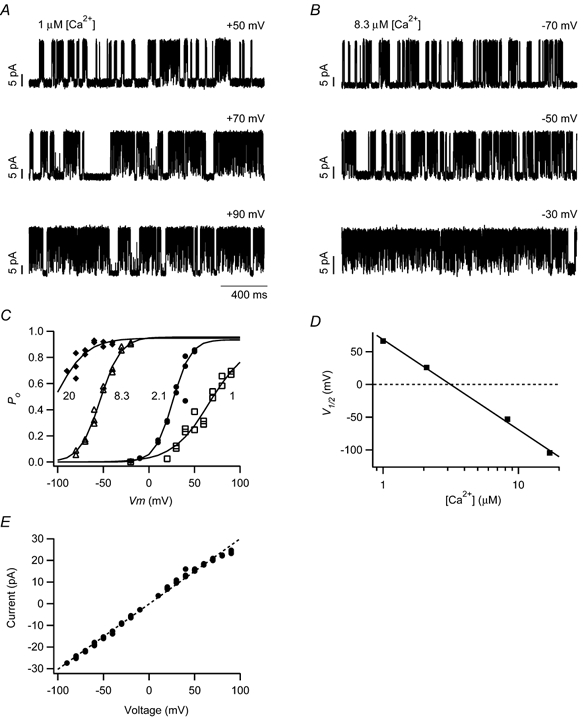
Single-channel currents are shown at three holding voltages for a patch exposed to 1 (A) and 8.3 μm[Ca2+] (B). In all cases, channel opening is upward. C, open probability (Po) was fitted with a single Boltzmann function (continuous lines) for each calcium concentration (indicated by numbers adjacent to curves, in μm). D, half-activating voltage (V1/2)from the Boltzmann fits is shown and fitted across the tested calcium concentrations using a logarithmic relationship predicted by a simple two-state model. The calcium concentration required for half-activation at 0 mV, KD(0), was determined to be 3.2 μm. E, current amplitude is plotted against holding voltage. Data from four separate calcium conditions are included in this plot. The curve fit (dashed line) indicates a single-channel conductance of 302 pS. Data in A-E are all from the same patch, taken from a hair cell at 36 % distance from the apical end.
The modelling of BK channel gating has become increasingly complex, such that a recent model includes 50 states in a two-tiered allosteric scheme (Rothberg & Magleby, 2000). Our goal in this effort is to make broad comparisons of channel properties along a sensory epithelium and to relate these results to those in other systems. Therefore we have characterized the channel's steady-state behaviour using a simplified two-state model with voltage-dependent binding at a single Ca2+ binding site (Cui et al. 1997). Considerable evidence for independent channel activation by calcium and voltage indicates that this model is extremely oversimplified (Cui & Aldrich, 2000; Rothberg & Magleby, 2000). However, the model provides a reasonable approximation to channel behaviour at moderate calcium concentrations (1–100 μm) (Cui et al. 1997; Ramanathan et al. 2000) and has utility for the comparative strategy here. For the simplest first-order process, steady-state activation becomes:
| (2) |
where KD(0) is the calcium concentration required for half-activation at 0 mV and δ is the electrical distance traversed by Ca2+ in the binding step. Using eqn (2), the relationship between half-activating voltage and calcium concentration is logarithmic:
| (3) |
The data in Fig. 1D were fitted using eqn (3), giving a value for KD(0) of 3.2 μm.
The single-channel current amplitude was plotted against voltage and fitted with a linear regression indicating a single-channel conductance of 302 pS (Fig. 1E). A small degree of rectification was commonly observed for large, positive voltages. The average single-channel conductance from 36 patches was 279 ± 4.3 pS. This average includes data from patches with multiple channels, where current amplitudes for single-channel openings were obtained when the voltage and calcium conditions resulted in a low open probability. Single-channel conductance did not vary with hair cell position along the papilla (ρ= 0.04, P= 0.83, n= 36). For comparison, unit conductance from a cloned cslo BK channel was approximately 224 pS (Jiang et al. 1997), whereas values of 320 and 286 pS were obtained for BK channels from turtle hair cells and turtle slo clones, respectively (Art et al. 1995; Jones et al. 1999b).
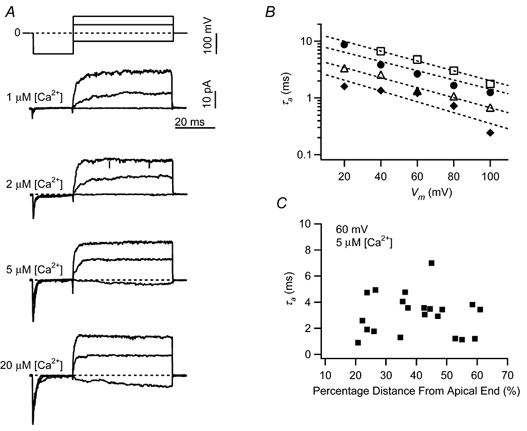
Patches containing multiple channels were found more frequently than those with single channels, leading to an analytical approach utilizing ensemble-averaged currents from multi-channel patches. Thirty-one patches, with an average of 3.3 ± 0.4 channels per patch (range: 1–9), were analysed in this way. Two representative examples are given in Fig. 2A–D. To explore steady-state calcium and voltage dependence, patches were subjected to activation protocols including an initial hyperpolarization followed by steps to a series of depolarizing voltages covering the channel's activation range at a particular calcium concentration. Activation currents are shown in Fig. 2A for a patch with three BK channels, presented with three different calcium conditions. Steady-state conductance, determined at the end of the activation steps, increased with voltage and calcium and could be fitted to Boltzmann functions using eqn (1), substituting conductance for open probability (Fig. 2B). A second patch, also containing three BK channels, is shown in Fig. 2C, to illustrate the range in BK properties among our data. One striking difference between these two patches is the calcium sensitivity, with half-activating voltages in 1 μm[Ca2+] of 69.7 and −9.3 mV for the patches in Fig. 2B and C, respectively. Moreover, the voltage activation curves for the patch in Fig. 2B shifted in a somewhat parallel fashion (i.e. the slopes from all curve fits were approximately equal), whereas voltage sensitivity relaxed for the patch in Fig. 2C as calcium concentration increased (i.e. curve-fit slopes decreased with increasing calcium). Half-activation voltages were plotted for the patches in Fig. 2B and C and fitted with logarithmic relationships (eqn (3)), giving KD(0) values of 11.6 and 0.4 μm, respectively. Calcium sensitivity for each patch is plotted in Fig. 2E as a function of tonotopic location. There was a significant tendency towards lower calcium sensitivity in patches from hair cells located toward the base of the papilla (ρ= 0.38, P < 0.05, n= 34). Interestingly, in a restricted sampling region, between 50 and 60 % distance from the apical end, calcium sensitivity extended over a 20-fold range, indicating a high degree of channel heterogeneity at a given location along the papilla. Mean KD(0) for the entire sample population was 6.5 ± 1.0 μm (n= 34), consistent with the value for cloned BK channels co-expressed with the β subunit (Ramanathan et al. 2000). It is noteworthy that channels with higher KD(0) were found in the most basal positions, as predicted by the low level of β subunit expression there (Ramanathan et al. 1999). Steady-state conductance at a specific membrane potential was related to calcium concentration using the Hill equation (data not shown). The average Hill coefficient was 2.5 ± 0.4 at −40 mV (n= 21) and 2.8 ± 0.5 at 40 mV (n= 13), closely approximating data from cloned channels consisting of α+β subunits (2.4 at −50 mV and 2.9 at 50 mV in Ramanathan et al. 2000).
Figure 2. BK channel calcium sensitivity from ensemble-averaged currents.
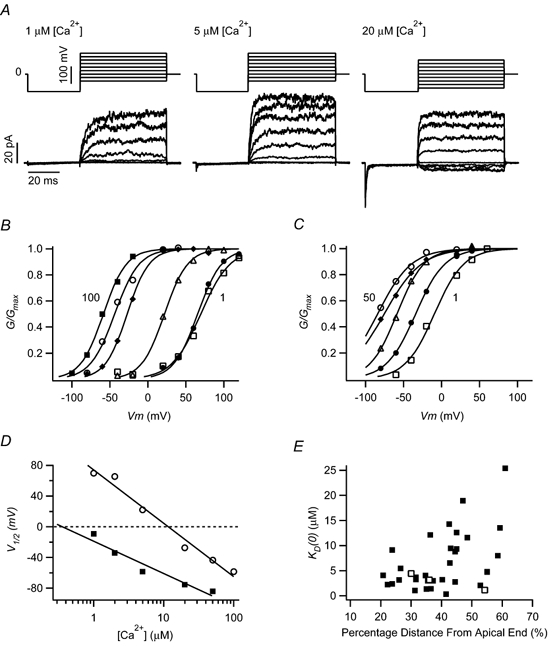
A, leak subtracted activation currents are shown for a single patch in three separate calcium conditions. Voltage protocols are shown above each set of current traces, each of which is the average of 50 stimulus presentations. In this protocol, the patch was initially stepped from a holding potential of 0 mV to −100 mV, closing any open channels. Activation voltages ranged from −40 mV to 120 mV in 1 and 5 μm[Ca2+], and from −80 mV to 80 mV in 20 μm[Ca2+]. This patch contained three BK channels and was taken from a hair cell located at 48.5 % distance from the apical end. B, conductance-voltage curves are plotted for the patch shown in A. Conductance was calculated from the steady-state current averaged over the final 10 ms of the activation commands. G/Gmax curves were fitted using single Boltzmann functions. Numbers placed next to some curves indicate extremes of tested calcium concentrations. Calcium concentrations: □, 1 μm; •, 2 μm; ▵, 5 μm; ♦, 20 μm; ○, 50 μm; ▪, 100 μm. C, G/Gmax curves for a second patch with approximately three BK channels from a hair cell located 41.5 % distance from the apical end. Calcium concentrations: □, 1 μm; •, 2 μm; ▵, 5 μm; ♦, 20 μm; ○, 50 μm. D, half-activating voltages were fitted with logarithmic relationships to [Ca2+], indicating a KD(0) for the patch in B (○) of 11.6 μm and that in C (▪) of 0.4 μm, respectively. E, calcium sensitivity for each patch, expressed as KD(0), is plotted according to the location from which that patch was taken along the basilar papilla: ▪, ensemble-averaged data from multi-channel patches; □, single-channel recordings.
The effect of β subunit co-assembly on half-activation voltage is more pronounced at higher calcium concentrations (Cox & Aldrich, 2000) such that the slope of the V1/2-[Ca2+] curve is much steeper with the addition of β. Therefore, the two-state model, relating V1/2 to [Ca2+], was used to further evaluate apparent calcium-dependent effects by calculating the dissociation constant, KD, at extremes of the V1/2 curve (+50 and −50 mV). This parameter was only weakly correlated with tonotopic location at −50 mV (ρ= 0.51, P= 0.08, n= 34), but more so at +50 mV (ρ= 0.43, P= 0.01, n= 34) (Fig. 3A). Average values for KD at +50 and −50 mV were 1.3 ± 0.2 and 36.7 ± 5.7 μm (n= 34), respectively. These values fall between those reported for a BK clone cslo-α0 with and without β (Ramanathan et al. 2000) and are similar to data from the turtle though these native chicken BK channels are less calcium sensitive at −50 mV (Art et al. 1995). This latter observation has important implications for the comparative physiology of chicken and turtle hair cells, where data are often synergistically combined for models of electrical tuning (Wu et al. 1995; Ramanathan & Fuchs, 2002).
Figure 3. Calcium binding parameters along the sensory epithelium.
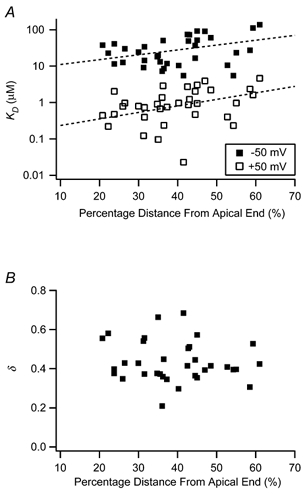
A, calcium sensitivity is plotted at holding potentials of −50 mV and +50 mV. These data were derived from logarithmic fits to V1/2-[Ca2+] curves, predicted by a two-state model. In many cases, it was necessary to extrapolate from these fits to estimate KD (23 % of patches for −50 mV and 42 % for +50 mV). The calcium concentration required for half-activation near the resting potential of the hair cell membrane ranges between approximately 5 and 100 μm. Dashed lines indicate exponential curve fits to the data of the form KD=A exp((%DAE)/B), where %DAE is the percentage distance from the apical end. Fit parameters: for +50 mV, A= 0.16, B= 24.3; for −50 mV, A= 8.2, B= 32.7. B, the energy consumed in the calcium binding process (δ) was estimated from the two-state model fits. This parameter was not tonotopically distributed.
The coassembly of α subunits with auxiliary β subunits not only affects apparent calcium sensitivity, but also modulates the voltage sensitivity of the steady-state response. In order to make broad comparisons within our data set and with previous reports, it is convenient to consider the simple two-state model represented by eqns (2) and (3), where voltage sensitivity is embedded in the electrical distance, δ. The model is at odds with the measured Hill coefficients, which suggest multiple calcium binding sites. However, the model adequately fits the data over the small range of intermediate calcium concentrations that was considered, and it allows comparisons with previous reports. When cslo clones were coexpressed with β subunits, δ was reduced from 0.5 to 0.3 (Ramanathan et al. 2000). However, when δ was determined for each patch in our data set, apically originating patches, where β mRNA is expressed at higher levels (Ramanathan et al. 1999), did not differ significantly from basally originating patches, where β is low or absent (ρ=−0.11, P= 0.53, n= 34) (Fig. 3B). In the two-state model, electrical distance is proportional to the gating charge (i.e. slope of the Boltzmann function) and is independent of calcium concentration. However, in our data (Fig. 2C) and in other reports (Cui et al. 1997; Cox & Aldrich, 2000; Ramanathan et al. 2000), voltage sensitivity often relaxes as calcium concentration is increased, and a more complex two-tiered gating scheme may be appropriate (Cox & Aldrich, 2000). An extensive study using BK channel clones from the mouse arrived at two central conclusions (Cox & Aldrich, 2000): (1) the voltage sensitivity of α-only BK channels is greater than that of α+β channels and (2) voltage sensitivity decreases with increasing calcium concentration, an effect that is more pronounced in α-only channels. Taken together, these observations would suggest the hypothesis that voltage sensitivity would increase along the chicken basilar papilla from apex to base, resulting from the falling gradient in β subunit expression. Furthermore, this tonotopic trend should be absent at high calcium concentrations, where voltage sensitivity is low and the differences between voltage sensitivity in channels with and without β subunits is minimized. Figure 4A plots the mean gating charge with respect to calcium concentration, where the apparent gating charge is estimated from fits to activation curves with single Boltzmann functions (eqn (1)). Here, q decreases significantly with higher calcium (one-way analysis of variance: F= 2.57, d.f. = 5, P < 0.05). Figure 4 also illustrates gating charge as a function of tonotopic location, in 2 μm[Ca2+] (Fig. 4B) or 20 μm[Ca2+] (Fig. 4C). From this figure, it is apparent that gating charge is tonotopically distributed at the lower calcium concentration, such that BK channels from apical hair cells on average have a greater sensitivity to voltage than more basal hair cells. No such trend is seen in high calcium, as confirmed by statistical analysis (1 μm: ρ=−0.49, P < 0.01, n= 29; 2 μm: ρ=−0.50, P < 0.05, n= 25; 5 μm: ρ=−0.17, P= 0.43, n= 25; 20 μm: ρ=−0.05, P= 0.81, n= 25; 50 μm: ρ=−0.17, P= 0.49, n= 20). Thus, one prediction was correct, namely that apex to base variations in voltage sensitivity are only present at low calcium concentrations. This distribution, however, is oriented in the opposite direction to that based on the behaviour of cloned BK channels. The data revealed a tendency in low calcium toward greater voltage sensitivity at the apex where β subunits are most highly expressed, while α-only clones are more voltage sensitive than α+β clones in similar calcium conditions.
Figure 4. Gating charge (q) from Boltzmann fits to activation curves.
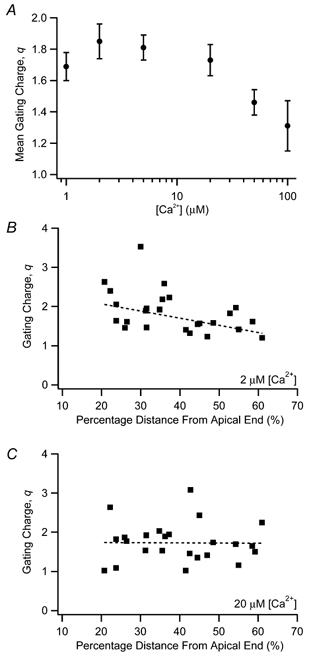
A, gating charge was averaged for all patches and plotted according to calcium concentration. Channels were less voltage sensitive at higher calcium concentrations. Gating charge is also plotted against the tonotopic location of each patch, when exposed to 2 (B) and 20 μm[Ca2+](C). For lower calcium concentrations as in B, channels from apical locations were more voltage sensitive than channels from basal locations. This tonotopic gradient was not evident in higher calcium concentrations, as in C. Dashed lines represent linear regressions to the data.
Activation and deactivation kinetics
Time-dependent activation and deactivation of BK channels is fundamentally important to the mechanism of electrical tuning (Art et al. 1995). Figure 5A shows activating voltage steps for a patch containing a single BK channel exposed to four different calcium concentrations. The rate of activation increased with greater depolarization and with greater amounts of free calcium. These curves could be fitted with single exponentials to obtain the activation time constants (τa) reported in Fig. 5B. Additional calcium simply shifted the τa-V curves down, maintaining an approximately constant gating charge (qf) of 0.50. A similar result was found for the activation of mslo channels expressed in oocytes (Cui et al. 1997), with an average qf of 0.47 and only a slight tendency toward smaller charge estimates with increasing calcium. The range of activation time constants, determined at 60 mV in 5 μm[Ca2+], was uniformly distributed among hair cell patches from apex to base (ρ=−0.04, P= 0.86, n= 21) (Fig. 5C).
Figure 5. Channel activation rate is calcium and voltage dependent, but is not dependent on tonotopic location.
A, example traces are shown for leak-subtracted, ensemble-averaged currents from activation protocols including a −100 mV pre-pulse and activation to −40, 40 or 80 mV. Activation rates increase with voltage and calcium concentration. These examples are similar to those in Fig. 2A, but in this case the patch contains a single BK channel from a hair cell located 22.3 % distance from the apical end. B, for the patch in A, the time constant for activation (τa) is shown at various command voltages and calcium concentrations. This time constant was derived from single exponential fits to the ensemble current. Dashed lines represent curve fits to τa=A exp(-(qf FV/RT)). Fit parameters for each [Ca2+]: □, 1 μm, A= 14.8, qf= 0.50; •, 2 μm, A= 9.3, qf= 0.47; ▵, 5 μm, A= 5.2, qf= 0.51; ♦, 20 μm, A= 3.2, qf= 0.55. C, the time constant for activation, for a constant voltage (60 mV) and calcium concentration (5 μm), is plotted according to the tonotopic location of the patch. There was no tonotopic distribution of activation rates. This observation was true for other voltage and calcium conditions as well.
Channel deactivation also is regulated by voltage and calcium. Patches were stepped to an activating voltage of 100 mV and then deactivated to voltage commands from 20 to −100 mV. Relaxation currents were averaged and normalized to the peak current at the onset of the deactivation step. Figure 6A shows an example for a patch exposed to 5 μm[Ca2+]. The rate of deactivation was faster for more negative voltage steps, and the effect of additional calcium was to shift the τd-V curve upward (Fig. 6B). The parallel nature of this shift indicated a constant backward gating charge, qb, for the patch, which in this case was approximately 0.42. The range in three additional patches was from 0.35 to 0.75. Similar data from turtle hair cells revealed a gating charge of 0.89 that was relatively constant among three patches exposed to 4 μm[Ca2+] (Art et al. 1995); notably, this value approximated that from whole-cell BK currents in the turtle (Art & Fettiplace, 1987). It is also interesting to compare these values from native chicken tissues with those obtained from cloned BK isoforms. For cslo expressed in HEK 293 cells, qb was 0.80 for the α0 splice variant and 0.58 for the α0β variant, both in 5 μm[Ca2+] (Ramanathan et al. 2000). In a two-state model with voltage-dependent forward and backward rate constants, the gating charge estimated from fitting steady-state activation curves (q) would approximate the sum of forward (qf) and backward (qb) gating charges estimated from kinetics. In fact, such a relationship exists for mslo channels, even though more complex models are required to fully describe channel behaviour (Cox & Aldrich, 2000). In our case, when kinetics and steady-state data were available from the same patch, the sum of qf and qb was approximately half q. This discrepancy possibly arises from underestimating the gating charges associated with kinetic rates since these were determined over intermediate voltage ranges (Fig. 5B and 6B) where contributions from forward and backward transitions become comparable.
Figure 6. Channel deactivation rate is calcium and voltage dependent and varies with tonotopic location.
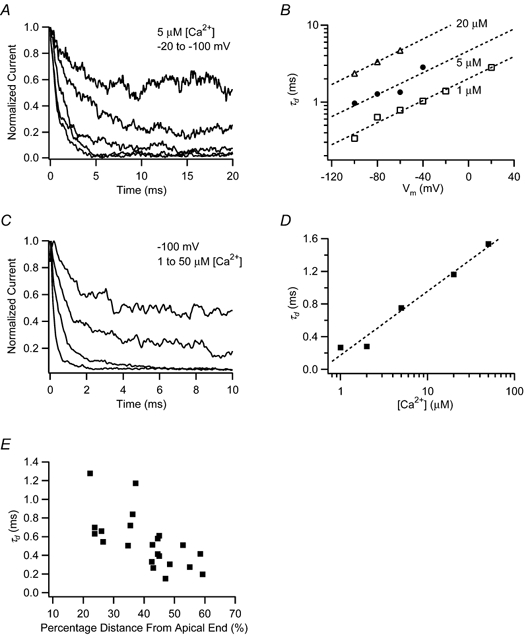
A, normalized, leak-subtracted, ensemble-averaged currents are shown for a patch containing approximately three channels and taken from a hair cell at 35.5 % distance from the apical end. The patch was stepped to deactivating voltages of −20 to −100 mV, following activation to 100 mV. Each trace represents the average from 50 stimulus presentations. Current relaxation was faster for more negative voltages. B, the time constant for deactivation (τd) was derived from single exponential fits to the relaxation currents and plotted against the deactivation voltage command. Numbers next to each curve indicate the calcium concentration presented to the patch. The time constant increased e-fold in approximately 60 mV, regardless of calcium concentration. Dashed lines represent fits to τd=A exp(qb FV/RT). Fit parameters for each [Ca2+]: □, 1 μm, A= 2.0, qb= 0.41; •, 5 μm, A= 4.6, qb= 0.41; ▵, 20 μm, A= 13.1, qb= 0.43. C, normalized currents are shown for a patch activated to 100 mV and then stepped to a deactivation voltage of −100 mV, while exposed to various calcium concentrations. Each trace represents the average of 80–100 stimulus presentations. Current relaxation was slower when the patch was exposed to higher calcium concentrations. D, time constants for deactivation to −100 mV are shown as a function of calcium concentration and fitted with a logarithmic relationship. A-D, all from the same patch. The dashed line represents a curve fit to τd=A ln([Ca2+]) +B. Fit parameters: A= 0.34 and B= 0.17. E, τd at 4 μm[Ca2+] and −100 mV is tonotopically distributed with faster deactivation rates for patches from hair cells from the high frequency end of the papilla.
In order to maximize the number of patches subjected to a deactivation protocol, the family of voltage steps in Fig. 6A was reduced to a single step from 100 to −100 mV (Fig. 6C). This voltage level was chosen to allow direct comparison with data available for eight BK channel variants of cslo expressed in HEK 293 cells (Ramanathan et al. 2000). Deactivation time constants increased logarithmically with greater [Ca2+] (Fig. 6D). Curve fits were used to interpolate time constants at 4 μm[Ca2+] so that data from all patches could be compared regardless of the exact calcium concentrations of the test solutions. Deactivation rate was systematically graded along the papilla such that BK channels from low frequency apical hair cells deactivated more slowly than those from the high frequency base (ρ=−0.70, P= 0.0001, n= 24) (Fig. 6E). This observation provides concrete support for the notion that intrinsic differences in the kinetic properties of BK channels contribute to the electrical tuning of the chicken basilar papilla.
Comparison between native and cloned BK channels
Theoretical models of electrical tuning rely on the mixing of distinct channel types to achieve a smooth gradation in channel properties along the basilar papilla (Wu et al. 1995; Ramanathan & Fuchs, 2002). One recent model for the chicken utilized data from four csloα variants, which were expressed with and without β subunits (Ramanathan et al. 2000; Ramanathan & Fuchs, 2002). The calcium sensitivities and deactivation rates for these cloned channels are summarized in Fig. 7, alongside the present BK channel data from chicken hair cells. Two points are readily apparent. First, these two parameters are tightly correlated, such that channels with a high affinity for calcium deactivate more slowly (ρ=−0.62, P= 0.001, n= 24). Second, there is no overlap between the native and cloned channels. While calcium affinities were similar, native channels with a given affinity consistently deactivated much faster than did the cloned channels. Interestingly, our data were primarily obtained from the apical half of the basilar papilla, where β subunits are most highly expressed. However, we never observed deactivation time constants in the order of tens of milliseconds as were found in the cloned α+β channels (Ramanathan et al. 2000). While there may be unknown effects on channel properties when expressing chicken clones in a mammalian cell line, these differences between native and cloned channels suggest that the native channels include additional subunits, or post-translational modifiers, not available to the heterologously expressed clones.
Figure 7. Native BK channel properties differ from those of cloned channels.
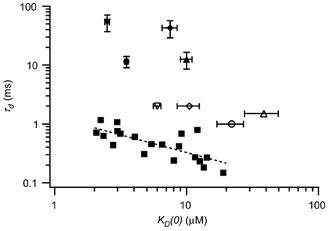
Deactivation time constant at 5 μm[Ca2+] and −100 mV is plotted against calcium sensitivity, KD(0), for hair cell patches with native BK channels (▪) and patches of cloned channels from cslo cDNAs (4 splice variants of the α subunit, with and without the avian β subunit; ○, α0; ▵, α4; ▿, α61; ⋄, α4–61–28; •, α0β; ▴, α4β; ▾, α61β; ♦, α4–61-28β). The dashed line represents a curve fit to the data from native channels, τd= 1.3(KD(0))- 0.60. Data from clones of the chicken BK channel cDNA were taken from Ramanathan et al. (2000). Although there is essentially no overlap, for both native and cloned channels the more calcium-sensitive patches deactivated more slowly. Error bars for data from cloned channels indicate one s.e.m. Vertical error bars for the α-only variants were extremely small and thus excluded from the graph.
Testing the electrical tuning hypothesis
Acoustic stimuli are resolved into their spectral components by the place-coding of frequency along the auditory sensory epithelium, such that the auditory nerve innervating a given hair cell is ‘tuned’ or maximally sensitive to a characteristic frequency (Fettiplace & Fuchs, 1999). If electrical resonance in the chicken hair cell's membrane is to be part of a tuning and amplification mechanism, then it is critical that the resonant frequency matches the tonotopic characteristic frequency of the hair cell. In order to make this comparison using our data, two transformations were necessary. First, the position of the hair cell from which the patch was taken was used to predict characteristic frequency using a tonotopic map developed from single unit recordings from auditory afferents (Jones & Jones, 1995). Second, channel kinetics were transformed into a prediction of resonant frequency, with the underlying assumption that the hair cell only expressed channels like those found within the membrane patch. To estimate this frequency, we employed data from the turtle that demonstrated a linear relationship between the hair cell's resonant frequency and the inverse, square root of the BK channel deactivation rate (τd−1/2) (Art & Fettiplace, 1987; Wu et al. 1995). This curve was adjusted to account for a difference in the deactivation voltages used for the turtle (-50 mV) and the chicken (-100 mV), by employing the reported voltage dependence of turtle BK deactivation rates (Art et al. 1995). Additionally, because our experiments were done at room temperature (∼22 °C), the prediction of resonant frequency from the turtle data was adjusted to account for the core temperature of the bird (∼40 °C). In separate reports, the temperature dependence of voltage oscillations in chicken hair cells (Fuchs & Evans, 1990) and the characteristic frequency of auditory nerve recordings in the chicken (Schermuly & Klinke, 1985) were similar, approximately doubling in frequency for each 10 °C increase in temperature (Q10= 2.0). Both studies indicated some degree of non-linearity in this relationship at higher temperatures (∼37 °C), such that over a wide temperature range the effective Q10 was approximately 1.5. Therefore, our calculations of resonant frequency were increased by a factor of 2.7. The resulting estimates of resonant and characteristic frequency for each patch are shown in Fig. 8. The two frequencies are strongly correlated (ρ=−0.69, P= 0.0001, n= 25), falling about the line of identity with some degree of scatter. The variance may result from inherent, moment-by-moment channel variance or error introduced in the data collection or analysis. Additionally, some amount of scatter may be attributed to the failure of an initial assumption, that the behaviour of the patch in fact does not mirror the macroscopic behaviour of the cell from which it was taken (i.e. the channels in the patch represent a kinetically distinct subset of channel variants expressed by the cell). Indeed, patches with few channels had the largest discrepancies between resonant and characteristic frequencies.
Figure 8. Estimates of resonant frequency match characteristic frequency according to tonotopic location.
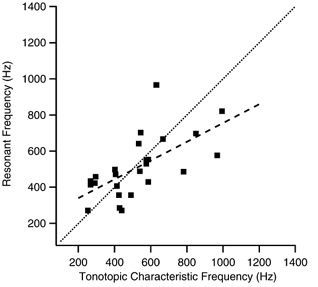
The resonant frequency for a hair cell expressing only those channels found in the inside-out patch was estimated using data collected from turtle hair cells (Art & Fettiplace, 1987; Wu et al. 1995) and corrected for effects of temperature. The characteristic frequency for the tonotopic position of the hair cell from which the patch was taken was calculated from the map of Jones & Jones (1995). Matched resonant and characteristic frequencies would fall along a line of identity (dotted line). A least-squares, linear regression fit to the data (dashed line) gave a slope of 0.52.
DISCUSSION
The avian basilar papilla is a unique structure, presumably combining a mechanical tuning mechanism extrinsic to the hair cell (i.e. basilar membrane motion) with intrinsic tuning from membrane electrical resonance (Fettiplace & Fuchs, 1999). It remains to be determined whether electrical tuning in the chicken plays a significant role in the filtered response of auditory nerve fibres, but it is clear that ionic currents do vary along the tonotopic axis to produce a smooth gradient in electrical resonance (Fuchs & Evans, 1990; Murrow, 1994; Pantelias et al. 2001). The prevalence of β subunit expression at the apex of the chicken basilar papilla (Ramanathan et al. 1999) suggested an apex to base gradient of decreasing BK channel calcium sensitivity and increasing deactivation rate (McManus et al. 1995; Jones et al. 1999b; Ramanathan et al. 1999, 2000; Cox & Aldrich, 2000). In fact, the distributed expression of the β subunit along the sensory epithelium is a critical component of models of electrical tuning (Ramanathan & Fuchs, 2002). In this paper, we provide direct evidence for the tonotopic distribution of calcium affinity and deactivation kinetics in native BK channels from hair cells of the chicken's basilar papilla. While the distribution of channel properties generally agrees with that predicted by β subunit expression gradients, some specific features of channel gating do not. Most striking are the more rapid kinetics of native BK channels with a given calcium affinity, compared with heterologously expressed clones.
Differences between cloned and native channels
In a previous series of experiments, BK channels were cloned from the chicken basilar papilla and heterologously expressed in HEK 293 cells (Ramanathan et al. 1999, 2000). These reports listed the distinct properties of four alternative splice variants of the pore-forming α subunit and described the effect of coassembly with β subunits, namely greater apparent calcium affinity and slower deactivation rates. For expressed channels, the most prominent effect of β subunit modulation was the slowing of deactivation rates from approximately 1 ms to greater than 10 ms at a membrane potential of −100 mV and in 5 μm‘cytosolic’[Ca2+]. However, we never observed deactivation rates in native chicken BK channels of the order of tens of milliseconds. Additionally, β subunits modify measures of steady-state voltage sensitivity, particularly at low calcium concentrations (Cox & Aldrich, 2000; Ramanathan et al. 2000), and thus, we expected an apex to base gradient in electrical distance and gating charge. Electrical distance was calculated from fits to V1/2-[Ca2+] curves, assuming that voltage dependence resided solely in a single calcium binding step. This restricted model is inappropriate for BK channels, but it is suitable for our small range of intermediate calcium concentrations (Cui et al. 1997) and is useful for comparison with similar analyses elsewhere (Ramanathan et al. 2000). Values for electrical distance for native channels were comparable to those reported for α-only and α+β clones (native range: 0.2–0.7; α0-only: 0.5; α0+β: 0.3) but were uniformly distributed along the length of the papilla (Fig. 3B). Gating charge, a related measure of voltage sensitivity, was independently estimated from Boltzmann fits to steady-state conductance curves at each separate calcium condition. The presence of β subunits on mslo BK channels results in a reduced apparent gating charge, particularly in low calcium conditions (Cox & Aldrich, 2000). Thus, we also expected an apex to base gradient in this parameter at low [Ca2+]. Data from native channels confirmed a position-dependent trend in gating charge, but this trend was in the opposite direction from that predicted by the presumed β subunit expression gradient (decreasing rather than increasing from apex to base). The sum of these discrepancies between observed properties and expected β subunit effects ultimately persuades us that the β subunit was either absent from our channels, present at low stoichiometries, or acting in a manner uncharacteristic of β subunits in other systems. If our sample population is representative of channels throughout this region of the basilar papilla, the β subunit may not play the critical role in electrical tuning that has been ascribed to it (Wu et al. 1995; Ramanathan et al. 1999; Ramanathan & Fuchs, 2002); perhaps other splice variants or additional subunits are required.
Overall, the characteristics of the native channels did not match any of the eight cloned channel configurations investigated to date (Fig. 7). Interestingly, a similar conclusion was drawn from comparisons of cloned and native BK channels from the turtle basilar papilla, where native channels also exhibited faster kinetics and higher calcium affinities than cloned counterparts (Art et al. 1995; Jones et al. 1999b). This discrepancy may result from a variety of factors, including differing post-translational effects intrinsic to the hair cells or the expression systems and the potential for novel splice variants or auxiliary subunits that may confer higher calcium affinity and faster gating kinetics. In order to develop a useful model using heterologous expression, it is critical to further detail the properties of naturally occurring BK channel variants.
Comparison of resonant versus characteristic frequency
The resonant frequency, predicted by the kinetics of native channels in the membrane patch, reasonably matched the characteristic frequency determined by the tonotopic position of the originating hair cell. Estimates of resonant and characteristic frequencies relied heavily on a number of transformations, and the appropriateness of these manipulations needs to be assessed. Characteristic frequency was determined based on the position of the hair cell from which the patch was taken. Any error associated with this measurement was random and within 100 μm, given observer variability and slight damage to the tissue during preparation. Conversion of hair cell position from micrometres to percentage distance from the apical end was accomplished using a total papilla length of 4 mm, which is consistent within the narrow range of animal ages contributing to this study (Cotanche & Sulik, 1985). Hair cell position was used to estimate characteristic frequency via a tonotopic map provided by Jones & Jones (1995). Their map, developed for embryonic chicks (E19), was comparable to data from post-hatch chicks up to 21 days old (Manley et al. 1987). There is evidence that this single map also applies to 120-day-old animals (Chen et al. 1994; Manley, 1996), eliminating the potential for error in characteristic frequency estimates due to age-related effects.
Transforming deactivation kinetics into a prediction of resonant frequency required a number of assumptions. First, implicit in this prediction is an assumption that the channels in the membrane patch are representative of those expressed by the originating hair cell, in type and proportion. This may be a poor assumption if a single hair cell expresses an array of distinct splice variants, coassembled with β subunits to varying degrees. Second, the use of data from the turtle cochlea, relating deactivation rate at −50 mV and 4 μm[Ca2+], assumes that the mechanism for electrical tuning in the turtle is essentially the same in the chicken. Furthermore, our data were collected at various calcium concentrations and a different voltage level (-100 mV) from those for the turtle. Deactivation rate at 4 μm[Ca2+] was determined from curve fits (see example in Fig. 6D). The voltage differences were accounted for by transforming the turtle data to −100 mV, using a relationship between voltage and deactivation that was consistent among three separate single-channel patches from turtle hair cells (Art et al. 1995). Finally, resonant frequencies were adjusted to compensate for differences between experiments conducted at room temperature (∼22 °C) and the core body temperature of the bird (40 °C). These transformations are possible sources of error but would have only slight effects on the degree of scatter in the data.
There is substantial heterogeneity in the data set with regard to numerous parameters (see, for example, Figs 2E, 3 and 8). Possible sources for this heterogeneity include slow fluctuations in the intrinsic behaviour of individual channels, variation between channels within a given hair cell, and variation between cells at a given location in the epithelium. Wanderlust kinetics, slow fluctuations in channel open probability, are characteristic of BK channels (Silberberg et al. 1996), giving rise to a large variability in behaviour for a single channel over time and among a population of similar channels. In our single-channel recordings, sudden and dramatic shifts in the apparent calcium sensitivity were occasionally observed, such that steady-state activation curves shifted positively by about 80 mV. The prior activity level rarely returned. In most cases, however, open probability was quite stable, and repeated measures in multiple and single-channel patches were consistent. Variance in our data, particularly with respect to a single location along the sensory epithelium, also could arise from patches that contained only a subset of the full variety of channels expressed by the cell. These patches, therefore, would differ from the whole-cell kinetics and thus could underestimate or overestimate the resonant frequency from which that patch arose. Patches with few channels had the largest differences between resonant and characteristic frequencies, but a clear relationship between this difference and channel density within the patch could not be determined. Finally, heterogeneity could be the natural result of variance between hair cells at a given location in the epithelium. One survey of electrical tuning in the chicken basilar papilla revealed a wide range in resonant frequencies at discrete points along the epithelium, and this range could account for a large degree of variance in our data set (Pantelias et al. 2001).
Alternative splicing of the mRNA encoding the BK channel α subunit (Lagrutta et al. 1994; Tseng-Crank et al. 1994; Navaratnam et al. 1997; Rosenblatt et al. 1997; Jones et al. 1999a) and modulation by accessory β subunits (Vogalis et al. 1996; Cox & Aldrich, 2000; Ramanathan et al. 2000; Wang et al. 2002) create the potential for an enormous number of functionally distinct channels. The number of potentially distinct channels in the chicken basilar papilla is staggering, given the recent description of up to 15 alternative exons in that tissue (Navaratnam et al. 1997; Rosenblatt et al. 1997). However, the extent to which each, or many, of these channel isoforms is actually expressed by native hair cells remains unknown. The heterogeneity in our recordings limits our ability to remark about the molecular constituents of the channels in our data set, but the variance and systematic gradation in deactivation kinetics confirms that chicken hair cells capitalize on the ability to express various configurations of functionally distinct BK channels. Further examination of naturally occurring α subunit splice variants may reveal a range of channel properties that include those exhibited by the native channels described in this study. However, the substantial discrepancies between the properties of native and cloned channels imply that additional auxiliary subunits remain to be discovered.
Acknowledgments
This work was supported by grants from the National Institute of Deafness and Communication Disorders (no. DC00276 to P.A.F. and training grant no. T32 00023).
REFERENCES
- Art JJ, Fettiplace R. Variation of membrane properties in hair cells isolated from the turtle cochlea. J Physiol. 1987;385:207–242. doi: 10.1113/jphysiol.1987.sp016492. [DOI] [PMC free article] [PubMed] [Google Scholar]
- Art JJ, Wu YC, Fettiplace R. The calcium-activated potassium channels of turtle hair cells. J Gen Physiol. 1995;105:49–72. doi: 10.1085/jgp.105.1.49. [DOI] [PMC free article] [PubMed] [Google Scholar]
- Atkinson NS, Robertson GA, Ganetzky B. A component of calcium-activated potassium channels encoded by the Drosophila slo locus. Science. 1991;253:551–555. doi: 10.1126/science.1857984. [DOI] [PubMed] [Google Scholar]
- Bers DM, Patton CW, Nuccitelli R. A practical guide to the preparation of Ca2+ buffers. Methods Cell Biol. 1994;40:3–29. doi: 10.1016/s0091-679x(08)61108-5. [DOI] [PubMed] [Google Scholar]
- Butler A, Tsunoda S, McCobb DP, Wei A, Salkoff L. mSlo, a complex mouse gene encoding ‘maxi’ calcium-activated potassium channels. Science. 1993;261:221–224. doi: 10.1126/science.7687074. [DOI] [PubMed] [Google Scholar]
- Chen L, Salvi R, Shero M. Cochlear frequency-place map in adult chickens: Intracellular biocytin labelling. Hear Res. 1994;81:130–136. doi: 10.1016/0378-5955(94)90160-0. [DOI] [PubMed] [Google Scholar]
- Cotanche DA, Sulik KK. Parameters of growth in the embryonic and neonatal chick basilar papilla. Scan Electron Microsc. 1985;1:407–417. [PubMed] [Google Scholar]
- Cox DH, Aldrich RW. Role of the beta1 subunit in large-conductance Ca2+-activated K+ channel gating energetics. Mechanisms of enhanced Ca2+ sensitivity. J Gen Physiol. 2000;116:411–432. doi: 10.1085/jgp.116.3.411. [DOI] [PMC free article] [PubMed] [Google Scholar]
- Crawford AC, Fettiplace R. The frequency selectivity of auditory nerve fibres and hair cells in the cochlea of the turtle. J Physiol. 1980;306:79–125. doi: 10.1113/jphysiol.1980.sp013387. [DOI] [PMC free article] [PubMed] [Google Scholar]
- Cui J, Aldrich RW. Allosteric linkage between voltage and Ca2+-dependent activation of BK-type mslo1 K+ channels. Biochemistry. 2000;39:15612–15619. doi: 10.1021/bi001509+. [DOI] [PubMed] [Google Scholar]
- Cui J, Cox DH, Aldrich RW. Intrinsic voltage dependence and Ca2+ regulation of mslo large conductance Ca-activated K+ channels. J Gen Physiol. 1997;109:647–673. doi: 10.1085/jgp.109.5.647. [DOI] [PMC free article] [PubMed] [Google Scholar]
- Dworetzky SI, Trojnacki JT, Gribkoff VK. Cloning and expression of a human large-conductance calcium-activated potassium channel. Brain Res Mol Brain Res. 1994;27:189–193. doi: 10.1016/0169-328x(94)90203-8. [DOI] [PubMed] [Google Scholar]
- Fettiplace R, Fuchs PA. Mechanisms of hair cell tuning. Annu Rev Physiol. 1999;61:809–834. doi: 10.1146/annurev.physiol.61.1.809. [DOI] [PubMed] [Google Scholar]
- Fuchs PA, Evans MG. Potassium currents in hair cells isolated from the cochlea of the chick. J Physiol. 1990;429:529–551. doi: 10.1113/jphysiol.1990.sp018271. [DOI] [PMC free article] [PubMed] [Google Scholar]
- Fuchs PA, Nagai T, Evans MG. Electrical tuning in hair cells isolated from the chick cochlea. J Neurosci. 1988;8:2460–2467. doi: 10.1523/JNEUROSCI.08-07-02460.1988. [DOI] [PMC free article] [PubMed] [Google Scholar]
- Issa NP, Hudspeth AJ. Clustering of Ca2+ channels and Ca2+-activated K+ channels at fluorescently labeled presynaptic active zones of hair cells. Proc Natl Acad Sci U S A. 1994;91:7578–7582. doi: 10.1073/pnas.91.16.7578. [DOI] [PMC free article] [PubMed] [Google Scholar]
- Jiang GJ, Zidanic M, Michaels RL, Michael TH, Griguer C, Fuchs PA. CSlo encodes calcium-activated potassium channels in the chick's cochlea. Proc R Soc Lond B Biol Sci. 1997;264:731–737. doi: 10.1098/rspb.1997.0104. [DOI] [PMC free article] [PubMed] [Google Scholar]
- Jones EM, Gray-Keller M, Art JJ, Fettiplace R. The functional role of alternative splicing of Ca2+-activated K+ channels in auditory hair cells. Ann N Y Acad Sci. 1999a;868:379–385. doi: 10.1111/j.1749-6632.1999.tb11299.x. [DOI] [PubMed] [Google Scholar]
- Jones EM, Gray-Keller M, Fettiplace R. The role of Ca2+-activated K+ channel spliced variants in the tonotopic organization of the turtle cochlea [see comments] J Physiol. 1999b;518:653–665. doi: 10.1111/j.1469-7793.1999.0653p.x. [DOI] [PMC free article] [PubMed] [Google Scholar]
- Jones SM, Jones TA. The tonotopic map in the embryonic chicken cochlea. Hear Res. 1995;82:149–157. doi: 10.1016/0378-5955(94)00173-n. [DOI] [PubMed] [Google Scholar]
- Lagrutta A, Shen KZ, North RA, Adelman JP. Functional differences among alternatively spliced variants of Slowpoke, a Drosophila calcium-activated potassium channel. J Biol Chem. 1994;269:20347–20351. [PubMed] [Google Scholar]
- Latorre R, Oberhauser A, Labarca P, Alvarez O. Varieties of calcium-activated potassium channels. Annu Rev Physiol. 1989;51:385–399. doi: 10.1146/annurev.ph.51.030189.002125. [DOI] [PubMed] [Google Scholar]
- Lewis RS, Hudspeth AJ. Voltage- and ion-dependent conductances in solitary vertebrate hair cells. Nature. 1983;304:538–541. doi: 10.1038/304538a0. [DOI] [PubMed] [Google Scholar]
- McManus OB, Helms LM, Pallanck L, Ganetzky B, Swanson R, Leonard RJ. Functional role of the beta subunit of high conductance calcium-activated potassium channels. Neuron. 1995;14:645–650. doi: 10.1016/0896-6273(95)90321-6. [DOI] [PubMed] [Google Scholar]
- Manley GA. Ontogeny of frequency mapping in the peripheral auditory system of birds and mammals: A critical review. Aud Neurosci. 1996;3:199–214. [Google Scholar]
- Manley GA, Brix J, Kaiser A. Developmental stability of the tonotopic organization of the chick's basilar papilla. Science. 1987;237:655–656. doi: 10.1126/science.3603046. [DOI] [PubMed] [Google Scholar]
- Murrow BW. Position-dependent expression of potassium currents by chick cochlear hair cells. J Physiol. 1994;480:247–259. doi: 10.1113/jphysiol.1994.sp020357. [DOI] [PMC free article] [PubMed] [Google Scholar]
- Navaratnam DS, Bell TJ, Tu TD, Cohen EL, Oberholtzer JC. Differential distribution of Ca2+-activated K+ channel splice variants among hair cells along the tonotopic axis of the chick cochlea. Neuron. 1997;19:1077–1085. doi: 10.1016/s0896-6273(00)80398-0. [DOI] [PubMed] [Google Scholar]
- Nelson MT, Cheng H, Rubart M, Santana LF, Bonev AD, Knot HJ, Lederer WJ. Relaxation of arterial smooth muscle by calcium sparks. Science. 1995;270:633–637. doi: 10.1126/science.270.5236.633. [DOI] [PubMed] [Google Scholar]
- Nimigean CM, Magleby KL. The beta subunit increases the Ca2+ sensitivity of large conductance Ca2+-activated potassium channels by retaining the gating in the bursting states. J Gen Physiol. 1999;113:425–440. doi: 10.1085/jgp.113.3.425. [DOI] [PMC free article] [PubMed] [Google Scholar]
- Oberst C, Weiskirchen R, Hartl M, Bister K. Suppression in transformed avian fibroblasts of a gene (CO6) encoding a membrane protein related to mammalian potassium channel regulatory subunits. Oncogene. 1997;14:1109–1116. doi: 10.1038/sj.onc.1200930. [DOI] [PubMed] [Google Scholar]
- Pantelias AA, Monsivais P, Rubel EW. Tonotopic map of potassium currents in chick auditory hair cells using an intact basilar papilla. Hear Res. 2001;156:81–94. doi: 10.1016/s0378-5955(01)00269-6. [DOI] [PubMed] [Google Scholar]
- Ramanathan K, Fuchs PA. Modeling hair cell tuning by expression gradients of potassium channel beta subunits. Biophys J. 2002;82:64–75. doi: 10.1016/S0006-3495(02)75374-5. [DOI] [PMC free article] [PubMed] [Google Scholar]
- Ramanathan K, Michael TH, Fuchs PA. Beta subunits modulate alternatively spliced, large conductance, calcium-activated potassium channels of avian hair cells. J Neurosci. 2000;20:1675–1684. doi: 10.1523/JNEUROSCI.20-05-01675.2000. [DOI] [PMC free article] [PubMed] [Google Scholar]
- Ramanathan K, Michael TH, Jiang GJ, Hiel H, Fuchs PA. A molecular mechanism for electrical tuning of cochlear hair cells. Science. 1999;283:215–217. doi: 10.1126/science.283.5399.215. [DOI] [PubMed] [Google Scholar]
- Roberts WM, Jacobs RA, Hudspeth AJ. Colocalization of ion channels involved in frequency selectivity and synaptic transmission at presynaptic active zones of hair cells. J Neurosci. 1990;10:3664–3684. doi: 10.1523/JNEUROSCI.10-11-03664.1990. [DOI] [PMC free article] [PubMed] [Google Scholar]
- Robitaille R, Garcia ML, Kaczorowski GJ, Charlton MP. Functional colocalization of calcium and calcium-gated potassium channels in control of transmitter release. Neuron. 1993;11:645–655. doi: 10.1016/0896-6273(93)90076-4. [DOI] [PubMed] [Google Scholar]
- Rosenblatt KP, Sun ZP, Heller S, Hudspeth AJ. Distribution of Ca2+-activated K+ channel isoforms along the tonotopic gradient of the chicken's cochlea. Neuron. 1997;19:1061–1075. doi: 10.1016/s0896-6273(00)80397-9. [DOI] [PubMed] [Google Scholar]
- Rothberg BS, Magleby KL. Voltage and Ca2+ activation of single large-conductance Ca2+-activated K+ channels described by a two-tiered allosteric gating mechanism. J Gen Physiol. 2000;116:75–99. doi: 10.1085/jgp.116.1.75. [DOI] [PMC free article] [PubMed] [Google Scholar]
- Schermuly L, Klinke R. Change of characteristic frequency of pigeon primary auditory afferents with temperature. J Comp Physiol A. 1985;156:209–211. [Google Scholar]
- Silberberg SD, Lagrutta A, Adelman JP, Magleby KL. Wanderlust kinetics and variable Ca2+-sensitivity of dSlo, a large conductance Ca2+-activated K+ channel, expressed in oocytes. Biophys J. 1996;71:2640–2651. [PMC free article] [PubMed] [Google Scholar]
- Tseng-Crank J, Foster CD, Krause JD, Mertz R, Godinot N, Dichiara TJ, Reinhart PH. Cloning, expression, and distribution of functionally distinct Ca2+-activated K+ channel isoforms from human brain. Neuron. 1994;13:1315–1330. doi: 10.1016/0896-6273(94)90418-9. [DOI] [PubMed] [Google Scholar]
- Vergara C, Latorre R, Marrion NV, Adelman JP. Calcium-activated potassium channels. Curr Opin Neurobiol. 1998;8:321–329. doi: 10.1016/s0959-4388(98)80056-1. [DOI] [PubMed] [Google Scholar]
- Vogalis F, Vincent T, Qureshi I, Schmalz F, Ward MW, Sanders KM, Horowitz B. Cloning and expression of the large-conductance Ca2+-activated K+ channel from colonic smooth muscle. Am J Physiol. 1996;271:G629–639. doi: 10.1152/ajpgi.1996.271.4.G629. [DOI] [PubMed] [Google Scholar]
- Wang YW, Ding JP, Xia XM, Lingle CJ. Consequences of the stoichiometry of Slo1 alpha and auxiliary beta subunits on functional properties of large-conductance Ca2+-activated K+ channels. J Neurosci. 2002;22:1550–1561. doi: 10.1523/JNEUROSCI.22-05-01550.2002. [DOI] [PMC free article] [PubMed] [Google Scholar]
- Wu YC, Art JJ, Goodman MB, Fettiplace R. A kinetic description of the calcium-activated potassium channel and its application to electrical tuning of hair cells. Prog Biophys Mol Biol. 1995;63:131–158. doi: 10.1016/0079-6107(95)00002-5. [DOI] [PubMed] [Google Scholar]
- Wu YC, Fettiplace R. A developmental model for generating frequency maps in the reptilian and avian cochleas. Biophys J. 1996;70:2557–2570. doi: 10.1016/S0006-3495(96)79827-2. [DOI] [PMC free article] [PubMed] [Google Scholar]