

Abstract
In this study the effects of oxidation and reduction on various steps in the excitation-contraction (E–C) coupling sequence was examined in mammalian skeletal muscle. In mechanically skinned fast-twitch fibres, electric field stimulation was used to generate action potentials in the sealed transverse-tubular (T-) system, thereby eliciting twitch responses, which are a sensitive measure of Ca2+ release. Treatment of fibres with the oxidant H2O2 (200 μm and 10 mm) for 2–5 min markedly potentiated caffeine-induced Ca2+ release and the force response to partial depolarisation of the T-system (by solution substitution). Importantly, such H2O2 treatment had no effect at all on any aspect of the twitch response (peak amplitude, rate of rise, decay rate constant and half-width), except in cases where it interfered with the T-system potential or voltage-sensor activation, resulting in a reduction or abolition of the twitch response. Exposure to strong thiol reductants, dithiothreitol (DTT, 10 mm) and reduced glutathione (GSH, 5 mm), did not affect the twitch response over 5 min, nor did varying the glutathione ratio (reduced to oxidised glutathione) from the level present endogenously in the cytosol of a rested fibre (30:1) to the comparatively oxidised level of 3:1. In fibres that had been oxidised by H2O2 (10 mm) (or by 2,2′-dithiodipyridine, 100 μm), exposure to GSH (5 mm) caused potentiation of twitch force (by ∼20 % for H2O2); this effect was due to the increase in the Ca2+ sensitivity of the contractile apparatus that occurs under such circumstances and was fully reversed by subsequent exposure to 10 mm DTT. We conclude that: (a) the redox potential across the sarcomplamsic reticulum has no noticeable direct effect on normal E–C coupling in mammalian skeletal muscle, (b) oxidising the Ca2+-release channels and greatly increasing their sensitivity to Ca2+-induced Ca2+ release does not alter the amount of Ca2+ released by an action potential and (c) oxidation potentiates twitches by a GSH-mediated increase in the Ca2+ sensitivity of the contractile apparatus.
There have been many suggestions about the importance and possible role(s) of oxidation in normal skeletal muscle function and muscle fatigue (Barclay & Hansel, 1991; Salama et al. 1992; Andrade et al. 1998; Feng et al. 2000; Reid, 2001; Oba et al. 2002), but there is little consensus. This is in large part due to major disparities between findings in isolated systems (e.g. single Ca2+-release channels, sarcoplasmic reticulum (SR) vesicles or contractile apparatus) and those in intact muscle fibres. In isolated systems it is possible to tightly control the redox conditions and examine the effects on particular molecular events, but it is quite uncertain whether such findings can be validly extrapolated to the level of a functioning muscle fibre. For example, many studies have shown that oxidation of isolated ryanodine receptors (RyRs), with H2O2, reactive disulphides such as dithiodipyridine (DTDP) or other agents, greatly increases their sensitivity to activation by ‘cytoplasmic’ Ca2+ (Zaidi et al. 1989; Favero et al. 1995; Eager et al. 1997; Oba et al. 2002), but it is quite unclear whether this is directly relevant to normal excitation–contraction (E–C) coupling in skeletal muscle, where Ca2+ release from the SR is primarily or exclusively under the control of the voltage sensors in the transverse-tubular (T-) system (Melzer et al. 1995). Normally, cytoplasmic Ca2+ by itself does not readily activate SR Ca2+ release in functioning muscle fibres, particularly mammalian muscle fibres, in the presence of physiological [Mg2+] (∼1 mm free) and SR Ca2+ loading levels (Endo, 1985; Lamb & Stephenson, 1990; Shirokova et al. 1998; Lamb et al. 2001), although it may play a role in greatly reinforcing Ca2+ release if the voltage sensors are activated (Lamb & Stephenson, 1991, 1994; Lamb, 2000). It is possible that the normal mechanism of controlling Ca2+ release is altered by oxidation, as oxidation has been found to reduce the inhibitory effect of cytoplasmic Mg2+ in isolated RyRs (Donoso et al. 2000) and high concentrations of oxidants have been found to prevent activation of isolated RyRs (Favero et al. 1995; Eager et al. 1997).
Studies on intact fibres give important information about the effects of oxidation on E–C coupling, although the interpretation is not always straightforward. Reid et al. (1993) observed that twitch responses in the diaphragm were abolished by high extracellular concentrations of catalase, a scavenger of H2O2, and potentiated by addition of H2O2, and proposed that this showed that E–C coupling required some level of oxidation of the cytosol for optimal performance. Oba et al. (1996) similarly showed that twitch responses in frog fibres were potentiated by the addition of 1.5 mm H2O2, with higher concentrations (6 mm) causing greater potentiation and then inhibition of twitches. Although the twitch potentiation might seem to be explained by oxidation-induced increases in the sensitivity of the Ca2+-release channels (see above), Andrade et al. (1998) subsequently showed that the analogous potentiation of submaximal tetanic responses occurring in intact murine fibres with H2O2 treatment was not due to an increase in cytoplasmic [Ca2+], but instead to an increase in the Ca2+ sensitivity of the contractile apparatus. The lack of substantial effect of the H2O2 treatment on Ca2+ release in the intact fibres (Andrade et al. 1998) might reflect that: (a) the release channels in situ for some reason are resistant to being oxidised and sensitised, perhaps because they are coupled to the voltage sensors in the T-system, (b) the oxidant was not present at a sufficiently high concentration or was scavenged before reaching the release channels, or (c) most or all of the release channels were oxidised, but this did not cause them to open spontaneously, nor did it alter their activation by the voltage sensors. Recently, Feng et al. (2000) have reported that Ca2+-release channels in lipid bilayers can be activated by altering the redox potential difference across the bilayer, and they proposed that this could be important in vivo where the ratio of reduced glutathione (GSH) to oxidised glutathione (GSSH), which influences the redox potential, is normally ∼30:1 in the cytosol and ∼3:1 in the lumen of the SR. In the study of Andrade et al. (1998), the intact fibres were bubbled with 95 % O2 and the GSH:GSSG ratio in the cytosol before and during the H2O2 treatment is not known, nor is it known whether this was in any way important.
Mechanically skinned muscle fibres can be used to bridge the gap between intact fibres and isolated vesicles and channel preparations because it is possible to control and manipulate the intracellular environment and yet still be able to activate Ca2+ release via the voltage sensors in the T-system (Lamb & Stephenson, 1994). We have shown previously (Posterino & Lamb, 1996) that the force response elicited by depolarising the T-system by ion substitution over several seconds is not noticeably altered by strong reducing conditions, but is abolished when the skinned fibres are exposed to the specific sulphydryl reagent, 2,2′-dithiodipyridine (DTDP; 100 μm), apparently owing to interference with voltage-sensor activation. Brotto & Nosek (1996) reported that oxidation by H2O2 (1 mm) also inhibited depolarisation-induced Ca2+ release in skinned fibres and attributed this to the oxidation abolishing Ca2+-induced Ca2+ release (CICR). In contrast to this last conclusion, Plant et al. (2002) recently showed that treatment with 1 mm H2O2 increased the sensitivity of caffeine-induced Ca2+ release in both extensor digitorum longus (EDL; fast-twitch) and soleus (slow-twitch) fibres. Plant et al. (2002) further found that this H2O2 treatment increased the force response to depolarisation (by ion substitution) in slow-twitch fibres, but not in fast-twitch fibres. However, it is unclear (a) whether there was any increase in Ca2+ release in the latter case, because the force was already near maximal before exposure to H2O2 and (b) whether the increased force response in the slow-twitch fibres was due to increased Ca2+ release or an increase in Ca2+ sensitivity of the contractile apparatus (Plant et al. 2002).
In the study presented here, we investigated how the intracellular redox conditions affect various steps in the E–C coupling sequence in skeletal muscle, using a mechanically skinned fibre preparation (Posterino et al. 2000) in which it is possible to trigger Ca2+ release by action potential stimulation. We show, using the twitch response to action-potential stimulation as a sensitive measure of Ca2+ release, that the normal E–C coupling mechanism in skeletal muscle works well even under very reduced conditions, and also that it is not significantly modified by even large changes in the GSH:GSSG ratio in the cytosol. Importantly, we further show that H2O2 treatment does oxidise the Ca2+-release channels in situ, greatly potentiating their sensitivity to caffeine-induced Ca2+ release and CICR, but that this does not change the amount of Ca2+ release elicited by action-potential stimulation; this key observation has major implications in any consideration of the mechanisms involved in activating and terminating Ca2+ release in muscle fibres. Finally, we show that the oxidation-induced twitch potentiation that occurs in intact fibres (Oba et al. 1996; Andrade et al. 1998) is well explained by a paradoxical effect of GSH on the contractile apparatus of oxidised fibres (Lamb & Posterino, 2003).
METHODS
Skinned-fibre preparation and force recording
Male rats (Long Evans hooded; 4–6 months old) were killed humanely by halothane overdose, as approved by the Animal Ethics Committee of La Trobe University. The EDL muscles were dissected and pinned out in paraffin oil in a Petri dish kept on ice. In some experiments, whole EDL muscles were first immersed for 30 min in a mammalian saline solution that contained (mm): NaCl 140, KCl 4, CaCl2 2.5, MgCl2 1, Hepes 10, pH 7.1 and 10 μm tetrodotoxin (TTX); these muscles were then blot dried and immersed in paraffin oil. Single fibres were mechanically skinned, mounted on a force transducer (AME801, SensoNor, Norway, resonance frequency > 2 kHz) and stretched to 120 % of their resting length. The fibre was then placed in the standard potassium hexamethylene-diamine-tetraacetate (K-HDTA) solution (see below) with 50 μm total EGTA for 2 min to equilibrate. Force responses in the electrical stimulation experiments were amplified with a Bioamp pod (ADI Instruments, Sydney, Australia) attached to a 400-series Powerlab and recorded simultaneously on both chart recorder and computer using Chart software (version 3.14); the slower force responses in the caffeine-activation experiments were recorded on a chart recorder. All experiments were carried out at 23 ± 2 °C.
Solutions
All chemicals were obtained from Sigma, unless specified otherwise. The standard K-HDTA solution contained (mm): 126 K+, 37 Na+, 50 HDTA2- (Fluka, Buchs, Switzerland), 8 total ATP, 8.6 total Mg2+, 10 creatine phosphate, 0.05 total EGTA, 90 Hepes, 1 N3−, pH 7.10 ± 0.01, and pCa (−log10[Ca2+]) = 7.0. The free [Mg2+] was 1 mm. The Na-HDTA solution was identical except that all K+ was replaced with Na+. Solutions with a free [Mg2+] of 0.01, 0.05 mm and 10 mm were similar to the standard K-HDTA solution except that they contained 1.0, 2.1 and 22.7 mm total Mg2+, respectively. Maximum Ca2+-induced activation of skinned fibres was ascertained using a solution similar to the K-HDTA solution but with all HDTA replaced with 50 mm Ca-EGTA (20 μm free Ca2+) and the total Mg2+ reduced to 8.3 mm to maintain 1 mm free Mg2+. ‘Rigor’ solutions were similar to the standard K-HDTA solution except that all ATP and creatine phosphate were replaced with additional HDTA, the total EGTA was 0.25 mm and the total Mg2+ was adjusted to give either 0 or 10 mm free [Mg2+]. All solutions had an osmolality of 295 ± 10 mosmol kg−1. Free [Ca2+] (for pCa < 7.3) was determined with a Ca2+-sensitive electrode (Orion Research, Boston, MA, USA).
All reagent stocks were made fresh on the day. Dithiothreitol (DTT) was made as a 1 m stock in a K-HDTA solution and diluted as required. GSH and GSSG were made as 100 mm stocks in a K-HDTA solution and the pH adjusted back to 7.10 using KOH. Ratios of GSH:GSSG were made by adding appropriate volumes of the stock solutions together maintaining a 5 mm total glutathione concentration. A volume of H2O2 (Sigma ultra) was added directly from a 35 % w/v stock to solutions (to give a final concentration of 10 mm) and an appropriate volume of this solution used to make up 200 μm where required. The fidelity of the 35 % w/v stock was tested by using a colour-change assay with potassium permanganate to verify the concentration of H2O2 in the final solution. The reagent DTDP was made as a 100 mm stock in pure ethanol and diluted 1:1000 (final concentration 100 μm) with equivalent volumes of ethanol added to control solutions.
Caffeine-induced Ca2+ release
Following skinning and equilibration for 2 min in a K-HDTA solution containing 50 μm total EGTA (pCa 7.0), fibres were briefly equilibrated in a similar solution containing 0.5 mm EGTA (‘wash’ solution, pCa ∼8) for 10 s, and then the endogenous SR Ca2+ content was ascertained by releasing all of the Ca2+ in the SR using a K-HDTA solution containing 30 mm caffeine, 0.05 mm free Mg2+ and 0.5 mm total EGTA to chelate any released Ca2+ (‘full release’ solution, 1 min exposure). The area of the ensuing force response is indicative of the total amount of Ca2+ present in the SR (see Bakker et al. 1996; Lamb et al. 2001). Fibres were washed for 1 min in the wash solution before the SR was re-loaded with Ca2+ in a Ca2+-buffered K-HDTA solution (pCa 6.7, 1 mm total EGTA) for various times (10–30 s). Fibres were then equilibrated again in the wash solution for 10 s and the SR emptied using the full release solution. This load–release cycle was repeated several times to find the load time (∼20 s in most fibres) required to restore the SR Ca2+ content at close to the level that had been present endogenously. The load-release cycle was then modified as follows to include a test of the responsiveness to 8 mm caffeine. The SR was first loaded with Ca2+ for a set time (to close to the original endogenous level) and then the fibre was equilibrated in the standard K-HDTA solution (50 μm total EGTA, pCa 7.0) for 20 s before being exposed to an identical solution containing 8 mm caffeine (for 15 s), which typically elicited a small force response (e.g. top traces in Fig. 1). The SR was then fully depleted again with the full release solution, the area of this response indicating how much Ca2+ had remained in the SR after the response in 8 mm caffeine. The entire protocol was then repeated several times to ensure that the force response elicited by the 8 mm caffeine solution was reproducible. Parameters measured from the 8 mm caffeine response were peak force and the rate of rise of force. Both parameters are expressed relative to the maximum Ca2+-activated force; the rate of rise of force was defined as the force at 80 % of peak height divided by the time taken to reach that level after caffeine was applied (expressed as percentage of maximum Ca2+-activated force (‘Max’) per second). Prior to exposure to a reagent of interest (e.g. 10 mm H2O2), fibres were usually first fully depleted of Ca2+ and then exposed to a wash solution (pCa ∼8) containing the reagent in question for up to 5 min; very similar results were obtained when treatment was applied to fibres in a solution at pCa 7.0 when loaded. Fibres were then washed and the load-deplete cycles and load–caffeine–deplete cycles repeated again as above.
Figure 1. H2O2 treatment potentiates caffeine-induced Ca2+ release.
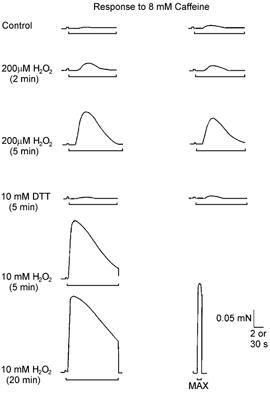
Force response to 8 mm caffeine (indicated by bar, 2 s time calibration) in a mechanically skinned extensor digitorum longus (EDL) fibre. The fibre was subjected to repeated cycles in which the SR was emptied of Ca2+, reloaded for a set time and then 8 mm caffeine applied (see Methods). Between cycles, the fibre was given various treatments (shown on left). The responses to 8 mm caffeine were obtained in order from left to right and top to bottom. The first pair of force responses was elicited in a freshly skinned fibre (Control). Both responses were relatively small (∼2–3 % of the maximum Ca2+-activated force, MAX, bottom right panel) and exhibited a considerable delay (∼2 s) before force developed. Treatment with 200 μm H2O2 for 2 min increased the response to 8 mm caffeine approximately twofold and an additional 3 min treatment caused a further increase (∼10-fold in total). The effect of H2O2 was fully reversed by treatment with 10 mm DTT. Treatment with 10 mm H2O2 for 5 and 20 min produced more marked effects on the 8 mm caffeine response; the peak size increased to ∼65 % and ∼85 % of MAX, respectively. Time calibration for MAX: 30 s.
The effect of varying the GSH:GSSG ratio was also examined. Fibres were exposed to the appropriate solutions (see above) containing a 30:1 ratio of GSH:GSSG (5 mm total) immediately after skinning, in order to maintain the GSH:GSSG ratio at an endogenous level both in the cytoplasm and within the SR (see Feng et al. 2000), subjected to several load–depplete cycles and the response to 8 mm caffeine tested at a given SR Ca2+ load level. Fibres were then exposed to matching solutions all containing a GSH:GSSG ratio of 3:1, reloaded for the same time and the response to caffeine determined under these conditions on several repetitions over ∼15–20 min in total. Fibres were then returned to solutions containing the 30:1 GSH:GSSG ratio and caffeine responses again determined over a further 15–20 min.
Ca2+-induced Ca2+ release
To measure CICR, the SR was emptied of all Ca2+ with the full release solution and reloaded for 30 s as above, and then either (a) emptied again to measure the SR Ca2+ content or (b) first exposed to either a ‘control’ or ‘test’ set of rigor solutions for a total of 2 min before being emptied (e.g. Fig. 2). In the ‘control’ case, the fibre was placed for 1 min in a rigor solution (with 10 mm free Mg2+ and 0.25 mm EGTA, pCa > 7.5) to remove all ATP (preventing Ca2+ uptake), transferred to a similar solution with zero Mg2+ for 30 s and then returned to 10 mm Mg2+ rigor solution for 30 s. The fibre was then placed in the standard ‘wash’ solution with ATP for 10 s to relax before being exposed to the full release solution to assay how much Ca2+ remained in the SR after the rigor period (see Fig. 2). The [Mg2+] was raised to 10 mm during most of the rigor period to minimise Ca2+ leakage. In the ‘test’ case the procedure was identical except that the free [Ca2+] in the zero Mg2+ rigor solution was set at 2 μm to try to elicit CICR.
Figure 2. H2O2 treatment potentiates Ca2+-induced Ca2+ release (CICR).
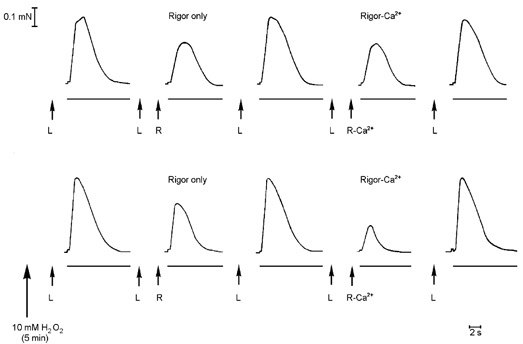
Force responses in a fibre when repeatedly emptying the SR of all Ca2+ (full release solution, see Methods). In the top traces, before H2O2 treatment, the SR was loaded (L) for a set period of 30 s and either emptied straightaway or exposed to a set of rigor solutions (R, no ATP) for 2 min and then emptied. The relative decrease in the response in the latter case (‘Rigor only’) indicates the amount of Ca2+ lost from the SR during the period in the rigor solutions. Exposure to 2 μm free Ca2+ for 30 s during the rigor period did not increase the amount of Ca2+ lost from the SR (compare traces labelled ‘Rigor only’ and ‘Rigor-Ca2+’), showing there was no detectable CICR under those conditions. After H2O2 treatment (lower traces) there was considerable CICR, as shown by the relatively small response for the ‘Rigor-Ca2+’ case. The ‘Rigor only’ protocol was repeated after the ‘Rigor-Ca2+’ protocol in each case (not shown). The loading period (L) had to be increased to 40 s after H2O2 treatment to reach the same SR Ca2+ content (see text).
T-tubular depolarisation by electrical stimulation and solution substitution
Electrical stimulation
EDL fibres were placed in a small Perspex chamber (∼400 μl) containing the standard K-HDTA solution (50 μm EGTA, pCa 7.0) and centred between two platinum wire electrodes placed in parallel, 4 mm apart, which were connected to an in-house stimulator with a current output of up to 300 mA (Posterino et al. 2000). Fibres were initially stimulated with single brief pulses (70 V cm−1, 2 ms) which elicited twitch responses at a rate of 1 every 30 s until they reached a steady level (generally ∼2–3 min). Where appropriate, fibres were then transferred to a second electrode bath containing a matching solution with the reagent of interest and stimulated at the same frequency for up to 5 min. Twitch parameters (see below) were measured either in the presence of the reagent or after the reagent was washed from fibres for an additional 30 s. Each parameter is expressed as a percentage of its value in the control response (i.e. in the standard K-HDTA solution) measured immediately before the treatment. Twitch parameters measured were: peak amplitude, rise time (calculated between 20–80 % of the peak amplitude), decay rate constant (determined by fitting a single exponential to the last 50 % of the decay phase of the twitch response) and half-width (the duration of the response measured at 50 % of peak height). The last three parameters were determined after normalising the peak amplitude.
Solution substitution
Following the initial 2 min equilibration period in a standard K-HDTA solution, the T-system of fibres could be fully depolarised by substituting the K-HDTA solution with the Na-HDTA solution, eliciting a force response as described previously (Lamb & Stephenson, 1994). To elicit submaximal depolarisation-induced force responses, skinned fibres were dissected from the superficial regions of muscles that had been treated with 10 μm TTX (see earlier) to eliminate T-tubular action potentials. The skinned fibre was then depolarised by substituting the K-HDTA solution with the Na-HDTA solution or with a 9:1 mixture of the Na- and K-HDTA solutions (∼12 mm K+; see Fig. 5), and treated with H2O2 as described. The T-system was repolarised in the K-HDTA solution for 45–60 s between successive depolarisations. Only TTX-treated fibres in which full Na+ substitution elicited > 60 % of maximum Ca2+-activated force, and the 12 mm K+ substitution elicited > 20 %, were deemed to be properly depolarised and used in this study; about half of the fibres satisfied these criteria. Parameters determined were the peak size of the force response (expressed as a percentage of the maximum Ca2+-activated force, ‘MAX’, in each fibre), and the rate of force rise (calculated as the force at 80 % of the peak response divided by the time taken to reach that force following immersion in the Na+/K+ solution; expressed as percentage of Max per second).
Figure 5. H2O2 treatment potentiates the force response to submaximal depolarisation elicited by solution substitution.
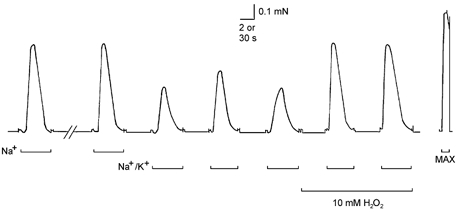
A skinned EDL fibre (pretreated with TTX) was depolarised by substituting the standard high [K+] solution with a matching Na+ solution with no K+ (see Methods), eliciting Ca2+ release and a large force response lasting 2–3 s. When the T-system was depolarised only partially by substituting a Na+/K+ solution containing 12 mm K+, the resulting force response was approximately twofold smaller than the response to full Na+ substitution. Application of 10 mm H2O2 greatly increased both the peak and rate of rise of the force response to submaximal depolarisation. Time scale: 2 s during depolarisations (bars) and 30 s between depolarisations and maximum Ca2+-activated force (MAX).
Statistical analysis
Data are presented as the mean ±s.e.m. and were analysed statistically using either a one-way analysis of variance with Dunnett's post test or Student's paired t test, as appropriate. Values were considered significant if P < 0.05.
RESULTS
Effect of oxidation on caffeine-induced Ca2+ release
We first examined whether oxidation by H2O2 increased the Ca2+ sensitivity of the Ca2+-release channels in these skinned fibres by testing their responsiveness to a submaximal caffeine stimulus (see Methods). Exposure to 8 mm caffeine typically triggered a small, slowly rising force response that was quite reproducible on successive test cycles (e.g. top traces in Fig. 1). Treatment with 200 μm H2O2 for 5 min potentiated the response to caffeine in every fibre examined (n = 7), increasing the peak force to ∼50 % of the maximum Ca2+-activated level and the rate of force development by approximately fourfold (Table 1). Briefer treatment with 200 μm H2O2 (2 min) caused less potentiation (e.g. compare second and third rows in Fig. 1). Treatment with 10 mm DTT for 5 min fully reversed the potentiation in every fibre (e.g. Fig. 1; see Table 1), showing that the potentiation was caused by an oxidation reaction. The increased force response to caffeine was clearly due to increased Ca2+ release because (a) the Ca2+ sensitivity and maximum force production of the contractile apparatus in the EDL fibres was not significantly altered by 5 min oxidation with 200 μm H2O2 (Lamb & Posterino, 2003) and (b) the SR was depleted of Ca2+ to a greater extent following the potentiated response to 8 mm caffeine, as indicated by the smaller force response found when subsequently emptying the SR of its remaining Ca2+ before starting the next cycle. This response indicated that before H2O2 treatment 92 ± 4 % of the Ca2+ remained in the SR after the 8 mm exposure, whereas following H2O2 treatment only 75 ± 4 % remained after the 8 mm exposure (P < 0.05, paired t test).
Table 1.
Effects of H2O2 and DTDP treatments on caffeine-induced force responses
| Treatment | Peak of response (% of max force) | Rate of rise of response (% max force s−1) | ||||
|---|---|---|---|---|---|---|
| Control | Post-treatment | Post-DTT | Control | Post-treatment | Post-DTT | |
| 1. 200 μm H2O2 (5 min) (n equals; 7) | 17 ± 6 | 51 ± 9 | 16 ± 6 | 6 ± 1 | 23 ± 5 | 7 ± 3 |
| 2. 10 mm H2O2 (5 min) (n equals; 12) | 18 ± 5 | 72 ± 6 | — | 6 ± 1 | 73 ± 10 | — |
| 3. 10 mm H2O2 (5 min) (subset of 2; n equals; 4) | 25 ± 11 | 77 ± 15 | 20 ± 11 | 7 ± 3 | 90 ± 22 | 9 ± 5 |
| 4. 10 mm H2O2 (20 min) (subset of 2; n equals; 3) | 21 ± 9 | 85 ± 9 | — | 6 ± 2 | 87 ± 25 | — |
| 5. 100 μm DTDP (5 min) (n equals; 3) | 12 ± 5 | 44 ± 12 | 27 ± 8 | 16 ± 10 | 89 ± 31 | 19 ± 7 |
Means (±s.e.m.) of peak force and rate of rise of force in skinned EDL fibres upon stimulation with 8 mM caffeine (see Fig. 1). n is the number of fibres. In each fibre the response to caffeine was examined before (control) and after each treatment indicated, and again after exposure to 10 mM DTT for 10 min where indicated. The peak of the response was expressed as a percentage of the maximum Ca2+ -activated force (max force) in the same fibre. The rate of rise of force was calculated from the time for the caffeine response to reach 80% of its peak. In every fibre examined the caffeine response increased after the indicated treatment and decreased again after exposure to DTT. The increase in peak and rate of rise were significant (P < 0.05) in every case except those for DTDP treatment; the latter was significantly different (P < 0.05) when expressed as a relative change on a logarithmic scale. In every case the response after DTT exposure was not significantly different from initial control response.
Oxidising the fibres with a higher concentration of H2O2 (10 mm) for 5 min had a more marked effect than 200 μm H2O2 (e.g. Fig. 1), invariably making the fibre extremely responsive to the 8 mm caffeine stimulus, with the force on average increasing ∼12 times faster than in the control case and reaching ∼70–80 % of the maximum Ca2+-activated force in that fibre (Table 1). The fibres were also far more responsive than normal to other stimuli, such as to lowering [Mg2+] below 1 mm (not shown). Again these effects were fully reversible with DTT (Table 1). Increasing the total duration of the 10 mm H2O2 treatment from 5 to 20 min caused a further small increase in the responsiveness to caffeine in all three fibres examined. Two fibres treated with 10 mm H2O2 and then exposed to GSH (5 mm) for 2 min showed potentiation of caffeine-induced Ca2+ release that was indistinguishable from the effect of H2O2 treatment alone described above. The specific sulphydryl reagent DTDP (100 μm, 5 min) also increased the peak force and the rate of rise of the force response to caffeine in all three EDL fibres examined, with the effects all partially or fully reversed by treatment with DTT for 5 min (see Table 1).
It was also apparent that net Ca2+ uptake into the SR under the standard loading conditions (pCa 6.7) was decreased in fibres that had been oxidised by 5 (or 20) min treatment with 10 mm H2O2. This was evident from the relatively reduced area (i.e. time integral) of the force response when a fibre was loaded and then immediately emptied of all Ca2+. This effect, which was reversed by DTT treatment, was seen in every fibre treated with 10 mm H2O2 (n = 15), with the reduction in area of the response upon full release ranging from ∼10–30 %; this can also be seen in Fig. 2 from the extra loading time needed after H2O2 treatment to reach approximately the same final SR Ca2+ content. Milder oxidising treatment with 200 μm H2O2 had no such effect. The reduction in net Ca2+ uptake after treatment with 10 mm H2O2 could be due both to a reduction in the rate of Ca2+ pumping into the SR and to an increase in the rate of efflux of Ca2+ from the SR during uptake (Andrade et al. 1998).
Increased CICR in oxidised fibres
We examined directly the effect of H2O2 treatment on CICR by measuring the amount of Ca2+ lost from the SR during a period of Ca2+ exposure when all uptake was prevented by having the skinned fibre in ‘rigor’ solutions with no ATP (Fig. 2). Before oxidative treatment, the SR lost the same amount of Ca2+ from the SR during a 2 min rigor period irrespective of whether or not it included a 30 s exposure to 2 μm free Ca2+, indicating that there was no measurable CICR at that free [Ca2+]. This is not surprising as there was no ATP present to stimulate the Ca2+-release channels (Endo, 1985; Lamb, 2000) and the free [Mg2+] was unlikely to have dropped completely to zero from 10 mm during the Ca2+ exposure period (see Methods). After treatment with 10 mm H2O2, there was substantial CICR (Fig. 2). Similar results were observed in every fibre examined (n = 6); before H2O2 treatment, the amount of Ca2+ in the SR after the rigor-Ca2+ period was not significantly different from that found with bracketing rigor-only periods (rigor only: 38 ± 5 %, rigor-Ca2+: 40 ± 5 %; rigor only: 37 ± 6 %; expressed relative to the response obtained without exposure to rigor solutions), whereas after H2O2 treatment exposure to Ca2+ reduced the response relative to bracketing rigor-only responses in every fibre (30 ± 7 %, 9 ± 3 % and 20 ± 6 %, in same order; middle value significantly smaller than bracketing values, P < 0.05). Thus, the H2O2 treatment substantially potentiated CICR. This was also the case when stimulating release with 30 μm Ca2+ (with 1 mm free Mg2+ present). In those experiments (three fibres), there was substantial CICR even before oxidative treatment, and this was increased by the treatment. However, as described previously (Lamb & Cellini, 1999), the 30 s exposure at such a high [Ca2+] caused an increase in Ca2+ leakage from the SR, which made it difficult to assay accurately the amount of CICR because the test of CICR deleteriously affected the subsequent control responses.
Effect of the GSH:GSSG ratio on caffeine-induced responses
We also examined the effect on caffeine-induced Ca2+ release of altering the ratio of GSH:GSSG in the bathing solution from a relatively ‘reduced’ level (30:1) to an ‘oxidised’ level (3:1; see Feng et al. 2000). The responsiveness to caffeine was tested with the GSH:GSSG ratio first at 30:1, then 3:1 and then again at 30:1 (see Methods). Such changes have no significant effect on the Ca2+ sensitivity of the contractile apparatus in these fibres (Lamb & Posterino, 2003). In the four fibres examined, the peak size and rate of rise of the caffeine response with a 3:1 GSH:GSSG ratio were 120 ± 28 % and 130 ± 41 %, respectively, of the values obtained during the bracketing periods with a 30:1 ratio, thus indicating no significant difference between treatments (paired t test, P > 0.05). Alteration of the GSH:GSSG ratio from 30:1 to 3:1 also had no significant effect on net Ca2+ uptake, as assayed by the area of the response when subsequently emptying the SR with the full release solution (mean area for the 3:1 case being 108 ± 4 % (n = 4) of the bracketing 30:1 cases; P > 0.05, paired t test). Thus, varying the GSH:GSSG ratio in the cytoplasm from 30:1 to 3:1 did not enhance CICR and caffeine-induced Ca2+ release in these skinned fibres, which contrasts markedly with the effect of specific oxidative treatments with H2O2 or DTDP (see above).
Twitch responses in mechanically skinned fibres
Electric field stimulation was used to elicit twitch responses in the skinned EDL fibres, as described previously (Posterino et al. 2000; see Methods). The twitch response peaked at ∼60 % of the maximum Ca2+-activated force (mean 56 ± 2 %, in 67 fibres) and lasted ∼150–200 ms. The exact size of the response depends on the amount and type of Ca2+ buffering in the skinned fibre (i.e. in the bathing solution), with the above values obtained with 50 μm total EGTA (pCa ∼7.0); the various effects described below were not qualitatively different between fibres with different size twitches or with different levels of Ca2+ buffering (not shown). In any given fibre, twitch responses elicited every 30 s over a 5 min period were very similar (e.g. left panel in Fig. 3A), having similar peak amplitudes, with the only discernible difference being a small increase in the duration of the response (indicated by ∼11 % increase in half width; see Table 2).
Figure 3. Twitch responses in skinned fibres in control and reducing conditions.
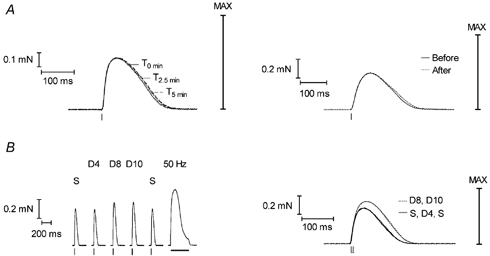
A, twitch responses in a mechanically skinned EDL fibre with no redox agents present (left panel). Responses at three different times (T) are shown superimposed. The response was virtually unchanged over 5 min, except for a small increase in the half-width. The maximum Ca2+-activated force (MAX) is indicated. The right panel shows twitch responses in another fibre before and immediately after a 5 min treatment with 10 mm DTT; the twitch response was little changed, showing only a slight increase in half-width, as occurs with time alone (left panel). B, responses in a fibre stimulated with either a single electric field pulse (S) or a pair of pulses 4–10 ms apart (double pulse, D). Responses are shown in sequence in the left panel and superimposed in the right panel. Stimulating with two pulses 4 ms apart (D4) gave a virtually identical response to stimulating with a single pulse. Increasing the interval between the two pulses to 8 ms elicited a substantially larger response, with no further change occurring when increasing the interval between the pulses to 10 ms (D10). The tetanic response to 50 Hz stimulation (horizontal bar) reached maximum Ca2+-activated force (MAX). Small vertical ticks beneath twitch responses show the time of applied stimuli.
Table 2.
Twitch response after 5 min repeated activation under various conditions
| Normalised peak amplitude | Normalised rise time20–80 | Normalised decay rate constant | Normalised half-width | |||
|---|---|---|---|---|---|---|
| 1. | Control | 100 ± 2% (5) | 98 ± 2% | 84 ± 7% | 111 ± 3%* | |
| 2. | 10 mm DTT | (W) | 98 ± 4% (6) | 94 ± 5% | 86 ± 8% | 100 ± 3% |
| 3. | 5 mm GSH | (W) | 105 ± 3% (6) | 101 ± 5% | 88 ± 7% | 112 ± 7% |
| 4. | 30:1 GSH:GSSG | (P) | 103 ± 6% (3) | 108 ± 7% | 106 ± 11% | 102 ± 11% |
| (W) | 108 ± 11% | 105 ± 3% | 101 ± 14% | 102 ± 11% | ||
| 5. | 3:1 GSH:GSSG | (P) | 101 ± 3% (4) | 96 ± 2% | 100 ± 5% | 94 ± 4% |
| (W) | 98 ± 6% | 98 ± 1% | 100 ± 3% | 103 ± 4% | ||
| 6. | 2.5 mm GSSG | (P) | 97 ± 2% (3) | 101 ± 2% | 93 ± 3% | 104 ± 4% |
| (W) | 93 ± 3% | 99 ± 8% | 97 ± 4% | 95 ± 4% | ||
| 7. | 200 μm H2O2 | (P) | 100 ± 3% (10) | 96 ± 4% | 109 ± 8% | 96 ± 3% |
| 8. | 10 mm H2O2 | (P) | 97 ± 3% (8) | 108 ± 3% | 80 ± 6% | 106 ± 5% |
| 9. | 10 mm H2O2 | (P) | 96 ± 2% (4) | 113 ± 7% | 110 ± 11 | 83 ± 15% |
| Double-pulse |
Mean values (±s.e.m.) of twitch parameters in skinned EDL fibres measured after 5 min either in the presence (P) of a given reagent (e.g. 10 mm H2O2) or 30 s after the reagent was washed (W) from the fibre. Values were normalised to the response before treatment in each fibre. Fibres were stimulated with a single pulse once every 30 s under all conditions; for row 9 the response to a pair of pulses 10 ms apart was measured before and after the treatment in 4 of the 8 fibres in row 8. In treatment 1, fibres were stimulated in the standard K-HDTA solution (Control) and a paired t test used to determine whether there was any significant change in the measured twitch parameter after 5 min (*P < 0.05) (e.g. see Fig. 3A). For all other treatments, parameter values after 5 min were compared to the corresponding control data with a one-way analysis of variance using Dunnett's multiple comparison post test; no values were significantly different at P < 0.05.
Because the twitch response remains both stable and submaximal, it should be a sensitive measure of any change in Ca2+ release from the SR. To demonstrate this, a small additional increment of Ca2+ was released from the SR by applying a second (identical) electrical stimulus shortly after the first (e.g. see Fig. 3B). When the second stimulus was applied within ∼4 ms after the first, the force response was no different from that for a single stimulus; this is consistent with the refractory behaviour of action potentials, as the second stimulus would not be expected to elicit a second action potential. When the second stimulus was applied ∼6–20 ms after the first, it elicited a larger force response than the single pulse, typically reaching ∼80 % of maximum Ca2+-activated force (e.g. Fig. 3B), with the peak amplitude being virtually identical, irrespective of the exact separation of the two pulses (e.g. compare cases D8 and D10 in Fig. 3B). Similar results were observed in every fibre examined. In every case, the peak of the force response to two closely spaced pulses (10 ms apart) was clearly larger (∼25 %) than the twitch response to a single stimulus, but smaller than the peak tetanic force reached with 50 Hz stimulation (which typically was the same as maximum Ca2+-activated force measured in the same fibre).
Effect of strong reductants and modifying the GSH:GSSG ratio on twitch responses
In the above fibres, the cytoplasmic factors normally influencing the redox state of the cytoplasm and SR, in particular GSH and GSSH (Feng et al. 2000), would have been lost from the fibre soon after skinning, and it might be argued that the fibres subsequently became ‘oxidised’. Consequently, we examined the effect on the twitch response of treating the fibres for 5 min in the presence of 5 mm GSH or 10 mm DTT (e.g. right panel in Fig. 3A). Neither treatment had any significant effect on the twitch parameters (Table 2). Similarly, restoring the GSH:GSSG ratio to the level present in the cytoplasm in vivo (30:1) had no significant effect on the twitch response (Table 2), with the parameters being assessed both in the presence of the redox reagents and immediately after washout, so as to identify and distinguish redox effects from any possible direct effects of the reagents or conditions. We also examined the effect of varying the ratio of GSH:GSSG from 30:1 to the relatively oxidised level of 3:1. In these experiments, immediately after skinning the fibre was placed in a solution with a GSH:GSSG ratio of 30:1, so as to keep the ratio constant at its in vivo level (Feng et al. 2000). Subsequently altering the ratio to 3:1 had no significant effect on the twitch response (Table 2). Furthermore, when other fibres were placed in 5 mm GSH immediately after skinning and then treated in a solution with 2.5 mm GSSG and no GSH for 5 min, there was again no significant change in the twitch response (Table 2).
Effect of H2O2 on twitch force responses
Exposure to 200 μm H2O2 had no effect on the size, duration or other twitch parameters over 5 min in 10 of the 11 fibres examined (Table 2), even though it invariably potentiated the response to caffeine (Table 1). In the remaining fibre, the twitch response declined to 69 % of the control level by the end of the 5 min period.
Fibres treated with a much higher concentration of H2O2 (10 mm) for 5 min also displayed responses falling into two distinct categories. In half the cases (8/16) the twitch response fell by at least 20 % before the end of the 5 min treatment period (e.g. Fig. 4B), with the mean twitch size after 5 min in these eight fibres being 40 ± 7 % of the initial level. In four of these cases the responses were examined for a further 2 min after washout of the H2O2, during which time the twitch response declined further or ceased altogether, with there being no recovery after a subsequent 5 min treatment in 10 mm DTT in any case (e.g. Fig. 4B). When these fibres were subsequently exposed to a solution with low free [Mg2+] (0.01 mm; see Lamb & Stephenson, 1994), it triggered Ca2+ release and a large force response in every case, showing that the SR was still loaded with Ca2+ and that the Ca2+-release channels could still be activated directly. This indicates that the 10 mm H2O2 treatment deleteriously affected a more proximal step in the E–C coupling sequence (see Discussion).
Figure 4. Effect of H2O2 treatment on twitch force responses.
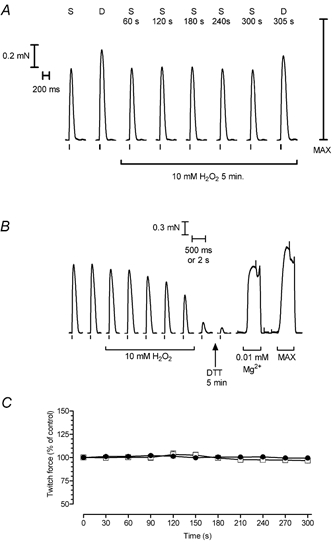
A, responses in a skinned fibre to stimulation with either a single action potential (S) or two action potentials 10 ms apart (D). The twitch response to a single action potential remained virtually unchanged over a 5 min exposure to 10 mm H2O2 and the response elicited by a pair of action potentials afterwards was only slightly smaller than its initial control level. B, example of exposure to 10 mm H2O2 causing abolition of twitch responses in an EDL fibre; lowering [Mg2+] from 1 to 0.01 mm still induced sarcoplasmic reticulum (SR) Ca2+ release and contraction. C, mean (±s.e.m.) of the peak amplitude of the twitch response during 5 min exposure to 10 mm H2O2 in EDL fibres where excitation–contraction coupling was not interrupted (circles; eight fibres) and in fibres maintained in control conditions for a similar period (squares; five fibres). The error bars are smaller than the symbols. Twitch responses in each fibre were normalised to the response obtained under control conditions immediately before the respective 5 min test period. There was no significant difference between the groups in the size of control response as a percentage of maximum Ca2+-activated force (67 ± 7 %, n = 5; 58 ± 6 %, n = 8; P > 0.05).
In the other eight fibres exposed to 10 mm H2O2 (e.g. Fig. 4A), there was no noticeable change at all in the size or other characteristics of the twitch response over the entire 5 min period (Fig. 4C and Table 2). In five of the eight cases, the twitch responses were also measured after washout of H2O2 for 2 min and after a further 5 min treatment with 10 mm DTT, neither of which significantly affected the responses (relative twitch size: 96 ± 3 % (washout) and 92 ± 4 % (post-DTT); both P > 0.05, paired t test). The force response to double-pulse stimuli (10 ms apart) also remained unchanged during the 5 min exposure to 10 mm H2O2 (Table 2; e.g. Fig. 4A). These results from fibres where E–C coupling was not interrupted, provide clear evidence that a stringent oxidising treatment sufficient to cause profound potentiation of caffeine-induced Ca2+ release and CICR in every fibre (Table 1) causes no detectable change in the twitch response and Ca2+ release following action-potential stimulation.
Effect of H2O2 on depolarisation-induced Ca2+ release by solution substitution
As the H2O2 treatment potentiates caffeine-induced Ca2+ release and CICR from the SR but does not alter action-potential-induced Ca2+ release, the question arises as to whether this difference is due to the different methods of activating the release channels (i.e. directly or via the voltage sensors) or to some other difference, such as the effectiveness of the stimulus in activating rapid Ca2+ release (the action potential triggered Ca2+ release more than 100 times faster than did caffeine). To test this, we examined the effect of H2O2 treatment on the Ca2+ release elicited by submaximal activation of the voltage sensors. This was achieved using the ion-substitution method to depolarise the T-system (Lamb & Stephenson, 1994) in skinned fibres in which the T-system action potential had been blocked with TTX (see Methods). As seen in Fig. 5, substituting the high [K+] bathing solution with a matching zero [K+] solution elicited a large force response, although the onset of the response was delayed by about ∼0.5–1 s after the solution substitution (mean peak size and rate of rise of force response for the four fibres discussed below: 80 ± 4 % of maximum Ca2+-activated force (‘Max’) and 51 ± 8 % Max s−1, respectively, measured as described in Methods). The marked delay in the onset of the force response was the result of abolishing the T-system action potential, which meant that the time course of T-system depolarisation (and voltage-sensor activation) was determined primarily by the decline of the [K+] within the fibre after the solution substitution (time constant < 0.3 s, based on ion size and fibre diameter; Moisescu & Thieleczek, 1978). Submaximal depolarisation could be produced by substituting a solution with 12 mm K+, rather than no K+, which elicited a smaller force response that was reasonably reproducible on successive repetitions (Fig. 5). In the four fibres examined, depolarisation by 12 mm K+ substitution elicited a force response with a mean peak amplitude of 43 ± 8 % of ‘Max’ and mean rate of force development of 25 ± 8 % Max s−1. One minute after addition of 10 mm H2O2, the same depolarising stimulus elicited a substantially larger and faster-rising force response in all four fibres (mean peak and rate of rise: 66 ± 4 % of Max and 46 ± 11 % Max s−1; both P < 0.05, paired t test; e.g. Fig. 5), and after a further minute in H2O2 the same stimulus gave a similar or even larger response (mean: 70 ± 5 % Max and 66 ± 13 % Max s−1). Thus, the treatment in 10 mm H2O2 potentiated the peak of the force response to submaximal depolarisation by ∼1.6-fold and the rate of force rise by ∼2–2.5-fold, producing a response similar to, and even faster than, the response to full depolarisation (i.e. to zero [K+]; see Fig. 5).
Following 2 min exposure to 10 mm H2O2, the response to successive depolarisations (by either submaximal or maximal stimuli) progressively declined, irrespective of whether the H2O2 remained or was washed out. Nevertheless, it was still always possible to elicit Ca2+ release and a large force response by lowering the free [Mg2+] (not shown). Thus, the treatment with 10 mm H2O2 evidently interfered (directly or indirectly) with voltage-sensor activation of Ca2+ release in these solution substitution experiments, just as seen in the action-potential-stimulation experiments (e.g. Fig. 4B). In two fibres that were exposed to 1 mm H2O2, the response to submaximal depolarisation became progressively larger over the first four depolarisations (1 min apart) before stabilising; the response was little changed when the H2O2 was washed out and when 10 mm H2O2 was subsequently added. Thus, exposure to 1 mm H2O2 caused an increase in the response to submaximal depolarisation similar to that with exposure to 10 mm H2O2, although it took longer for maximal effect to occur (∼4 min versus < 1 min).
Effect of GSH exposure after oxidation
Finally, we also examined whether fibres that had been oxidised by H2O2 (or DTDP) treatment showed any alteration in twitch response when subsequently exposed to GSH, as this type of treatment has been shown to have a significant effect on the steady-state Ca2+ sensitivity of the contractile apparatus (Lamb & Posterino, 2003) and could potentially account for the oxidation-induced increase of twitch and submaximal tetanic responses in intact fibres (Oba et al. 1996; Andrade et al. 1998; see Introduction).
Each skinned EDL fibre was exposed to 10 mm H2O2 for 2 min, then the H2O2 was washed out and the fibre exposed to 5 mm GSH for ∼2.5 min. As seen in the example in Fig. 6A and the mean data in Fig. 6B, the twitch response increased progressively during the exposure to GSH and remained at a similar level after washout of the GSH. A subsequent 2 min treatment with 10 mm DTT reversed the twitch potentiation (Fig. 6). Control fibres, which were tested alternately with the above fibres but not subjected to the H2O2 treatment, showed no increase in twitch force when placed in the same GSH solution (Fig. 6B). Comparison of the relative change in the twitch response between the control and the H2O2-oxidised fibres in Fig. 6B indicates that the GSH exposure potentiated the twitch in the H2O2-oxidised fibres by ∼15–20 %. This corresponds on average to the twitch force increasing from ∼60 % to ∼70–75 % of maximum Ca2+-activated force.
Figure 6. Exposure of H2O2-oxidised fibres to reduced glutathione (GSH) causes potentiation of twitch force.
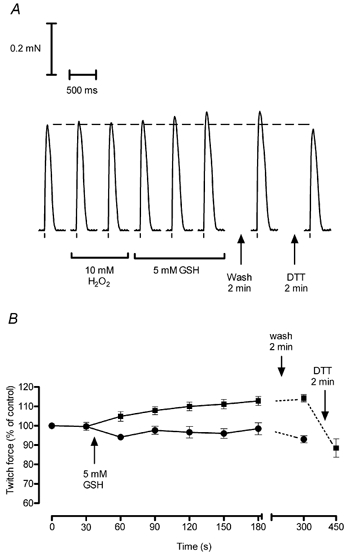
A, the twitch response in a skinned EDL fibre was virtually unchanged during a 2 min exposure to 10 mm H2O2 (responses elicited every 30 s, last two shown), but increased progressively during a subsequent 2.5 min exposure to GSH (5 mm). The response was unchanged when the GSH was washed out, but decreased to close to the original control level (dashed line) following a 2 min treatment with 10 mm DTT. B, mean data (±s.e.m.) of relative twitch size in six fibres exposed successively to H2O2 and GSH as in A (squares) and six other fibres exposed to GSH without a preceding exposure to H2O2 (circles). The response following DTT exposure was obtained in only four of the six fibres exposed to H2O2 and GSH. Twitch forces in each fibre were normalised to the first of the two ‘control’ responses obtained preceding GSH exposure.
We also examined the effect of oxidising the fibres with DTDP (100 μm, 20 s) and then exposing them to GSH, as this causes an even more marked increase in the steady-state Ca2+ sensitivity of the contractile apparatus (increase in pCa at 50 % maximum force of ∼0.27 pCa units; Lamb & Posterino, 2003). The treatment in DTDP substantially reduced the size of the twitch response (e.g. Fig. 7), with the peak decreasing on average to 37 ± 6 % (n = 12) and the half-width decreasing to 68 ± 4 % of their original size (Table 3). The reduction in the size of the twitch is almost certainly due in part to a decrease in the Ca2+ sensitivity of the contractile apparatus that occurs with such treatment (Lamb & Posterino, 2003), but it is also likely that there was some irreversible oxidation-induced disruption in the voltage-sensor activation of Ca2+ release because (a) coupling was irrevocably lost in many fibres if the duration of the DTDP treatment was increased only two- or threefold (compare effect of 10 mm H2O2 above; Fig. 4B) and (b) a 2 min DTT treatment was only able to partially restore the size of the twitch response (Table 3), even though the decrease in Ca2+ sensitivity of the contractile apparatus is fully reversed by a much briefer exposure to DTT (15 s; Lamb & Posterino, 2003).
Figure 7. GSH potentiates twitch force in dithiodipyridine (DTDP)-oxidised fibres.
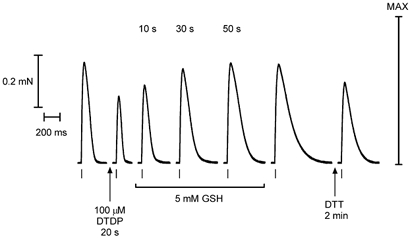
The twitch response in an EDL fibre decreased in both peak amplitude and half-width after a brief (20 s) exposure to 100 μm DTDP (in the absence of any stimulation). When the fibre was subsequently exposed to 5 mm GSH and stimulated at ∼20 s intervals (time in GSH shown), the twitch response increased progressively in peak amplitude and half-width, with each reaching a steady level within 1–2 min. These changes persisted when GSH was washed out. Subsequent exposure to 10 mm DTT for 2 min partially reversed the potentiation occurring with GSH treatment.
Table 3.
Effect of GSH and DTT treatments on twitch response in DTDP-oxidised fibres
| Post-DTDP | Post-GSH | Post-DTT | ||
|---|---|---|---|---|
| 1. | Peak size | 34 ± 11 (4)* | — | 53 ± 18 (4)* |
| Half-width | 73 ± 4 (4)* | — | 112 ± 9 (4) | |
| 2. | Peak size | 39 ± 7 (8)* | 90 ± 7 (8) | 77 ± 4 (3)* |
| Half-width | 66 ± 5 (8)* | 139 ± 13 (8) † | 105 ± 12 (3) |
Values are the mean (±s.e.m.) of the relative peak size and half-width of the twitch response in skinned EDL fibres after the indicated treatments (e.g. as in Fig. 7). All values are expressed relative to the control twitch before any treatment. In the upper data set, 4 fibres were sequentially treated with DTDP (100 μm, 20 s) and then DTT (10 mm, 2 min). In the lower data set, 8 fibres were sequentially treated with DTDP (100 μmm, 20 s) and GSH (5 mm, 2.5 min), and in three cases with DTT (10 mm, 2 min).
and
indicate that the mean value is significantly smaller or greater, respectively, than the original value before any treatment (Student's one-tailed paired t test, P < 0.05).
When such DTDP-oxidised fibres were exposed to GSH (5 mm), the twitch response noticeably increased within ∼10 s and reached a steady level within 1–2 min, remaining unchanged upon washout of the GSH (e.g. Fig. 7). In the eight fibres examined in this way, the peak amplitude and the half-width of the twitch response increased to 292 ± 66 % and 216 ± 21 %, respectively, of their values after DTDP treatment (P < 0.05 in both cases), that is, to 90 ± 7 % and 139 ± 3 %, respectively, of their original values (Table 3). In three of these cases the fibres were then treated with 10 mm DTT (2 min) and the peak amplitude and the half-width of the twitch response decreased to 78 ± 6 % and 65 %± 3 % of their respective values before the DTT treatment (P < 0.05; e.g. see Fig. 7). Thus, in DTDP-oxidised fibres, exposure to GSH caused marked potentiation and prolongation of the twitch response, with the effect being much larger than seen with DTT exposure (top data set in Table 3) and not attributable simply to reversal of the effect of DTDP on the sensitivity of the contractile apparatus. Furthermore, subsequent DTT treatment substantially reversed the effects of the GSH treatment, restoring the twitch parameters to values similar to those seen when treating DTDP-oxidised fibres with DTT without any intervening exposure to GSH (compare upper with lower data set in right-most column of Table 3). The effect of GSH found in DTDP-treated fibres is completely analogous with its effect in H2O2-treated fibres described above, and together these data provide strong evidence that GSH potentiates twitch responses in oxidised fibres by increasing the Ca2+ sensitivity of the contractile apparatus, in accord with observations on the steady-state properties of the contractile apparatus (Lamb & Posterino, 2003).
DISCUSSION
This study presents a number of findings that are important for understanding (a) the normal physiological processes controlling Ca2+ release and contraction in skeletal muscle fibres and (b) the effects of oxidation on particular steps in the E–C coupling sequence and their possible roles in normal muscle function and in fatigue. By using action-potential stimulation of Ca2+ release in skinned fibres it was possible to examine the response of the normal, rapid E–C coupling mechanism whilst controlling the redox conditions in the cytoplasm during Ca2+ release, and to examine the response both before and after applying particular oxidation and reduction treatments. Furthermore, it was also possible to determine the parallel effects of these redox conditions and treatments on the responsiveness of the Ca2+-release channels to direct activation by caffeine and Ca2+.
Caffeine-induced Ca2+ release and CICR
The present results on the caffeine sensitivity of Ca2+ release (e.g. Fig. 1, Table 1) indicate that Ca2+-release channels functionally coupled to voltage sensors are quite responsive in situ to oxidation by either H2O2 or the specific sulphydryl reagent DTDP, and that the effect is fully reversible by reduction with DTT, in agreement with the recent results of Plant et al. (2002). The channels in fibres obtained from rested muscles were evidently in a reduced state, with further reduction having no noticeable effect. This is similar to the conclusions reached about the redox state of the contractile apparatus in such fibres (Lamb & Posterino, 2003).
The conclusion that oxidation increased CICR and caffeine-induced Ca2+ release in skinned fibres (this study and Plant et al. 2002) is consistent with the effects of oxidation on SR vesicles and single RyRs (Zaidi et al. 1989; Favero et al. 1995) but conflicts markedly with the skinned fibre study of Brotto & Nosek (1996), which concluded that CICR was completely abolished by oxidation (5 min treatment with 1 mm H2O2). The difference was not attributable to ‘over-oxidation’ of the RyRs causing inhibition of CICR, because CICR in skinned fibres was increased, not inhibited, by applying a more severe and prolonged treatment (20 min, 10 mm H2O2; Table 1). Instead, it is possible that the apparent abolition of CICR reported by Brotto & Nosek (1996) was actually due to an oxidation-induced increase in CICR that (a) reduced net uptake during the loading period at pCa 6.6 and (b) caused increased loss of SR Ca2+ during the equilibration and wash periods necessary for the assay of CICR (see Fig. 2), particularly given that the SR had been made leaky by the saponin treatment used in those experiments (see Launikonis & Stephenson, 1997).
Ca2+ release with action-potential stimulation
It was found that the twitch response, which is indicative of the amount of Ca2+ released by action-potential stimulation of the voltage sensors, was not appreciably altered by varying the redox condition of the cytoplasm from a highly reduced level (e.g. with 10 mm DTT or 5 mm GSH) to a highly oxidised level (e.g. GSH:GSSG at 3:1 or all GSSG; Table 2). It was further found that oxidising the Ca2+-release channels by H2O2 exposure (200 μm or 10 mm), greatly sensitising their activation by cytoplasmic Ca2+ and caffeine (Table 1), did not change any of the characteristics of the twitch response (Table 2; Fig. 4). As the pCa50 of the force–pCa relationship is quite unaffected by these H2O2 treatments (Lamb & Posterino, 2003), this indicates that the amount of Ca2+ released by an action potential was unchanged. These results are consistent with the study of Andrade et al. (1998) in intact muscle fibres, in which they observed little or no effect of H2O2 treatment (100–300 μm) on cytoplasmic [Ca2+] during submaximal tetanic stimulation. The above findings also show that the effects of oxidation and reduction observed in single Ca2+-release channels and SR vesicles (Feng et al. 2000; Oba et al. 2002) cannot be extrapolated in any simple way to give insight into the effects and role of oxidation in functioning muscle fibres.
The concentration of H2O2 required to induce substantial oxidative effects in studies with skinned fibres, isolated SR and single release channels (e.g. 0.2–10 mm), is considerably higher than that in intact fibres. This is probably because H2O2 itself is a comparatively unreactive reagent and most likely mediates its effects after conversion to the highly reactive hydroxyl radical. This will occur far more readily in an intact muscle fibre than in perfused preparations where myoglobin has been washed out and Fe2+ and similar ions are buffered to an extremely low concentration by the addition of EGTA (see discussion in Lamb & Posterino, 2003). In any case, whatever the reason for this disparity, we show here that the oxidative treatment did greatly upmodulate CICR but did not affect the twitch response in the same preparation.
Oba et al. (2002) report that oxidation reversibly converts single RyRs from a low open probability (Po) state, where they are very poorly responsive to stimulation by Ca2+, caffeine and ATP, to a high Po state, where they are very responsive to such stimuli. The present finding that oxidation greatly increases the sensitivity of the Ca2+ release in skinned fibres to such stimuli could be seen as in some ways consistent with this. However, it is evident that the release channels in the oxidised fibres here, with 8 mm ATP present, could not have had a high Po all the time, because very little Ca2+‘leaked’ out of the SR in the absence of voltage-sensor activation (i.e. Po was ≪ 0.01); this was presumably the result of the presence of 1 mm free Mg2+ in the experiments here and possibly also because of the presence of associated proteins (e.g. calmodulin and FKBP12) and interactions between adjacent release channels in situ. It should also be noted that if the release channels in the fibres did convert from ‘low Po’ to ‘high Po’ states as reported by Oba et al. (2002), this had no apparent consequence for their activation by the voltage sensors, which potently stimulated the channels and elicited the same total amount of Ca2+ release irrespective of the particular Po state.
Activation and termination of Ca2+ release
The lack of effect of oxidation on action potential stimulation of Ca2+ release is not because voltage-sensor control of the release channels is in some way immune to the effect of oxidising the release channels. On the contrary, oxidative treatment substantially increased the effectiveness of the voltage-sensor activation of Ca2+ release when using relatively weak depolarisations that induced only submaximal activation of the voltage sensors (e.g. Fig. 5). After oxidation, the submaximal depolarising stimulus elicited as big a response as the full depolarising stimulus, presumably indicating that less voltage-sensor activation (i.e. fewer voltage sensors activated or activated at any given instant) is needed to open the release channels when they are oxidised. This effect of oxidation is highly analogous to the ability of caffeine to increase the effectiveness of the coupling between the voltage sensors and the Ca2+-release channels; that is, to increase the ‘transfer function’ (Shirokova & Rios, 1996). This effect could be the result of some overall increase in the general excitability of the release channel, or alternatively it might be due specifically to the increase in sensitivity of the channel to activation by cytoplasmic Ca2+. Given that voltage-sensor activation of Ca2+ release is indeed sensitised by oxidation, the most straightforward explanation for the inability of the oxidative treatment to increase action-potential-induced Ca2+ release is that all the channels are already fully activated (i.e. Po≈ 1) by the stimulus. Indeed, this is also suggested by calculations comparing the rate of Ca2+ efflux from the SR during an action potential with the Ca2+ flux through single release channels (Mejia-Alvarez et al. 1999). If Po≈ 1 during the action potential, oxidation could not increase channel activation any further.
The question then arises as to why Ca2+ release doesn't continue after the action potential ends, especially given that the oxidative treatment evidently increased the sensitivity of CICR (Fig. 2). During the phase of action-potential-induced Ca2+ release, the [Ca2+] in the vicinity of the release channels should be relatively high, and yet the Ca2+-release channels evidently close after releasing approximately the same amount of Ca2+, irrespective of whether or not they have been oxidised. The fact that an additional quantum of Ca2+ can be released by another action potential as little as 6 ms after the first, indicates that the termination of Ca2+ release is not due to the SR being fully depleted of Ca2+. It is possible, however, that partial or local depletion of SR Ca2+ is the reason why CICR fails to stimulate Ca2+ efflux after the action potential. We have recently shown that caffeine-induced Ca2+ release and CICR are severely inhibited by decreasing the amount of Ca2+ in the SR, even though voltage-sensor activation is still able to elicit Ca2+ release (Lamb et al. 2001); evidently CICR only occurs if the SR is loaded with Ca2+ above a certain level (see Endo, 1985). This effect might also be exacerbated by local depletion of Ca2+ in the lumen of the SR near the release channels, which could result from the sudden efflux of Ca2+ and what may be relatively slow replenishment from other regions of the SR owing to diffusion being limited by Ca2+ binding to calsequestrin.
Another process that could contribute to the termination of Ca2+ release following an action potential is Ca2+-dependent (or activation-dependent) inactivation of the release channel (Schneider & Simon, 1988; Jong et al. 1993; Hollingworth et al. 1996; Pizarro et al. 1997; Laver & Lamb, 1998). In voltagE–Clamp experiments in frog fibres, Jong et al. (1993) found evidence that the total amount of Ca2+ released from the SR at the time of peak rate of release appeared to be independent of SR Ca2+ content, ‘consistent with the idea that a single activated channel might pass, on average, a fixed number of ions’ before inactivating, possibly by a Ca2+-dependent mechanism. This phenomenon, whatever its molecular basis, seems highly comparable with the fixed amount of Ca2+ release found here with action-potential stimulation.
The present results do not show whether oxidation reduced the inhibitory effect of Mg2+ at the low-affinity Ca2+/Mg2+ site on the release channel, as occurs in isolated channels with at least some oxidation procedures (Donoso et al. 2000). It is clear, however, that Mg2+ still potently inhibited Ca2+ release in the oxidised fibres by some mechanism, possibly by its action at the Ca2+-activation site (Meissner et al. 1986; Laver et al. 1997), because lowering [Mg2+] (from 1 to 0.01 mm) invariably triggered massive Ca2+ release (e.g. Fig. 4B). The [Mg2+] threshold for this effect was not examined, although it did appear that the oxidised fibres responded more rapidly to lowering [Mg2+]. Thus, even though the present results do not show whether normal E–C coupling involves changes in Mg2+ inhibition of the release channel (Lamb & Stephenson, 1991, 1994), they do point to the importance of cytoplasmic Mg2+ in inhibiting Ca2+ release in general, and in particular in inhibiting spontaneous CICR, which could otherwise be a major problem in oxidised fibres (e.g. Fig. 2).
Effect of GSH in oxidised fibres
Oxidation of intact muscle fibres with H2O2 was found to potentiate submaximal tetanic force responses, not by increasing Ca2+ release, but by increasing the Ca2+ sensitivity of the contractile apparatus (Andrade et al. 1998). We showed recently in experiments examining the steady-state Ca2+ sensitivity of the contractile apparatus (Lamb & Posterino, 2003) that this effect was not due simply to H2O2 oxidising the contractile proteins. Instead, it appeared that oxidation only led to an increase in steady-state Ca2+ sensitivity of the contractile apparatus if the fibres were briefly exposed (e.g. ≤ 2 min) to GSH afterwards, apparently because of the formation of a mixed disulphide between GSH and a particular free sulphydryl group on the contractile apparatus. GSH had no such effect in fibres that had not be oxidised, and the sensitivity increase occurring with the oxidation-GSH treatment was reversed by exposure to DTT or much more prolonged exposure (< 20 min) to GSH (Lamb & Posterino, 2003). Thus, we sought here to establish whether or not these distinctive and potentially important effects on the steady-state Ca2+ sensitivity were also apparent in twitch responses, where dynamic changes in cytoplasmic Ca2+ and force may alter the overall behaviour.
In fibres that had been oxidised by either H2O2 or DTDP, and not control fibres, exposure to GSH indeed caused potentiation of the twitch within 1–2 min in a redox-related manner, the effect being reversed by exposure to DTT (Figs 6 and 7). The reduction in peak force and half-width seen with the initial DTDP treatment, and the respective increases with subsequent GSH treatment (e.g. Fig. 7), are the opposite of the changes one would expect if the effects were due to the actions of the reagents on CICR (see Results). In contrast, all the effects are very well explained by the highly distinctive actions of all these agents on the Ca2+ sensitivity of the contractile apparatus (Lamb & Posterino, 2003; with DTDP also apparently having a deleterious effect on voltage-sensor activation, see Results). Furthermore, the increase in twitch size in fibres exposed to H2O2 and then GSH (Fig. 6), from ∼60 % to ∼70–75 % of maximum Ca2+ force, is very similar to that simplistically ‘expected’ from the increase in steady-state Ca2+ sensitivity (pCa50 increasing by ∼0.027 pCa units) measured in the contractile apparatus experiments with virtually the same treatment (10 mm H2O2, 5 min; 5 mm GSH, 2 min; Lamb & Posterino, 2003), assuming that the [Ca2+] at the peak of the twitch was unchanged in the two cases. Here, the sizes of the twitch before and after treatment, expressed as percentages of maximum force, are simply mapped on to the respective force–pCa curves describing the steady-state Ca2+ sensitivity of the contractile apparatus. The potentiation of the twitch with DTDP-GSH treatment (e.g. Fig. 7), however, is considerably smaller than what would be similarly ‘expected’ from the increase in steady-state Ca2+ sensitivity (∼0.27 pCa increase; compare changes in Fig. 7 with the force–pCa curves in Fig. 2 of Lamb & Posterino, 2003). This quite possibly simply reflects the fact that the total amount of Ca2+ released during the twitch is unchanged, and that a larger force response can only occur if the increase in the Ca2+ sensitivity of troponin-C is sufficiently great that more Ca2+ binds to the troponin-C at the expense of Ca2+ binding to other sites (e.g. the SR Ca2+ pump). Thus, even though it is not possible to make precise quantitative comparisons between the twitch potentiation data reported here and the steady-state force–pCa data obtained in the contractile apparatus experiments (Lamb & Posterino, 2003), there is clearly reasonable agreement between the studies, with both showing exactly the same highly distinctive sets of effects of the various agents. In view of this, we suggest that the potentiation of twitches and submaximal tetanic force observed in intact muscle fibres with H2O2 (Oba et al. 1996; Andrade et al. 1998) could be due to an increase in the Ca2+ sensitivity of the contractile apparatus following its oxidation by H2O2 (or more likely its redox products) and subsequent reaction with GSH present within the cytoplasm (see Lamb & Posterino, 2003).
Oxidation in normal function and fatigue
Finally, it is worth trying to consider how the various effects of oxidation bear on normal muscle function and muscle fatigue. The Ca2+ release channel in a muscle fibre is evidently readily oxidised in situ by the various oxidative treatments, such as those used here, in agreement with many previous studies on isolated preparations showing its ready susceptibility to oxidation (e.g. Zaidi et al. 1989; Favero et al. 1995). Although the sensitivity of the release channels to CICR was greatly enhanced, this did not alter the response to action-potential stimulation, indicating that this effect of oxidation has little, if any direct effect on normal Ca2+ release in a rested fibre. The coupling mechanism is evidently normally highly efficacious. This is also shown by the fact that action-potential-induced Ca2+ release is not noticeably affected by the presence of 30 mm lactate in the cytoplasm, even though this depresses CICR in the same fibres (Posterino et al. 2001). It is possible, nevertheless, that in certain conditions, various inhibitory effects on release channels are so profound that the voltage sensors are not able to elicit the normal amount of Ca2+ release. For example, this might happen after vigorous and prolonged stimulation, when there may be major changes in the cytoplasm (e.g. decrease in [ATP], increase in [Mg2+]; Allen et al. 1995, 2002), and possibly some level of chronic T-system depolarisation that inactivates some of the Na+ channels and voltage sensors there (Dulhunty, 1992; Fitts, 1994; Balog & Fitts, 2001). In such a case, oxidation of the release channels, which can improve the efficacy of its coupling with the voltage sensors (Fig. 5), might well help to maintain Ca2+ release at its normal level, that is, it may oppose factors that could cause muscle fatigue.
Oxidation of the release channels might also have relatively subtle effects, both in the short and long term. Increasing the sensitivity of CICR could appreciably increase the amount of Ca2+‘leaking’ out of the SR at rest (e.g. pCa ≥ 7), and although this is evidently a small flux in absolute terms (never leading to noticeable SR depletion or building up to give a detectable ‘spontaneous’ force response in the experiments here), it would presumably lead to a small elevation in resting cytoplasmic [Ca2+] in intact fibres (e.g. see Andrade et al. 1998). Such a rise in resting [Ca2+] could appreciably alter the distribution of cellular Ca2+ both within the cytoplasm and between the cytoplasm and the SR, and in that way indirectly affect the force response to stimulation. It could also affect many cellular signalling pathways, and hence affect the muscle in many other ways. In the extreme, continued Ca2+ leakage might trigger substantial reinforcement of CICR and a detectable force response, particularly in amphibian fibres (see Oba et al. 1996), where some of the release channels may be more sensitive to CICR than in mammalian muscle.
A second major site for oxidative effects is the contractile apparatus, as covered in detail in our previous study (Lamb & Posterino, 2003). This represents a second way in which oxidation could increase force responses, by increasing the Ca2+ sensitivity of the contractile proteins (Andrade et al. 1998), apparently by a specific GSH-mediated mechanism as outlined above. However, prolonged or stringent oxidative treatment subsequently depresses the force response (Andrade et al. 1998), by decreasing both the Ca2+ sensitivity and maximum force production of the contractile apparatus (Lamb & Posterino, 2003). By this latter action, oxidation could also contribute to muscle fatigue.
The third major way oxidation may impact on E–C coupling is by inhibiting activation of the voltage sensors, either by depolarising the T-system in some way (e.g. by opening or blocking particular ion channels in that membrane) or by directly interfering with the voltage sensors. If the T-system is chronically depolarised it can cause inactivation of the Na+ channels, leading to action potential failure, and inactivation of the voltage sensors (Dulhunty, 1992). We found that treatment with 200 μm–1 mm H2O2 (< 5 min) did not cause much interruption to the coupling, but that treatment with 10 mm H2O2 reduced or abolished action-potential-induced responses (e.g. Fig. 4B) and responses to depolarisation by ion substitution in a large proportion of fibres within 5 min. DTDP (100 μm) had an even greater deleterious effect. The effect was not due to depletion of SR Ca2+ or block of the release channel function, as it remained hypersensitive to direct activation even at 20 min in 10 mm H2O2 (Fig. 1; Table 1). The concentration- and time-dependence of the loss of the twitch response are very similar to those occurring with H2O2 treatment of intact fibres from frog muscle (Oba et al. 1996; see Introduction). Oxidation by H2O2 evidently interferes with the coupling, just as does oxidation by DTDP (Posterino & Lamb, 1996). The precise site(s) of this effect is not clear, but the fact that other sulphydryl reagents interfere with activation by voltage steps in voltagE–Clamped fibres (Caputo et al. 1993) indicates that the voltage sensors themselves are directly involved in at least some cases. Thus, this type of effect represents a second major way in which oxidation could deleteriously affect E–C coupling and hence contribute to muscle fatigue.
In conclusion, this study gives important information about the characteristics of the E–C coupling mechanism in skeletal muscle and how various steps are affected by oxidation, and thus how they can contribute to, or counter, impairment of muscle performance.
Acknowledgments
We thank Aida Yousef for technical assistance, Professor George Stephenson for helpful discussions and comments, and the National Health & Medical Research Council of Australia for financial support (Grant 991496).
REFERENCES
- Allen DG, Lännergren J, Westerblad H. Muscle cell function during prolonged activity: cellular mechanisms of fatigue. Exp Physiol. 1995;80:497–527. doi: 10.1113/expphysiol.1995.sp003864. [DOI] [PubMed] [Google Scholar]
- Allen DG, Lännergren J, Westerblad H. Intracellular ATP measured with luciferin/luciferase in isolated single mouse skeletal muscle fibres. Pflügers Arch. 2002;443:836–842. doi: 10.1007/s00424-001-0756-y. [DOI] [PubMed] [Google Scholar]
- Andrade FH, Reid MB, Allen DG, Westerblad H. Effect of hydrogen peroxide and dithiothreitol on contractile function of single skeletal muscle fibres from the mouse. J Physiol. 1998;509:565–575. doi: 10.1111/j.1469-7793.1998.565bn.x. [DOI] [PMC free article] [PubMed] [Google Scholar]
- Bakker AJ, Lamb GD, Stephenson DG. The effect of 2,5-di-(tert-butyl)-1, 4-hydroquinone on force responses and the contractile apparatus in mechanically skinned muscle fibres of the rat and toad. J Muscle Res Cell Motil. 1996;17:55–67. doi: 10.1007/BF00140324. [DOI] [PubMed] [Google Scholar]
- Balog EM, Fitts RH. Effects of depolarisation and low intercellular pH on charge movement currents of frog skeletal muscle fibers. J Appl Physiol. 2001;90:228–234. doi: 10.1152/jappl.2001.90.1.228. [DOI] [PubMed] [Google Scholar]
- Barclay JK, Hansel M. Free radicals may contribute to oxidative skeletal muscle fatigue. Can J Physiol Pharmacol. 1991;69:279–284. doi: 10.1139/y91-043. [DOI] [PubMed] [Google Scholar]
- Brotto MA, Nosek TM. Hydrogen peroxide disrupts Ca2+ release from the sarcoplasmic reticulum of rat skeletal muscle fibers. J Appl Physiol. 1996;81:731–737. doi: 10.1152/jappl.1996.81.2.731. [DOI] [PubMed] [Google Scholar]
- Caputo C, Bolaños P, Gonzalez A. Effects of sulfhydryl inhibitors on depolarization-contraction coupling in frog skeletal muscle fibers. J Gen Physiol. 1993;101:411–424. doi: 10.1085/jgp.101.3.411. [DOI] [PMC free article] [PubMed] [Google Scholar]
- Donoso P, Aracena P, Hidalgo C. Sulfhydryl oxidation overrides Mg2+ inhibition of calcium-induced calcium release in skeletal muscle triads. Biophys J. 2000;79:279–286. doi: 10.1016/S0006-3495(00)76290-4. [DOI] [PMC free article] [PubMed] [Google Scholar]
- Dulhunty AF. The voltage-activation of contraction in skeletal muscle. Prog Biophys Mol Biol. 1992;57:181–223. doi: 10.1016/0079-6107(92)90024-z. [DOI] [PubMed] [Google Scholar]
- Eager KR, Roden LD, Dulhunty AF. Actions of sulfhydryl reagents on single ryanodine receptor Ca(2+)-release channels from sheep myocardium. Am J Physiol. 1997;272:C1908–1918. doi: 10.1152/ajpcell.1997.272.6.C1908. [DOI] [PubMed] [Google Scholar]
- Endo M. Calcium release from sarcoplasmic reticulum. Curr Top Membr Transp. 1985;25:181–230. [Google Scholar]
- Favero TG, Zable AC, Abramson JJ. Hydrogen peroxide stimulates the Ca2+ release channel from skeletal muscle sarcoplasmic reticulum. J Biol Chem. 1995;270:25557–25563. doi: 10.1074/jbc.270.43.25557. [DOI] [PubMed] [Google Scholar]
- Feng W, Liu GH, Allen PD, Pessah IN. Transmembrane redox sensor of ryanodine receptor complex. J Biol Chem. 2000;275:35902–35907. doi: 10.1074/jbc.C000523200. [DOI] [PubMed] [Google Scholar]
- Fitts RH. Cellular mechanisms of muscle fatigue. Physiol Rev. 1994;74:49–94. doi: 10.1152/physrev.1994.74.1.49. [DOI] [PubMed] [Google Scholar]
- Hollingworth S, Zhao M, Baylor SM. The amplitude and time course of the myoplasmic free [Ca2+] transient in fast-twitch fibers of mouse muscle. J Gen Physiol. 1996;108:455–465. doi: 10.1085/jgp.108.5.455. [DOI] [PMC free article] [PubMed] [Google Scholar]
- Jong D-S, Pape PC, Chandler WK, Baylor SM. Reduction of calcium inactivation of sarcoplasmic reticulum calcium release by Fura-2 in voltage-clamped cut twitch fibers from frog muscle. J Gen Physiol. 1993;102:333–370. doi: 10.1085/jgp.102.2.333. [DOI] [PMC free article] [PubMed] [Google Scholar]
- Lamb GD. Excitation-contraction coupling in skeletal muscle: comparisons with cardiac muscle. Clin Exp Pharmacol Physiol. 2000;27:216–224. doi: 10.1046/j.1440-1681.2000.03224.x. [DOI] [PubMed] [Google Scholar]
- Lamb GD, Cellini MA. High intracellular [Ca2+] alters sarcoplasmic reticulum function in skinned muscle fibres of the rat. J Physiol. 1999;519:815–827. doi: 10.1111/j.1469-7793.1999.0815n.x. [DOI] [PMC free article] [PubMed] [Google Scholar]
- Lamb GD, Cellini MA, Stephenson DG. Different Ca2+ releasing actions of caffeine and depolarization in skeletal muscle fibres of the rat. J Physiol. 2001;531:715–728. doi: 10.1111/j.1469-7793.2001.0715h.x. [DOI] [PMC free article] [PubMed] [Google Scholar]
- Lamb GD, Posterino GS. Effects of oxidation and reduction on contractile function in skeletal muscle fibres of the rat. J Physiol. 2003;546:149–163. doi: 10.1113/jphysiol.2002.027896. [DOI] [PMC free article] [PubMed] [Google Scholar]
- Lamb GD, Stephenson DG. Control of calcium release and the effect of ryanodine in skinned muscle fibres of the toad. J Physiol. 1990;423:519–542. doi: 10.1113/jphysiol.1990.sp018037. [DOI] [PMC free article] [PubMed] [Google Scholar]
- Lamb GD, Stephenson DG. Effect of Mg2+ on the control of Ca2+ release in skeletal muscle fibres of the toad. J Physiol. 1991;434:507–528. doi: 10.1113/jphysiol.1991.sp018483. [DOI] [PMC free article] [PubMed] [Google Scholar]
- Lamb GD, Stephenson DG. Effects of intracellular pH and [Mg2+] on excitation-contraction coupling in skeletal muscle fibres of the rat. J Physiol. 1994;478:331–339. doi: 10.1113/jphysiol.1994.sp020253. [DOI] [PMC free article] [PubMed] [Google Scholar]
- Launikonis BS, Stephenson DG. Effect of saponin treatment on the sarcoplasmic reticulum of rat, cane toad and crustacean (yabby) skeletal muscle. J Physiol. 1997;504:425–437. doi: 10.1111/j.1469-7793.1997.425be.x. [DOI] [PMC free article] [PubMed] [Google Scholar]
- Laver DR, Baynes TM, Dulhunty AF. Magnesium-inhibition of ryanodine-receptor calcium channels: evidence for two independent mechanisms. J Membr Biol. 1997;156:213–229. doi: 10.1007/s002329900202. [DOI] [PubMed] [Google Scholar]
- Laver DR, Lamb GD. Inactivation of Ca2+ release channels (ryanodine receptors RYR1 and RYR2) with rapid steps in [Ca2+] and voltage. Biophys J. 1998;74:2352–2364. doi: 10.1016/S0006-3495(98)77944-5. [DOI] [PMC free article] [PubMed] [Google Scholar]
- Meissner G, Darling E, Eveleth J. Kinetics of rapid Ca2+ release by sarcoplasmic reticulum. Effects of Ca2+, Mg2+, and adenine nucleotides. Biochemistry. 1986;25:236–244. doi: 10.1021/bi00349a033. [DOI] [PubMed] [Google Scholar]
- Mejia-Alvarez R, Kettlum C, Rios E, Stern M, Fill M. Unitary Ca2+ current through cardiac ryanodine receptor channels under quasi-physiological ionic conditions. J Gen Physiol. 1999;113:177–186. doi: 10.1085/jgp.113.2.177. [DOI] [PMC free article] [PubMed] [Google Scholar]
- Melzer W, Herrmann-Frank A, Lüttgau HC. The role of Ca2+ ions in excitation-contraction coupling of skeletal muscle fibres. Biochim Biophys Acta. 1995;1241:59–116. doi: 10.1016/0304-4157(94)00014-5. [DOI] [PubMed] [Google Scholar]
- Moisescu DG, Thieleczek R. Calcium and strontium concentration changes within skinned muscle preparations following a change in the external bathing solution. J Physiol. 1978;275:241–262. doi: 10.1113/jphysiol.1978.sp012188. [DOI] [PMC free article] [PubMed] [Google Scholar]
- Oba T, Koshita M, Yamaguchi M. H2O2 modulated twitch tension and increases Po of Ca2+ release channel in frog skeletal muscle. Am J Physiol. 1996;40:C810–818. doi: 10.1152/ajpcell.1996.271.3.C810. [DOI] [PubMed] [Google Scholar]
- Oba T, Murayama T, Ogawa Y. Redox states of type 1 ryanodine receptor alter Ca2+ release channel response to modulators. Am J Physiol. 2002;282:C684–692. doi: 10.1152/ajpcell.01273.2000. [DOI] [PubMed] [Google Scholar]
- Pizarro G, Shirokova N, Tsugorka A, Rios E. ‘Quantal’ calcium release operated by membrane voltage in frog skeletal muscle. J Physiol. 1997;501:289–303. doi: 10.1111/j.1469-7793.1997.289bn.x. [DOI] [PMC free article] [PubMed] [Google Scholar]
- Plant DR, Lynch GS, Williams DA. Hydrogen peroxide increases depolarization-induced contraction of mechanically skinned slow twitch fibres from rat skeletal muscles. J Physiol. 2002;539:883–891. doi: 10.1113/jphysiol.2001.013369. [DOI] [PMC free article] [PubMed] [Google Scholar]
- Posterino GS, Dutka TL, Lamb GD. L(+)-lactate does not affect twitch and tetanic responses in mechanically skinned mammalian muscle fibres. Pflügers Arch. 2001;442:197–203. doi: 10.1007/s004240100528. [DOI] [PubMed] [Google Scholar]
- Posterino GS, Lamb GD. Effects of reducing agents and oxidants on excitation-contraction coupling in skeletal muscle fibres of rat and toad. J Physiol. 1996;496:809–825. doi: 10.1113/jphysiol.1996.sp021729. [DOI] [PMC free article] [PubMed] [Google Scholar]
- Posterino GS, Lamb GD, Stephenson DG. Twitch and tetanic force responses and longitudinal propagation of action potentials in skinned skeletal muscle fibres of the rat. J Physiol. 2000;527:131–137. doi: 10.1111/j.1469-7793.2000.t01-2-00131.x. [DOI] [PMC free article] [PubMed] [Google Scholar]
- Reid MB. Redox modulation of skeletal muscle contraction: what we know and what we don't. J Appl Physiol. 2001;90:724–731. doi: 10.1152/jappl.2001.90.2.724. [DOI] [PubMed] [Google Scholar]
- Reid MB, Khawli FA, Moody MR. Reactive oxygen in skeletal muscle. III. Contractility of unfatigued muscle. J Appl Physiol. 1993;75:1081–1087. doi: 10.1152/jappl.1993.75.3.1081. [DOI] [PubMed] [Google Scholar]
- Salama G, Abramson JJ, Pike GG. Sulphydryl reagents trigger Ca2+ release from the sarcoplasmic reticulum of skinned rabbit psoas fibres. J Physiol. 1992;454:389–420. doi: 10.1113/jphysiol.1992.sp019270. [DOI] [PMC free article] [PubMed] [Google Scholar]
- Schneider MF, Simon BJ. Inactivation of calcium release from the sarcoplasmic reticulum in frog skeletal muscle. J Physiol. 1988;405:727–745. doi: 10.1113/jphysiol.1988.sp017358. [DOI] [PMC free article] [PubMed] [Google Scholar]
- Shirokova N, Garcia J, Rios E. Local calcium release in mammalian skeletal muscle. J Physiol. 1998;512:377–384. doi: 10.1111/j.1469-7793.1998.377be.x. [DOI] [PMC free article] [PubMed] [Google Scholar]
- Shirokova N, Rios E. Caffeine enhances intramembranous charge movement in frog skeletal muscle by increasing cytoplasmic Ca2+ concentration. J Physiol. 1996;493:341–356. doi: 10.1113/jphysiol.1996.sp021387. [DOI] [PMC free article] [PubMed] [Google Scholar]
- Zaidi NF, Lagenaur CF, Abramson JJ, Pessah I, Salama G. Reactive disulfides trigger Ca2+ release from sarcoplasmic reticulum via an oxidation reaction. J Biol Chem. 1989;264:21725–21736. [PubMed] [Google Scholar]