

Abstract
A putative Na+ component playing a role in the initiation and maintenance of spontaneous discharge in Purkinje fibres was studied by means of the whole-cell patch-clamp technique in canine cardiac single Purkinje cells. In 4 mm[K+]o, during depolarising clamp steps, a slowly inactivating current appeared at ∼−58 mV, negative to the threshold for the fast Na+ current (INa; ∼−50 mV). During depolarising ramps, the current underwent inward rectification with a negative slope region that began at ∼−60 mV. The current underlying the negative slope increased during faster ramps, decreased as a function of time when the initial depolarising ramp was over, decreased during depolarisations positive to ∼−35 mV and was much larger than the current during the symmetrical repolarising ramp. Increasing biphasic (‘oscillatory’) voltage ramps required much smaller currents at a holding potential (Vh) of −60 mV than at −80 mV and were associated with a marked decrease in slope conductance. At Vh−50/−40 mV, the oscillatory ramp currents and superimposed pulse currents reversed direction. The negative slope in the I-V relation as well as the change in current direction at −50/−40 mV were markedly reduced by tetrodotoxin (15 μm) and lidocaine (lignocaine, 100 μm) and therefore are due to a slowly inactivating Na+ current, labelled here INa3. Lower [K+]o (2.7 mm) reduced the steady state slope conductance as well as the current in the diastolic range, and increased as well as shifted INa3 in a negative direction. High [K+]o had the opposite effects. Cs+ (2 mm) and Ba2+ (2 mm) reduced the initial current during depolarising ramps but not INa3. In current-clamp mode, current-induced voltage oscillations elicited action potentials through a gradual transition between diastolic depolarisation and upstroke, consistent with the activation of INa3. Thus, the initiation and maintenance of spontaneous discharge in Purkinje strands appear to involve a voltage- and K+-dependent decrease in K+ conductance as well as the activation of a voltage- and time-dependent inward Na+ current (INa3) with slow inactivation kinetics.
It is generally believed that in spontaneous cardiac Purkinje fibres, diastolic depolarisation (DD) attains the threshold for the upstroke of the action potential (AP). However, this notion may involve a degree of simplification, since in spontaneously discharging Purkinje fibres tetrodotoxin (TTX) induces quiescence by suppressing the last part of DD (Vassalle & Scidá, 1979; see Fig. 2 in Vassalle, 1983). The implication of this finding is that the last part of diastolic depolarisation somehow activates a TTX-sensitive component that brings the membrane potential to the threshold. Therefore, this component would be required for the maintenance of spontaneous discharge.
Figure 2. Time dependence of the negative slope region amplitude.
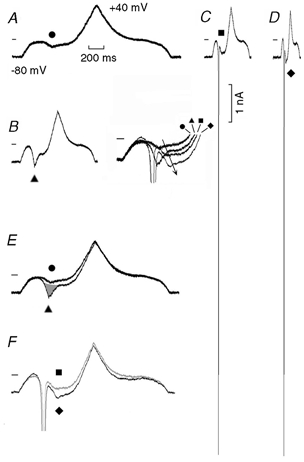
Depolarising and repolarising ramps were applied from a Vh of −80 mV to +40 mV. The slope of the ramps was 120 (A), 240 (B), 480 (C) and 960 (D) mV s−1. In B, the traces labelled with the different symbols were superimposed by aligning the holding currents: the arrow emphasises the growth in the amplitude of the negative slope. In E and F the traces were superimposed by expanding different time bases to the same length. In E, the grey area emphasises a presumed sub-threshold fast INa. In F, the traces labelled by a square in C and by a diamond in D were superimposed. The trace from C (▪) is shown in grey (instead of black) for enhanced clarity. The time calibration (200 ms) applies to A-D.
This same component may also be all important for the initiation of spontaneous discharge. Diastolic depolarisation is an after-potential and therefore its appearance requires a previous action potential, which is not available in a quiescent fibre. Instead, when [K+]o is suitably lowered, the initiation of spontaneous discharge is characterised by the fact that the resting potential undergoes progressively larger voltage oscillations (ThVos: the voltage oscillations near the threshold for the upstroke; Spiegler & Vassalle, 1995). The depolarising phase of a ThVos eventually attains the threshold potential (Vassalle, 1965; Spiegler & Vassalle, 1995; Berg & Vassalle, 2000) and initiates spontaneous discharge.
As the low [K+]o perfusion continues, the voltage range of ThVos (‘oscillatory zone’) shifts to more negative values, ThVos occur progressively sooner during diastole, and eventually ThVos fuse with the early diastolic depolarisation (DD1): at that time, DD appears to directly continue into the upstroke of the action potential (Berg & Vassalle, 2000). However, that the depolarising phase of ThVos (not DD) is responsible for the attainment of the threshold even when ThVos are no longer visible is suggested by fact that when [K+]o is increased again, the failure of the membrane potential to attain the threshold unmasks ThVos (see Fig. 7 in Vassalle, 1977) which gradually decrease in size until a steady resting potential is attained (Berg & Vassalle, 2000). Therefore, a TTX-sensitive component appears to be an essential part of ThVos and to be required for both initiation and maintenance of discharge in Purkinje fibres.
Figure 7. Effects of high [K+]o on the I-V relation and negative slope.
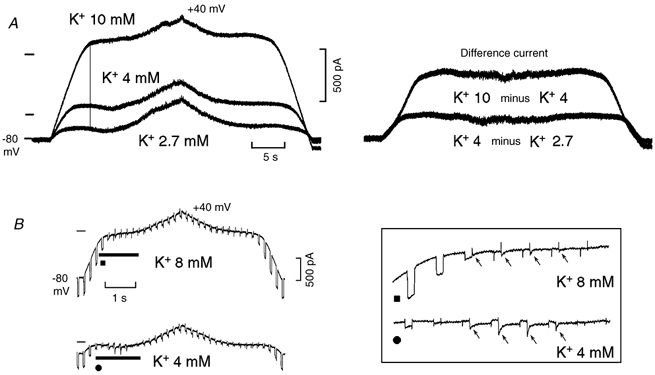
A, left panel, the I-V relation during slow depolarising and repolarising ramps (6 mV s−1) was investigated in control (4 mm[K+]o), in the presence of high [K+]o (10 mm) and low [K+]o (2.7 mm). The vertical line emphasises the later and less pronounced inward rectification in high [K+]o. In the right panel of A, the difference currents are shown. In B, the traces were recorded in another cell during faster ramps (36 mV s−1) with superimposed hyperpolarising steps (50 ms duration, 9 mV amplitude) in 4 mm and 8 mm[K+]o. The portions of the traces marked by thick strips in first panel of B are shown at higher gain in the boxed inset. The arrows point to the inward transients that followed the hyperpolarising steps and slowly decayed. In the left panel of A, the zero current is indicated in 10 mm[K+]o (top line), in 4 mm[K+]o (middle line) and in 2.7 mm[K+]o (bottom line).
The fact that TTX abolishes the last part of DD as well as ThVos suggests that a Na+ current is involved. In order to account for the final depolarisation that attains the threshold for the upstroke, this Na+ component would have to inactivate slowly. Slowly inactivating Na+ currents have been reported in several cardiac tissues (see Discussion), but the most pertinent finding in the present context is that in Purkinje fibres there is a slowly inactivating Na+ current spanning from −80 mV (Gintant et al. 1984) or even −90 mV (Carmeliet, 1987) to positive values. In Purkinje cells, a slowly inactivating Na+ current begins to appear at −40 mV, reaching a peak value at −30/−20 mV (INa2; Vassalle & Du, 2000; Bocchi & Vassalle, 2000). This raises the possibility that there might be another TTX-sensitive component (tentatively referred to as INa3) in the diastolic potential range and that the slowly inactivating Na+ current reported in Purkinje fibres over a large voltage range might be the sum of INa2 and INa3.
The general aim of the present experiments was to investigate by means of patch voltage- and current-clamp techniques the ionic events in the range of diastolic depolarisation in single Purkinje cells (rather than in Purkinje fibres) in order to obtain a better voltage control and avoid the complications (Baumgarten & Isenberg, 1977; Cohen & Kline, 1982; Kline & Cohen, 1984) associated with ion depletion and accumulation in narrow extracellular spaces.
The specific aims addressed the following questions. (1) Is it possible to activate two different slow Na+ components (INa2 and INa3) in two different ranges? (2) Does the current-voltage (I-V) relation in the diastolic range have features that might be related to the pacemaking process? (3) Are these features voltage- and/or time-dependent? (4) Which ionic events may contribute to ThVos? (5) How do the currents needed to induce increasing voltage oscillations vary as the oscillatory zone is approached? (6) How does the membrane conductance change under the same conditions? (7) How are these events modified by interventions that lead to the initiation (low [K+]o) or suppression (high [K+]o) of spontaneous discharge? (8) How do blockers of Na+ channels (TTX and lidocaine (lignocaine)) and of K+ channels (Cs+ and Ba2+) affect the currents in the DD range?
Methods
Animals were cared for and handled in accordance with the local Animal Care and Use Committee and national guidelines. Adult dogs (beagle) of either sex weighing 8–14 kg were killed by rapid intravenous injection of sodium pentobarbital (60 mg kg−1). Once respiration had ceased and reflexes were no longer present, the heart was immediately removed and rinsed in Tyrode solution. Purkinje fibre bundles were dissected from both ventricles and were superfused in the tissue bath at 37 °C for 30 min while being stimulated at 60 min−1. The composition of Tyrode solution was (mm): NaCl 140, KCl 4, CaCl2 1.8, MgCl2 1, Hepes 5 and glucose 5.5 (pH was adjusted to 7.4 with NaOH). The fibres were then rinsed with Ca2+-free solution which contained (mm): NaCl 120, KCl 12, KH2PO4 1.2, MgCl2 3, Hepes 5, glucose 11, taurine 5, sodium β-hydroxybutyrate 5 and sodium pyruvate 5 (pH adjusted to 7.2 with NaOH).
The Purkinje strands were digested with an ‘enzyme solution’ which contained (mm): KCl 140, KH2PO4 1.2, MgCl2 2, Hepes 5, glucose 11, taurine 25, sodium β-hydroxybutyrate 5 and sodium pyruvate 5 (pH adjusted to 7.2 with KOH) and to which collagenase (1 mg ml−1, type VIII; Sigma, St Louis, MO, USA), elastase (0.6 mg ml−1, type II-A, Sigma), fat-free bovine serum albumin (2 mg ml−1) and a trypsin inhibitor (1.5 mg ml−1, type II-S: Soybean, Sigma) had been added. An aliquot of 50 μl of 2.5 mm CaCl2 was added to 5 ml of the enzyme solution.
During the enzymatic digestion, the fibres were shaken in a thermostated bath at 37 °C for 40 min. The fibres were then shaken in the same enzyme solution utilising a mechanical ‘triturator’ that passed the fibres repeatedly through a pipette at 37 °C. The agitation was controlled by a Z-80-based microprocessor interfaced to a linear actuator and piston/cylinder (Datyner et al. 1985).
The solution was sampled for the presence of single Purkinje cells under microscopic examination and the trituration repeated as needed. The final suspension was centrifuged at 50 g for 5 min, the supernatant discarded and the pellet was resuspended in a Kraftbrühe (KB) solution of the following composition (mm): KCl 85, KH2PO4 30, MgSO4 5, glucose 20, sodium pyruvate 5, creatine 5, taurine 5, EGTA 0.5, sodium β-hydroxybutyrate 5, succinic acid 5 and ATP (2.74 mg ml−1) (pH adjusted to 7.2 with KOH).
The single cells thus obtained were stored in KB solution for about 60 min at room temperature. An aliquot of the cell suspension was placed in a recording chamber located on the stage of an inverted microscope (Diaphot, Nikon, Tokyo, Japan) equipped with Hoffman modulation contrast optics (× 200 magnification). The cells were allowed to settle at glass bottom of the chamber and then were perfused with oxygenated Tyrode solution at 37 °C.
Data were acquired by means of the whole-cell ruptured patch-clamp technique in voltage- and current-clamp mode, by means of an Axopatch-1D amplifier (Axon Instruments, Foster City, CA, USA). Electrical signals were digitised using a 333 kHz 12-bit resolution A/D converter (Digidata 1200, Axon Instruments) and recorded using Clampex software (pCLAMP 8.0, Axon Instruments) with low-pass filtering at 2 kHz. To check the effects of cell dialysis, in some experiments the perforated patch-clamp technique was also used: the results were undistinguishable from those with the ruptured patch-clamp method.
The pipettes were pulled by means of a Narishige PP-83 Glass Microelectrode Puller (Narishige, Tokyo, Japan) and had a resistance of 2–4 MΩ when filled with the following solution (mm): potassium aspartate 100, KCl 30, MgCl2 2, EGTA 11, Na-Hepes 10, Na2-ATP 2, Na-GTP 0.1, CaCl2 5 (pH adjusted to 7.2 with KOH). In the perforated patch method the pipettes were backfilled with the solution containing amphotericin B. This solution was prepared by adding an aliquot of amphotericin B dissolved in DMSO (3 mg in 50 μl) to the pipette solution (20 μl in 5 ml).
After seal formation (1–8 GΩ), the membrane was ruptured by applying suction. With the amphotericin approach, the patch became perforated in 1–2 min. The single Purkinje cells were studied under control conditions in the absence of channel blockers (TTX, lidocaine, Cs+, Ba2+). These blockers were tested only after the control recording had been carried out. TTX (Sigma) and lidocaine hydrochloride (Sigma) were used in concentrations of 15 and 100 μm, respectively. Successive command steps of the same protocol were applied at intervals of at least 5 s.
In the whole-cell configuration, membrane capacitance (Cm) and series resistance (Rs) were estimated using pCLAMP algorithm in Vclamp mode. In 24 cells from five dogs, Cm was 121.9 ± 4.8 pF and Rs was 7.2 ± 0.9 MΩ (with a pipette resistance of 2.7 ± 0.1 MΩ). In part of the experiments membrane capacitance was compensated whereas generally series resistance was not compensated.
The percentage change in current was calculated according to the following procedure: (test current × 100/control current) − 100. For example, if the current decreased from control +100 pA to +20 pA, the percentage change was given as −80 %. If the current changed from a control +100 pA (outward direction) to −20 pA (inward direction), the percentage change was given as −120 %.
In current-clamp experiments, the depolarising phase leading to the upstroke was fitted with a two-term standard exponential function (using Chebyshev technique with Clampfit software) according to the following equation:
| (1) |
where A1 and A2 are the amplitudes, τ1 and τ2 are the time constants and C is the offset constant.
The fast Na+ current is referred to as INa. For clarity and convenience, the slowly inactivating current that underlies the negative slope in the diastolic potential range is referred to as INa3 and that in the plateau range is referred to as INa2 (Vassalle & Du, 2000; Bocchi & Vassalle, 2000).
In the text n refers to the number of cells studied. The total number of dogs used was 19, and for each protocol the cells studied were obtained from a minimum of three dogs (average 4.76 ± 0.5 dogs per protocol). Data were analysed by means of the Clampfit (pCLAMP 8.0) and Microsoft Excel programs. Results of the experiments are shown as means ±s.e.m. (standard error of the mean). Student's paired t test between two terms of comparison and one-way ANOVA between a data group were applied and a P < 0.05 was considered significant (marked in the text by an asterisk, *). n.s. indicates a statistically ‘not significant’ difference.
Results
Separation of INa, INa2 and INa3
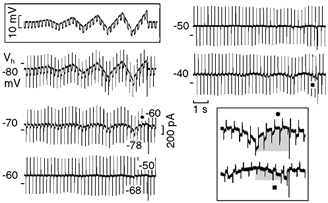
In Fig. 1, depolarising steps were applied from a Vh of −80 mV to less negative values in increments of 2 mV. During the depolarising steps at more negative potentials, the current did not change as a function of time (not shown). During the step to −58 mV, a slowly decaying inward component appeared which increased in size during the −56 mV step (labelled INa3, see the circle and the dashed line). During the step to −52 mV, INa quickly activated and inactivated (see trace at normal gain) and was not followed by a slowly decaying inward current component (see trace at high gain), in confirmation of previous findings obtained with depolarising steps increasing by 10 mV (Vassalle & Du, 2000; Bocchi & Vassalle, 2000). Only when the depolarising step was applied to −40 mV, INa inactivation was interrupted by a slowly decaying inward component which became larger at −32 mV (labelled INa2, see the square and the dashed line) (Vassalle & Du, 2000; Bocchi & Vassalle, 2000). Typically, INa2 was larger and decayed more slowly than INa3 and it was incompletely inactivated by the end of the 500 ms step (see boxed inset).
Figure 1. Different sodium components during depolarising steps to different values.
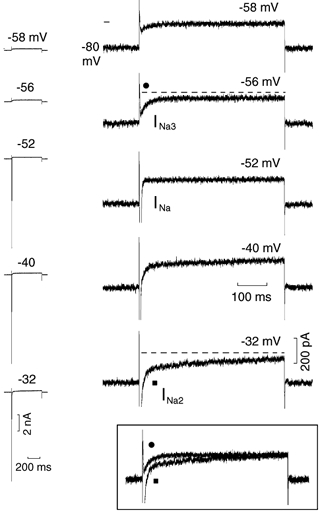
Depolarising 500 ms steps were applied from Vh−80 mV in increments of 2 mV. The current traces are shown on the left side of the figure and at higher gain on the right side of the figure. The numbers above the traces identify the potential during the steps. The dashed lines emphasise the decay of INa3 (•) and INa2 (▪). INa2 and INa3 traces are superimposed in the boxed inset (same respective symbols). In this and in each of the following figures, all traces were recorded from the same cell, unless otherwise indicated; the small line next to traces indicates the zero current.
In n = 7, with steps of increasing amplitude (2 mV), INa3 appeared at −57.8 ± 0.5 mV and its magnitude was 155.7 ± 22.5 pA at −55.3 ± 0.7 mV. INa appeared at −52.4 ± 0.8 mV and its amplitude was greater than 11 nA (six of the seven experiments); at this potential, in no instance was the inactivation of INa followed by a time-dependent current. In the same experiments (steps increasing by 2–5 mV), INa2 appeared at −43.6 ± 0.7 mV and its amplitude was 392.8 ± 22.0 pA at −26.9 ± 1.8 mV (measured from the point where the extrapolated INa and INa2 met and the current at the end of the 500 ms step).
In preliminary experiments, INa, INa2 and INa3 were also separated with the following protocol. A depolarising ramp from Vh−80 mV to a potential negative to INa threshold elicited only INa3. Then, a depolarising step from Vh−80 mV to −50 mV initiated only INa: a subsequent depolarising ramp superimposed on the step elicited only INa2. In another approach, suitably slow ramps that failed to initiate INa elicited two slowly inactivating inward components: a smaller one beginning at about −60 mV followed by a larger one beginning at about −40 mV.
Current-voltage relation and its dependence on the rate of voltage change
Since ThVos appear toward the end of diastolic depolarisation, slow depolarising and repolarising ramps were applied to elicit INa3 in the absence and presence of INa. The slope of the ramps was gradually increased to explore whether different components of the I-V relation depend on time as well as on voltage (see Gintant et al. 1984).
In Fig. 2A, during the depolarising ramp, the current underwent a marked inward rectification with a negative slope (tentatively attributed to the slow inactivation of INa3), following which there was an increase in current in an outward direction. The current during the repolarising ramp differed from that during the depolarising ramp in that its decline on repolarisation did not include a change in slope.
In confirmation of the findings of Gintant et al. (1984), in our Fig. 2B, the faster ramp resulted in a more pronounced negative slope, as emphasised in Fig. 2E by the superimposed traces expanded to the same length. However, during this faster ramp (▴), the current activating and inactivating at a faster rate (grey area) may have been a sub-threshold component of INa which was superimposed on the negative slope. During the repolarising ramp, the currents in A and B were similar (Fig. 2E), suggesting that both slow and sub-threshold fast inward components were largely inactivated.
In Fig. 2C and D, the faster depolarising ramps initiated INa superimposed on a negative slope which was larger during the fastest ramps (see Fig. 2F).The four traces labelled with the different symbols show that the negative slope peaked at less negative potentials with respect to INa and became greater during the faster ramps (emphasised by the arrow), indicating a time dependence of the underlying current. During the repolarising Fig. 2C and D ramps, a small positive slope region was present in the I-V relation. Similar results were also obtained when the amplitude of the fast INa was reduced by slower depolarising ramps.
The average results (Table 1) show that the amplitude of the current between holding value and the beginning of INa3 was little affected by the different ramp slopes (n.s., ANOVA), only the last value was significantly different from the first (+12.4 %*, t test). With faster ramps, the threshold for INa3 was little affected (n.s., ANOVA) whereas its peak value increased and occurred at less negative potentials (*, ANOVA). During the fastest ramps, a contribution of sub-threshold INa and of INa2 to the amplitude of the negative slope cannot be ruled out for two reasons: (1) with the faster ramps the inactivation of INa and INa2 channels below their threshold would also decrease; and (2) the peak of the negative slope entered a voltage range where INa2 begins to activate.
Table 1.
Effects of ramps with different slopes
| Ramp slope | 120 mV s−1 | 240 mV s−1 | 480 mV s−1 | 960 mV s−1 |
|---|---|---|---|---|
| Ivh–INa3 (pA) | 249.4 ± 68.6 | 250.5 ± 70.2 | 259.4 ± 71.9 | 280.5 ± 77.2 (n.s.) |
| INa3Th(mV) | −58.0 ± 1.1 | −63.0 ± 2.3 | −61.9 ± 0.9 | −61.6 ± 0.9 |
| INa3 peak(mV) | −40.4 ± 1.6 | −40.3 ± 3.1 | −32.5 ± 2.9 | −27.7 ± 1.8* |
| INa3 (pA) | 103.8 ± 18.3 | 244.4 ± 40.7 | 411.6 ± 67.1 | 588.8 ± 76.7* |
| INa (pA) | — | >11,000 (3/3) | >11,000 (5/7) | >11,000 (8/9) |
| INa Th (mV) | — | −49.3 ± 3.0 | −49.2 ± 2.9 | −49.9 ± 1.3 |
| PS peak (mV) | −36.2 ± 0.3 (2/9) | −32.0 ± 3.0 (4/9) | −35.4 ± 3.0 (6/9) | −32.1 ± 2.6 (6/9) |
| PS minimum (mV) | −49.6 ± 3.2 | −45.3 ± 3.5 | −49.5 ± 2.8 | −47 ± 1.6 |
| IPS (pA) | 15.0 ± 5.0 | 17.5 ± 11.0 | 29.1 ± 9.8† | 50.8 ± 13.6†‡ |
n = 9. IVh–INa3, current between the holding potential value and that at the beginning of INa3; INa3 Th, threshold potential of INa3; INa3, peak, voltage at which INa3 peaked; INa3, amplitude of INa3; INa, amplitude of INa which was > 11000 pA in the fraction of tests indicated in parenthesis; INa Th, threshold potential of INa; PS peak, potential at which the positive slope began, the numbers in parentheses indicate the fraction of tests in which PS was present; PS minimum, voltage at which the positive slope terminated; IPS, amplitude of the positive slope current;
Significantly different for data group (ANOVA);
Significantly different from INa3;
Significantly different from IPS during the two fastest ramps (P < 0.052).
The amplitude of INa3 with the slowest ramp was small in comparison to INa (less than 1 % of the maximum INa recordable). The fast sub- and supra-threshold INa components occurred more often with the faster ramps, the threshold for INa being ∼−50 mV (Table 1). A positive slope region was present during the repolarising ramps with a smaller potential range and amplitude (about 1/10th) than those of the negative slope during the depolarising ramp (Table 1). In preliminary tests, reduction of [Na+]o by 50 % markedly reduced INa3, whereas in one experiment increasing [Ca2+]o by 48 % actually resulted in a somewhat smaller negative slope.
Increasing voltage-clamp oscillations in different potential ranges
Increasing voltage-clamp oscillations (simulating ThVos) were applied over the voltage range of DD to determine the characteristics of the currents needed to induce them.
In Fig. 3, the protocol (top boxed inset) was applied at different Vh. With Vh−80 mV (with respect to holding current Ih) during the largest depolarising ramps, the current fraction that was outward was smaller than the current fraction that was inward (see dashed line drawn at the level of Ih). At gradually less negative Vh values, the ramp currents became smaller in either direction and the asymmetry between outward and inward fractions became greater. Thus, with Vh of −70, −60, −50 and −40 mV, the current during the last depolarising ramp was 72, 87, 102 and 110 % smaller, respectively, than that with Vh−80 mV. At less negative voltages the currents changed direction (cf. traces labelled by •, ▪ and ♦ within and without the boxed inset).
Figure 3. Inward rectification in the diastolic depolarisation range.
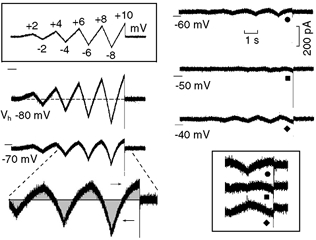
The voltage-clamp protocol (top inset) consisted of ramps that increased by an additional 2 mV with each swing, the depolarising phase lasting 1000 ms and the hyperpolarising phase 700 ms. The oscillatory ramps were applied at Vh of −80, −70, −60, −50 and −40 mV. The more marked reduction of the depolarising fraction of the current (rightward arrow) with respect to the hyperpolarising fraction (leftward arrow) at Vh−70 mV is emphasised by the grey areas. The currents during the largest oscillatory ramps at Vh−60 (•), −50 (▪) and −40 mV (♦) are shown at higher gain in the lower inset to emphasise the reversal of the current direction with Vh−50 mV (▪) and −40 mV (♦).
During the last depolarising ramp, the current fractions that were outward and inward (arrows) with respect to Ih were measured. With respect to the values obtained with the Vh−80 mV protocol, the outward fraction was reduced by 93.3 % at Vh−60 mV and by 108.8 % at Vh−50 mV. The inward fraction was reduced by 81.6 % at Vh−60 mV, and by 95.9 % at Vh−50 mV. These results reflect the more marked decline of the current at less negative potentials and the reversal in the direction of the current change. The oscillatory current reached its minimum at Vh−50 mV and it re-increased at −40 mV, its direction being reversed at both potentials.
With respect to the Vh−80 mV value (Table 2), the amplitude of the current during the last depolarising ramp decreased progressively more as Vh became less negative. With respect to the values with Vh−80 mV, during the last depolarising ramp the outward fraction decreased more than the inward fraction of the current. Therefore, at less negative values, the current was smaller and reversed direction.
Table 2.
INa3 as a function of the holding potential
| Vh−70 mV | Vh−60 mV | Vh−50 mV | Vh−40 mV | |
|---|---|---|---|---|
| Idepol.ramp (%Δ) | −40.8 ± 7.8%* | −75.5 ± 3.8%* | −96.5 ± 2.3%* | −112.9 ± 7.9%* |
| Outward fraction (%Δ) | – | −87.4 ± 2.6%‡ | −107.8 ± 3.7%†‡ | – |
| Inward fraction (%Δ) | – | −70.6 ± 5.5% | −90.3 ± 2.5%† | – |
n = 7. Idepol ramp, percentage change of the current during the last depolarizing ramp with respect to the value with Vh−80 mV; n = 10. Outward fraction, Inward fraction, percentage outward and inward fractions of the current during the last depolarizing ramp with respect to the value with Vh−80 mV. For Idepol ramp,
indicates a statistical difference both with t test and ANOVA. For both −60 and −50 mV protocols
indicates that the values with Vh−50 mV were significantly different from those with Vh−60 mV.
indicates that the decrease in outward fraction was significantly larger than that in inward fraction (t test).
Slope conductance changes at different potentials
During the oscillatory ramps, the asymmetry between the outward and inward fractions of the current with respect to Ih could be related to a decrease in K+ conductance and/or an increase in conductance of an inward component. Similar considerations apply also to the change in current direction. For these reasons, the slope conductance was measured by superimposing small (∼5 mV) and short (100 ms) hyperpolarising pulses on the oscillatory ramps.
In Fig. 4, the protocol is shown in top boxed inset. As Vh was decreased from −80 mV, the steady state slope conductance decreased gradually to reach a minimum at −50 mV. At −40 mV, the conductance re-increased, but the polarity of the pulse current was reversed. During the last depolarising ramp, the amplitude of the pulse currents decreased by 73.9 % with Vh−70 mV, 80.0 % with Vh−60 mV, and was very small and reversed in polarity with Vh−50 mV. The bottom boxed inset shows that with Vh−70 mV, during the last depolarising ramp (•), the current increased gradually less (grey area) and the slope conductance decreased. At Vh−40 mV, during the last depolarising ramp, the current was smaller and decreasing (grey area), and the pulse currents reversed polarity, gradually increasing in size (▪). The converse changes were present during the preceding hyperpolarising ramp. The results are consistent with a more pronounced inward rectification and the activation of an inward component on depolarisation.
Figure 4. Inward rectification and slope conductance.
The same procedure as in Fig. 3 was repeated while superimposing small hyperpolarising pulses (see top boxed inset). The traces labelled with • (Vh−70 mV) and ▪ (Vh−40 mV) are shown at higher gain in the bottom boxed inset. The top grey area emphasises the gradually smaller increase in current and the gradual decrease in pulse amplitude during the depolarising phase of the last ramp with the Vh−70 mV protocol. The bottom grey area emphasises the reversal in the direction of a smaller current and the gradual increase of the superimposed pulse currents during the depolarising phase of the last ramp with the Vh−40 mV protocol.
In n = 9, with respect to the value at Vh−80 mV, the steady state slope conductance decreased by 39.7 ± 6.4 *, 76.7 ± 5.4 *, 91.0 ± 1.8 * and 103.9 ± 1.9 %* at −70, −60, −50 and −40 mV, respectively (t test and ANOVA). During the last depolarising ramp, the amplitude of the superimposed pulse currents decreased by 61.7 ± 5.7 %* on depolarisation from −78 mV and by 74.9 ± 3.1 %* on depolarisation from −68 mV (74.9 % was statistically greater than 61.7 %). With Vh−40, the average amplitude of the reversed pulse currents increased by 420 % during the depolarising ramp from −48 mV.
Current oscillations at different voltages from a constant Vh
In Fig. 3 and Fig. 4, the same voltage-clamp protocol was applied from different Vh values and this may be relevant to the events occurring during DD from different maximum diastolic potentials. In a different approach, a similar voltage range was scanned by keeping Vh constant (−80 mV) and applying ramps of constant slope (11 mV s−1) to different potentials followed by the usual oscillatory ramps. This approach may be relevant to the events associated with a DD of constant slope, but different amplitude.
In Fig. 5, the protocol is shown at the top. The current during the initial ramp increased gradually less as the potential attained became less negative (see superimposed traces in boxed inset). The subsequent oscillatory ramp currents were much smaller in an outward than in an inward direction (see line drawn on the top current trace), and became much smaller at less negative potentials, as shown by currents during the last hyperpolarising and depolarising ramps in the boxed inset.
Figure 5. Effects of oscillatory ramps from a constant Vh to different potentials.
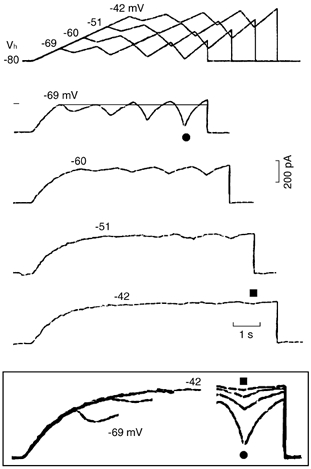
A depolarising ramp was initially applied to gradually less negative voltages (−69, −60, −51 and −42 mV) from a fixed Vh of −80 mV. Increasing oscillatory ramps were then applied at those different voltages (see protocol at the top). The number above the traces indicates the voltage attained at the end of the initial depolarising ramp. The line drawn at the −69 mV level emphasises the asymmetry between the fractions of current in outward and inward directions. The boxed inset shows superimposed initial ramp currents and the currents during the largest oscillatory ramps. The same symbol identifies the same trace within and without the boxed inset.
In n = 9, with respect to the current during the last depolarising ramp of the −69 mV protocol, the current decreased by 59.0 ± 7.0, 88.6 ± 7.4 and 99.0 ± 5.3 % (*, ANOVA) during the last ramp of the −60, −51 and −42 mV protocols, respectively. During the initial slow ramp (11 mV s−1), the negative slope was absent in five, and present in the remaining four experiments.
Effects of different ramp slopes on the currents
The slope of DD can vary and a steeper DD is more likely to initiate spontaneous discharge (as seen, for example, on exposure to low [K+]o; Vassalle, 1965; Berg & Vassalle, 2000). This elicits the question as to whether the currents during ramps with different slopes might be different, since the negative slope becomes more pronounced during faster depolarising ramps (Fig. 2).
In Fig. 6, in 4 mm Tyrode solution (left hand traces), the smallest voltage ramp protocol was the same as in Fig. 5 and the current trace shows similar changes (panel A). However, as the slope of the ramp was increased, the negative slope (INa3) appeared that was large during the ramp to −51 mV (panel C) and larger during the fastest ramp to −42 mV (panel D). INa3 began at about −65 mV (left vertical dashed line in panel D), reached its maximal value by the end of the ramp (at −42 mV, right vertical dashed line) and then it slowly decayed (grey area), turning in an outward direction during the first repolarising oscillatory ramp. During the last depolarising oscillatory ramp, the current increased during the −69 mV protocol (triangle in A) and decreased during the −60, −51 and −42 mV (diamond in D) protocols (see also the two juxtaposed traces at higher gain marked with the respective symbols).
Figure 6. Effect of ramps with a different slope and magnitude on oscillatory currents in normal and low [K+]o.
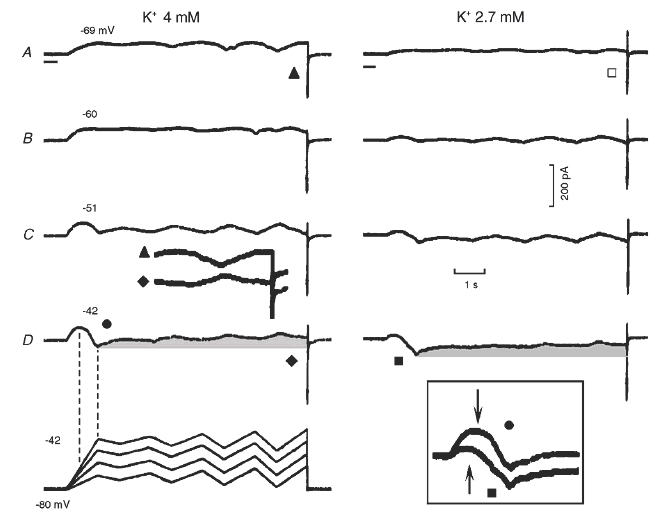
The oscillatory ramps were tested in 4 mm[K+]o (left hand traces) and in 2.7 mm[K+]o (right hand traces). Vh was kept at −80 mV and the slope and magnitude of the initial depolarising ramp were progressively increased (11, 20, 29, 38 mV s−1) and then oscillatory ramps were applied to the different potential levels (see protocol at the bottom and the numbers above the respective traces). The progressively increasing oscillatory ramps were similar to those in Fig. 3. The vertical dashed lines are drawn between the beginning and the end of the negative slope region and the corresponding voltages. Part of the traces labelled by a triangle and a diamond are juxtaposed between the C and D panels. □ marks the reversal of the current direction in the lower [K+]o. The grey areas emphasise the decay of INa3. The boxed inset shows the negative slope in 4 mm[K+]o (•) and in 2.7 mm[K+]o (▪). The arrows point to the negative shift of the onset of the negative slope in the lower [K+]o.
In n = 29 (Vh−80 mV), with the fastest and largest ramp, INa3 began at −57.7 ± 0.9 mV and peaked by the end of the ramp to −42 mV in 24 experiments and before the end of the ramp in the remaining experiments. The amplitude of INa3 was 64.1 ± 10.7 pA. In n = 13, INa3 began at −57.8 ± 1.1 mV during the fastest ramp. In these same 13 experiments, during a faster and larger ramp (136 mV s−1 to +1 mV), INa3 began at −60.0 ± 0.8 mV (n.s. with respect to −57.8 mV) and peaked at −34.7 ± 3.0 mV. The time-dependent decay of INa3 (measured at the same potential of −42 mV as the difference between the value at the end of the initial ramp and that during the last depolarising ramp, some 6 s later) was 37.9 ± 3.8 pA * (−59.1 % with respect to INa3) (n = 29). Therefore, if the rate of depolarisation is fast enough, INa3 begins at ∼−60 mV and slowly decays as a function of time after the end of the initial ramp. With larger ramps, INa3 peaks at ∼−35 mV even if the depolarising ramp continues to less negative voltages.
Changes induced by low [K+]o on ramp currents
Since lowering [K+]o to 3 mm causes increasing ThVos that initiate spontaneous discharge (Vassalle, 1965; Spiegler & Vassalle, 1995; Berg & Vassalle, 2000), the same protocols were carried out also in lower [K+]o to determine how low [K+]o changes the currents related to spontaneous discharge.
In Fig. 6, in 2.7 mm[K+]o (right hand traces), during the initial ramp the current was smaller, and the boxed inset shows that INa3 initiated at a more negative voltage (−70 mV during the fastest ramp, arrows) and was more inward than in 4 mm[K+]o. During the fastest ramp to −42 mV, the current amplitude between the holding value at Vh−80 mV and that at the beginning of INa3 was reduced by 78.6 % whereas INa3 increased by 5.5 %. After the end of the initial ramp, the decay of INa3 (grey area) was similar to that in 4 mm[K+]o. In low [K+]o, the current during the oscillatory ramps was smaller and the inverted polarity patterns were already evident at more negative potentials, indicating a negative shift of INa3 range (Fig. 6A, cf. triangle and open square).
As shown in Table 3, decreasing [K+]o from 4 mm to 2.7 mm (−42 mV protocol) decreased the current between Ih and the beginning of INa3 by 53.6 %, shifted the threshold for INa3 by 7 mV in a negative direction, increased INa3 amplitude by 12.0 %, had little effect on its decay, and decreased the steady state slope conductance by 64 % at−80 mV. These findings are consistent with and provide an insight into the negative shift of the oscillatory zone and the increase in ThVos amplitude induced by low [K+]o (Berg & Vassalle 2000).
Table 3.
Effects of low and high [K+]o on inward rectification and INa3
| [K+]o 4 mm | [K+]o 2.7 mm | |
|---|---|---|
| Oscillatory ramps (n = 7) | ||
| IVh-INa3(pA) | 313.1 ± 56.1 | 145.0 ± 36.0* |
| INa3 Th, (mV) | −55.1 ± 2.2 | −62.1 ± 2.2* |
| INa3 (pA) | 77.1 ± 24.5 | 86.4 ± 25.1* |
| INa3 decay (pA) | 45.7 ± 15.5 | 44.2 ± 12.7 (n.s.) |
| Steady g (%Δ) | – | −64% (n = 2) |
| Slow ramps (6 mV s−1) (n = 4) | [K+] 4 mM | [K+]o 9.5 ± 0.5 mM |
| Idepol ramp (pA) | 208.7 ± 49.0 | 968.3 ± 57.7* |
| INa3 (pA) | 43.3 ± 13.3 | 0 |
| Ih (%Δ) | – | 635.4 ± 280.0 % |
| Steady g, Vh−50 (%Δ) (n = 5) | −87.6 ± 6.4% | −51.2 ± 8.4%* |
Ivh-INa3, amplitude of the current between the Vh value and beginning of INa3; INa3 Th, threshold potential of INa3; INa3, amplitude of INa3: INa3 decay, amplitude of the decaying INa3: steady g, percentage change in the steady conductance at Vh−80 mV. Idempol ramp, amplitude of the current between the holding value and the value at the beginning of INa3 during the initial ramp; INa3, amplitude of INa3; Ih, percentage change in the holding current; steady g, Vh−50, percentage change in slope conductance when Vh was decreased from −70 mV to −50 mV.
Effects of high [K+]o on the I-V relation
In 5.4 mm[K+]o, spontaneous discharge ceases (Vassalle, 1965) and in 10.8 mm[K+]o, DD (Vassalle, 1970) and underlying pacemaker current IKdd (Vassalle et al. 1995) are abolished.
In Fig. 7A, slow ramps were applied in Tyrode solution and in the presence of 10 mm[K+]o. In high [K+]o, Ih was much greater (less negative EK and increased conductance of the IK1 channel; see Hall et al. 1963; Vassalle, 1965, 1966) and during the first part of the depolarising ramp the current was markedly larger. On further depolarisation, inward rectification occurred also in high [K+]o, but it began at a less negative voltage compared to lower [K+]o, as emphasised by the vertical line. The difference current shows that in high [K+]o the current during the initial phase of the depolarising ramp and during the late phase of the repolarising ramp was larger, but it was much less affected during the central part of the ramp protocol (inward rectification of the IK1 channel).
For comparison, the same test was also carried in 2.7 mm[K+]o and the changes were in the opposite direction with respect to those in high [K+]o. Thus, the current was much smaller at the beginning and the end of the ramps (but not during the central part of the ramp protocol, see the difference current).
In the experiment illustrated in Fig. 7B, small voltage pulses were superimposed on the parent ramp. In high [K+]o, the steady state slope conductance was larger and during depolarisation from −80 to −50 mV decreased less (80.4 %) than in control (103.1 %) (onset of inward rectification at less negative values). In high [K+]o both the reversed pulse currents and the subsequent inward transients (arrows) were much reduced (boxed inset). These effects are consistent with the fact that an increase in [K+]o decreases the upward swing of DD that leads to the upstroke until the threshold is missed and a ThVos is unmasked (Berg & Vassalle, 2000). When this happens the maximum diastolic potential and the initial DD may still be little affected (see Fig. 7 in Vassalle, 1977).
As shown in Table 3, with slow ramps, high [K+]o increased Ih by 635.4 % (P = 0.0534), increased the initial current amplitude (see vertical line in Fig. 7) by 363.8 % and abolished INa3. The percentage decrease in steady state conductance when Vh was decreased from −70 to −50 mV was much less in high [K+]o.
Voltage oscillations and current clamp
The above voltage-clamp results suggest that, in the current-clamp mode, oscillatory currents of the same magnitude should induce larger voltage displacements when applied at less negative voltages, so that the attainment of the threshold for the upstroke would be facilitated.
In Fig. 8A, the current-clamp protocol (left side) consisted of ramps that increased by an additional 20 pA with each swing above and below the holding current value. The corresponding voltage records are shown on the right hand side. In panel A, at a resting potential of −70 mV, the second depolarising current ramp caused a small sub-threshold depolarisation (arrow) and the following ramps initiated action potentials through a gradual transition into the upstroke, a transition emphasised in the last action potential by the grey area and shown at high gain in the top boxed inset. Such a transition would be expected from the activation of INa3. The depolarisation allowed the attainment of the threshold for INa (fast and large upstroke). This interpretation is confirmed by the events occurring at a resting potential of −66 mV. The first oscillatory current caused a much larger depolarisation (•) than at −70 mV (▪) (see middle boxed inset); and the threshold for the upstroke was already attained by the second ramp.
Figure 8. Effects of oscillatory current ramps on membrane voltage.
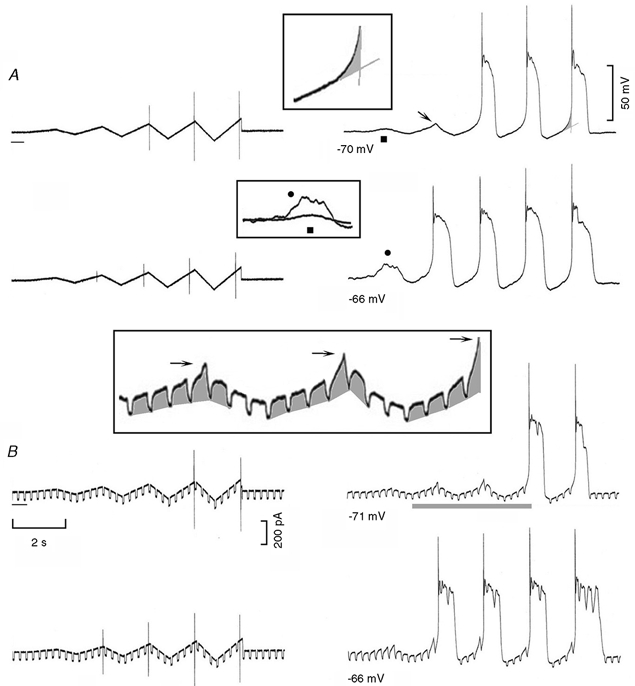
A, the current protocol is shown in the left hand traces, the oscillatory currents increasing by an additional 20 pA at each step. The voltage changes induced by the oscillatory current ramps are shown in the right hand traces. The transition between diastolic depolarisation and the upstroke is emphasised by the grey area, which is shown at higher gain in the top boxed inset. The enhancement of the sub-threshold depolarisation with Vh−66 mV (•) compared to that with Vh−70 mV (▪) is shown in the middle inset. B, the same procedure was repeated while passing superimposed small step currents. The portion of the trace marked by a grey line is shown at higher gain in the bottom boxed inset. The grey areas emphasise the changes in the amplitude of the voltage displacements. The arrows point to the increasing amplitude of the events preceding the attainment of the threshold for the upstroke.
In Fig. 8B, the procedures were repeated while small pulse currents were superimposed on the parent current protocol. At a resting potential of −71 mV, the amplitude of the voltage displacements increased during the depolarising ramp, indicating a decrease in slope conductance (bottom boxed inset, which corresponds to the trace marked by the grey strip). In addition, at the peak of the depolarising ramps, the end of the hyperpolarising pulse was followed by a gradually larger depolarisation (horizontal arrows), the last of which attained the threshold for the upstroke. The findings suggest that the underlying net inward current increased during the larger depolarisations, as expected from the activation of INa3. In the bottom trace of Fig. 8B, the resting potential was less negative (−66 mV) and the slope conductance was smaller (−34 %) than at −71 mV. Also, the very first current ramp caused a sub-threshold activation of the depolarising event and the second depolarising ramp already initiated an action potential.
These results suggest a link between findings in the voltage-clamp mode (inward rectification and INa3) and those in current-clamp mode (decrease in slope conductance as the diastolic voltage decreases and enhanced depolarisation near the threshold).
In n = 25, the current-clamp protocol yielded results similar to those shown in Fig. 8A, in that depolarisation during diastole became steeper at less negative potentials, and there was a gradual transition into the AP upstroke. With respect to the value at Vh−80 mV, the voltage displacement elicited by the same hyperpolarising pulse current increased by 60.2 ± 18.9 %* at Vh−75 (n = 4), 73.1 ± 26.9 %* at Vh−70 (n = 4), 156.0 ± 90.3 % at Vh−65 (n = 3) and 258.3 ± 208.3 % at Vh−60 mV (n = 2).
In n = 6, in order to provide an approximate measure of the increased rate of depolarisation prior to the upstroke, the voltage displacement induced by the largest depolarising ramp from a resting potential of −70 mV was measured during two identical time intervals, namely, during the initial voltage displacement and during the upward curvature preceding the AP upstroke. The latter voltage displacement was larger (+145.0 ± 47.7 %*) than the former. In n = 5, in another approach, the voltage displacement during the largest depolarising ramp was fitted with a two-term exponential function (eqn (1)) and the value of τ1 was 562.0 ± 134.9 ms whereas that of τ2 was 43.7 ± 11.2 ms * (−92.2 %).
INa3 and block of Na+ channels by tetrodotoxin
The presence of a negative slope range with an increasing slope conductance suggests that INa3 is due to the activation of an inward current. If INa3 is caused by current flow through Na+ channels, it might be blocked by tetrodotoxin (TTX), a specific blocker of Na+ channels (Naharashi, 1974). This TTX sensitivity would be expected if INa3 is responsible for the upward swing of the last part of DD (Vassalle & Scidá, 1979; Vassalle, 1983) as well as for the depolarising phase of ThVos (Spiegler & Vassalle, 1995), since TTX stops Purkinje fibre discharge by abolishing these electrophysiological events.
In Fig. 9, the protocol applied is shown panel C. In Fig. 9A, the current traces were recorded in control (same traces as in Fig. 6), in the presence of TTX and during recovery in Tyrode solution. TTX increased the current in an outward direction, markedly reduced (−75 %) the amplitude of INa3 during the initial ramp (see traces at higher gain in the top boxed inset, K+ 4 mm, vertical arrows) as well as its subsequent slow decay (grey areas in Fig. 9A), and abolished the reversal of current direction during the oscillatory ramps (see bottom boxed inset). During the recovery from TTX, the changes subsided. In Fig. 9B, [K+]o had been reduced to 2.7 mm and TTX induced changes similar to those in 4 mm[K+]o. In particular, TTX markedly decreased INa3 (see top boxed inset, K+ 2.7 mm, oblique arrows) and its subsequent decay (Fig. 9B).
Figure 9. Effects of TTX on INa3.
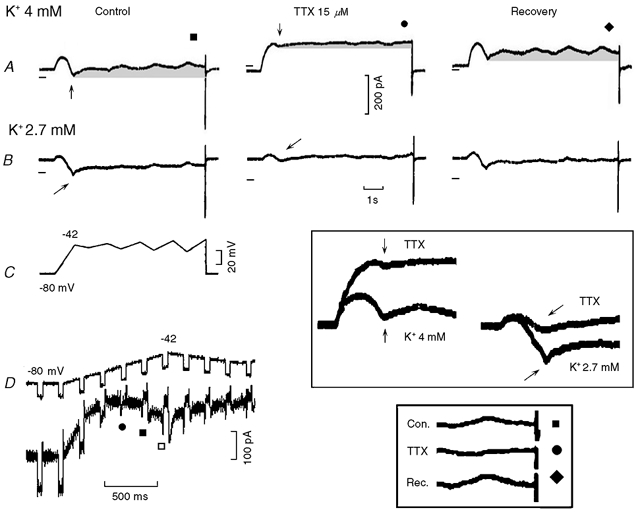
The voltage protocol is shown in the first panel of C. The traces recorded in 4 mm[K+]o, in the presence of TTX (15 μm) and during recovery are shown in A. The corresponding traces in 2.7 mm[K+]o are shown in B. The effects of TTX on the negative slope are shown at higher gain in the boxed inset in C, the same arrows identifying the same traces within and without the inset. In A, the grey areas emphasise the slow decay of INa3 and the reduction of its amplitude by TTX. The boxed inset in D shows at higher gain the abolition by TTX of the reversal of the current direction during the last oscillatory ramps. The first panel of D was recorded from another cell in Tyrode solution: the top trace shows the voltage protocol and the bottom trace the current. •, ▪ and □ identify step currents with different characteristics.
In n = 6, 15 μm TTX reduced the amplitude of INa3 (measured from the beginning of the negative slope region to the value at −42 mV) by 88.3 ± 5.6 %* and that of its time-dependent decay by 58.8 % (from control 42.5 ± 8.6 pA to 17.5 ± 2.5 pA *). TTX abolished the reversal of INa3 during the last depolarising ramp (from control −30.0 ± 8.1 pA to +13.3 ± 6.8 pA *).
The same protocol as in Fig. 9C was carried out with superimposed small hyperpolarising pulses (5 mV, 50 ms) under control conditions (Fig. 9D) with the following results: (1) a decrease in the amplitude of the pulse currents due to inward rectification (•); (2) the reversal of the superimposed pulse currents in the negative slope range (▪ and □); (3) increasing amplitude of the reversed pulse currents during the negative slope, indicating an increase in conductance; (4) the appearance of a slowly decaying inward transient after the hyperpolarising pulses (▪ and □); and (5) a subsequent gradual decrease of the amplitude of the reversed pulses.
The appearance of the slowly decaying inward transient after the hyperpolarising pulses suggests that during the hyperpolarising pulse an increase in the availability of a Na+ channel allowed a larger subsequent activation of that channel after the pulse. This slowly decaying inward transient after an hyperpolarising pulse may contribute to the larger depolarisation that follows the hyperpolarising pulses at less negative potentials in Fig. 8B, boxed inset. In turn, these findings would explain why gradually larger hyperpolarising pulses applied during diastole in Purkinje fibres are followed by faster and larger depolarisations that attain the threshold sooner (see Fig. 3 in Weidmann, 1951).
The increase in the reversed pulse current in the negative slope range, as well as the inward transient after the pulses, suggest that an increasing INa3 underlies the negative slope. A similar behaviour (reversal of the pulse current in the negative slope range) was found in seven experiments.
INa3 and lidocaine
Results similar to those with TTX were obtained with lidocaine (lignocaine), which also blocks Na+ channels (Carmeliet & Saikawa, 1982). In Fig. 10A, in the control, during the initial ramp INa3 began at −59 mV (left vertical line), attained its maximal value by the end of the ramp (−42 mV, right vertical line, oblique arrow) and slowly decayed thereafter (grey area). Lidocaine reduced INa3 amplitude by 63.3 % (vertical arrow, see superimposed left traces in the boxed inset) and markedly reduced its subsequent decay. Lidocaine prevented the reversal of the current direction during the last depolarising ramp to −34 mV: the current changed from decreasing (−30 pA, ▪) in the absence to increasing (+20 pA,  ) in the presence of lidocaine. The lidocaine-induced changes were reversible (recovery, ♦).
Figure 10. Effect of lidocaine on INa3.
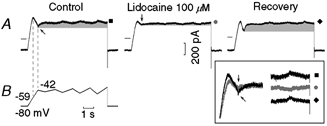
The protocol is shown in the first panel of B. The current traces were recorded in control, in the presence of lidocaine hydrochloride (100 μm) and during recovery (A). The leftward arrow points to the negative slope and the downward arrow to its reduction by lidocaine. ▪, and ♦ label the reversal of the current direction and its abolition by lidocaine (see also the boxed inset where the traces are shown at higher gain). The grey areas emphasise the decay of INa3 and the reduction of its amplitude by lidocaine. In the boxed inset, the grey traces are those recorded in the presence of lidocaine.
In n = 6, lidocaine (100 μm) reduced the amplitude of INa3 by 78.1 ± 9.1 %* and that of its time-dependent decay by 52.5 % (from control 31.6 ± 6.9 pA to 15.0 ± 3.6 pA *). During the largest depolarising oscillatory ramp, lidocaine abolished the reversal of the current direction (from control −9.1 ± 9.6 pA to +13.3 ± 4.7 pA *).
Effects of caesium and barium on I-V relation
Since an enhanced block of a K+ channel as a function of voltage could contribute to the negative slope region, ramps were applied in the absence and presence of Cs+ or of Ba2+, which block K+ channels (Isenberg, 1976; Cohen et al. 1983).
In Fig. 11A, in control, during slow ramps the I-V relation exhibited the usual patterns. Cs+ markedly reduced the current at the beginning of the depolarising ramp, but had little effect on INa3, as also shown by the difference current. The effects of Cs+ were reversible (recovery).
Figure 11. Effects of caesium and barium on inward rectification.
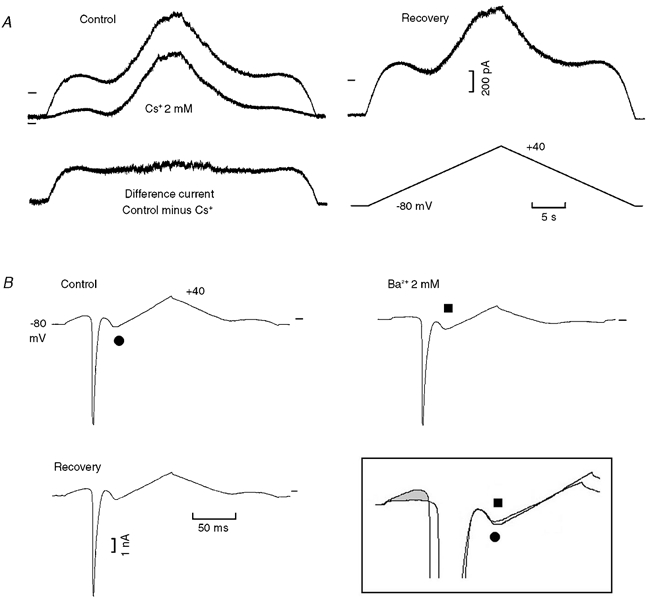
A, depolarising and repolarising ramps (6 mV s−1) between −80 and +40 mV were applied (protocol trace shown below the recovery trace). The current records in control, in the presence of Cs+ (2 mm) and during recovery are so labelled. The difference current was obtained by subtracting the Cs+ trace from the control trace. B, (different cell) faster ramps (960 mV s−1) were applied in the control, in the presence of Ba2+ (2 mm) and during recovery. In the boxed inset, the grey area emphasises the decrease in the initial current in the presence of Ba2+. The negative slope current traces were superimposed by aligning them by the end of INa inactivation. The same symbols identify the same traces within and without the boxed inset.
The block of K+ channels by Ba2+ was tested with fast ramps so that both INa and INa3 would be present. In Fig. 11B, in control, INa was superimposed on the negative slope of the I-V relation. Ba2+ markedly reduced the current at the beginning of the depolarising ramp and shifted INa peak from −49.1 to −44.5 mV; this shift was reversible (recovery −49.1 mV). Ba2+ had little effect on the amplitude of INa3, but shifted it in an inward direction, presumably due to the reduction of the outward K+ current. In the boxed inset, Ba2+ markedly reduced the initial current (grey area, traces superimposed by Ih) but had little effect on the amplitude of INa3 (▪, traces superimposed by the end of INa inactivation).
Thus, the results show that the block of K+ channels by Ba2+ markedly reduces the current at negative values, but has little effect on either INa3 or INa. These findings suggest that the negative slope is mainly due to the activation of INa3, consistent with the increase in slope conductance (Fig. 4 and Fig. 9).
In Table 4 it can be seen that Cs+ during the slower ramp decreased the initial current by 56.0 % but, it had little effect on INa3 (−15.2 %, n.s.). During the faster ramp, Cs+ decreased the initial current by 62.2 % (P = 0.056), but again it had little effect on INa3 (−3.5 %, n.s.). Also, in Tyrode solution the faster ramps had little effect on the initial current (371.0 pA with the slower ramp and 393.7 pA with the faster ramp), but increased INa3 by one order of magnitude (from 25.0 pA to 212.5 pA).
Table 4.
Effects of Cs+ and Ba2+ on inward rectification and INa3
| Ramp slope | Ivh−INa3 (pA) | +Cs+ 2 mM | INa3 (pA) | +Cs+ |
|---|---|---|---|---|
| 6 mV s−1 | 271.0 ± 79.0 | 163.0 ± 32.3* | 25.0 ± 13.0 | 21.2 ± 5.5 (n.s.) |
| 240 mV s−1 | 393.7 ± 128.0 | 148.7 ± 23.8 | 212.5 ± 51.2 | 205.0 ± 128.1 (n.s.) |
| Ivh−INa3, control | +Ba2+ 2 mM | INa3, control | +Ba2+ | |
| 240 mV s−1 | 420.8 ± 73.4 | 94.1 ± 20.8* | 316.6 ± 48.8 | 615.0 ± 159.5 (n.s.) |
| 960 mV s−1 | 550.8 ± 100.1 | 205.0 ± 58.4* | 628.4 ± 116.4 | 718.3 ± 173.7 (n.s.) |
Ivh−INa3, current between Vh value and beginning of INa3 in the absence and in the presence of Cs+ (n = 5) or Ba2+ (n = 6). INa3, amplitude of INa3 in the absence and presence of Cs+ (n = 4) and of Ba2+ (n = 6).
During the 240 mV s−1 ramp, Ba2+ decreased the initial current by 77.6 %, but not INa3 (+94.2 %, n.s.). During the 960 mV s−1 ramp, Ba2+ decreased the initial current by 62.7 %, not INa3 (+14.3 %, n.s.). In Tyrode solution, with respect to the slower ramps, the 960 mV s−1 ramps increased the initial current by 30.8 %* and doubled INa3 (+98.4 %*). Ba2+ shifted the voltage of the INa peak by −3.23 ± 0.90 mV * (in agreement with Hanck & Sheets (1992) in single Purkinje cells) and that of INa3 by −3.76 ± 1.31 mV *.
Discussion
We conclude from our results that in Purkinje cells: (1) on depolarisation, there is a marked inward rectification which begins at the resting potential; (2) the slope conductance decreases on depolarisation and reaches a minimum at about −60 mV; (3) at that potential, the negative slope range of the I-V relation begins; and (4) the negative slope appears to be mainly caused by a slowly inactivating sodium current (INa3) which has the following characteristics.
(1) It appears as a slowly inactivating inward current during steps negative to the threshold for INa. (2) It increases during depolarising ramps past ∼−60 mV due to its voltage-dependent activation (and slow inactivation). (3) It decreases as a function of time when the initial depolarising ramp is over, as the channel slowly inactivates. (4) It decreases during depolarising ramps beyond about −35 mV. (5) It increases in amplitude during faster depolarising ramps (greater channel availability). (6) It is much smaller or absent during repolarising ramps. (7) It is associated with a reversal of the superimposed pulse currents and with a progressive increase in slope conductance. (8) It appears responsible for the change in direction of the current during oscillatory ramps at less negative potentials. (9) It is markedly reduced by tetrodotoxin and lidocaine. (10) It is little affected by Cs+ and Ba2+, which, instead, markedly reduce the initial current during the ramp depolarisation. (11) It increases in amplitude and its activation potential shifts to more negative values in low [K+]o. (12) It decreases in high [K+]o. (13) It is consistent with the gradual transition between diastolic depolarisation and the upstroke in the current-clamp mode.
Therefore, within the pacemaker range a voltage- and K+-dependent decrease in K+ conductance and (beginning at −60 mV) the activation of a voltage- and time-dependent inward Na+ component with slow inactivation kinetics are present, which would enhance diastolic depolarisation in spontaneously discharging fibres, thereby permitting the attainment of the threshold. The mechanisms by which low [K+]o initiates spontaneous discharge in Purkinje fibres include a fall of the slope conductance in a critical range and a negative shift in the activation potential of a larger INa3.
Role of inward rectification in spontaneous discharge
Per se, inward rectification cannot induce DD, because the inward rectifier IK1 is only voltage-dependent in the DD range. Nevertheless, inward rectification plays a major conditioning role in the pacemaking process in that it increases the slope and magnitude of depolarisation caused by the pacemaker current IKdd (Vassalle, 1966; Vassalle et al. 1995, 1999), since gK1 decreases as a function of depolarisation. By steepening the DD slope, it may indirectly increase the amplitude of INa3 (smaller inactivation of the INa3 channels during early DD).
That Purkinje fibres undergo inward rectification (Hall et al. 1963) is generally accepted. However, in Purkinje strands K+ accumulation in narrow extracellular spaces (Baumgarten & Isenberg, 1977; Cohen & Kline, 1982; Kline & Cohen, 1984) may complicate the results (Shah et al. 1987). As shown by our results (Fig. 7), high [K+]o decreases the negative slope and therefore an increase in [K+]o in narrow spaces outside the cell membrane in Purkinje strands may modify the I-V relation to an unknown extent. Furthermore, our results in single Purkinje cells in the absence of accumulation phenomena show that inward rectification and negative slope occur in a voltage range that would affect diastolic depolarisation in a spontaneous fibre.
Spontaneous discharge and negative slope
The abolition of spontaneous discharge of Purkinje fibres by TTX (and high [K+]o) through the suppression of the upswing of the late DD (Vassalle & Scidá, 1979; Vassalle, 1983) and of ThVos (Spiegler & Vassalle, 1995) is consistent with the notion that DD eventually enters an oscillatory zone where a TTX-sensitive inward current is activated. Our results provide evidence indicating this inward component is the slowly inactivating INa3 that underlies the negative slope of the I-V relation. Therefore, at potentials positive to −60 mV, the activation of INa3 would bring about a greater and faster depolarisation. This is supported by the current-clamp experiments where the AP upstroke is attained through an enhancement of late depolarisation.
Voltage and time dependence of INa3
When depolarisation attains ∼−60 mV, INa3 appears, increases with further depolarisation, but then decreases when the ramp voltage decreases beyond ∼−35 mV. Therefore, there seems to be a voltage range within which these Na+ channels open, with INa3 reaching its peak at potentials that are positive to the threshold for INa, either in the absence of INa or after its inactivation during depolarising ramps.
The time dependence of INa3 is suggested by the following findings: (1) INa3 decreases relatively slowly during depolarising steps negative to the threshold for INa; (2) its amplitude increases during steeper ramps; (3) INa3 may be absent during the slowest depolarising ramps; (4) INa3 is much smaller or absent during repolarising ramps; (5) after a small hyperpolarising pulse in the negative slope range, INa3 appears and then decays relatively slowly (Fig. 7 and Fig. 9); and (6) during the oscillatory ramps that follow the initial ramp, INa3 decays over a period of seconds.
INa3 and slowly inactivating Na+ currents in cardiac tissues
Slowly inactivating Na+ currents have been reported in cardiac tissues and therefore the question arises whether the currents already described are identical with INa3 or with INa2, since both currents inactivate slowly. In connection with this, there is a need to distinguish between findings in Purkinje fibres and myocardial fibres with regard to both INa3 and INa2. Thus, only Purkinje fibres have oscillatory pre-potentials (ThVos) which appear when DD enters the oscillatory zone. In addition, Purkinje cells have an action potential which is much longer than that in myocardial fibres.
These differences seem to be mainly related to INa3 (ThVos) and INa2 (duration of the plateau) for the following reasons: (1) in Purkinje fibres, TTX suppresses only the last third of diastolic depolarisation (Vassalle & Scidà, 1979; see Vassalle, 1983), in a voltage range where the TTX-sensitive INa3 is activated (present results); (2) TTX does not modify the diastolic potential in myocardial fibres (Bhattacharyya & Vassalle, 1982; Iacono & Vassalle, 1990). (3) TTX shortens (and high [Na+]o and veratridine lengthen) the action potential of Purkinje fibres, but they have little effect in myocardial fibres (Iacono & Vassalle, 1990); (4) TTX-sensitive INa2 is prominent in canine single Purkinje cells (Vassalle & Du, 2000; Bocchi & Vassalle, 2000) but it is absent in ventricular muscle fibres (Bocchi & Vassalle, 2000); and (5) TTX decreases intracellular Na+ activity much more in Purknje fibres than in myocardial fibres (Iacono & Vassalle, 1990).
These findings imply that results obtained in myocardial cells cannot be extrapolated ipso facto to Purkinje fibres (and vice versa). Furthermore, the studies of slowly inactivating Na+ currents in myocardial cells pursued different questions and none of the approaches reported in the literature were directed at analysing the events underlying ThVos.
In rat ventricular myocardium (no spontaneous activity), the persistent Na+ current showed voltage- and time-dependent characteristics (Saint et al. 1992) which are rather different from those of INa3. Similarly, there are conspicuous differences in the slowly inactivating current of Na+ channels from normal and mutant human cardiac myocardium expressed in oocytes (Richmond et al. 1998). For example, in order to obtain slow inactivation, depolarisation to 0 mV had to be applied for 60 000 ms. In any case, it was concluded that cardiac Na+ channel slow inactivation is adapted for the plateau of myocardial tissues. From these data in myocardial tissue, it is apparent that we are not dealing with the current in the oscillatory zone that is involved in spontaneous discharge of Purkinje fibres.
Zilberter et al. (1994) pursued the question as to whether the late (burst) Na+ channel contributes to the background Na+ conductance in rabbit Purkinje and ventricular myocardium (single channel recording). On depolarisation from −120 mV to −40 mV, the late Na+ channels behaved qualitatively in a similar way in Purkinje and myocardial tissues and deactivated quickly on repolarisation. Their major conclusion in this regard was that the burst Na+ channels do not contribute significantly to the background Na+ conductance.
Studies conducted in Purkinje fibre strands (canine, Gintant et al. 1984; rabbit, Carmeliet, 1987) are much more pertinent to the present report. The I-V relation showed a TTX-sensitive current beginning at negative voltages (∼−80 mV Gintant et al. 1984; and even −90 mV, Carmeliet, 1987) and peaking at about −20 mV. Gintant et al. (1984) found that the TTX-sensitive current is greater with more rapid ramps at potentials where the ‘window’ current is expected to be open. It was concluded that the time-dependent difference current is a dynamic component of the TTX-sensitive window current and that this current would be important for the duration of the plateau.
The range of activation of the slowly inactivating current was found to extend from −90 mV to positive values and therefore it would be important for both diastolic depolarisation and plateau duration (Carmeliet, 1987) However, Carmeliet (1987) points out that the decline of this TTX-sensitive current during depolarising steps is negligible at −70 mV and more negative potentials, and that (with a different protocol) the amplitude of the time-dependent current at potentials negative to −50 mV was so small that estimation of its time course was impossible.
One possible interpretation is that at more negative potentials the current blocked by TTX was the background (time-independent) Na+ current. However, the background current would not cause the oscillatory potentials, since the background current would actually decrease as a function of depolarisation (decreasing driving force). As for the less negative potentials, the separation of INa2 from INa3 would be difficult since both currents are sensitive to TTX (Vassalle & Du, 2000; present results). In our experiments in single Purkinje cells, INa3 occurred also in the absence of INa, as it did in canine Purkinje strands (Gintant et al. 1984) and of INa2 which begins at ∼−40 mV and peaks at −20 mV (Bocchi & Vassalle, 2000). The presence of two different Na+ currents within two different potential ranges would permit the independent regulation of diastolic depolarisation and of the plateau.
The explanation of the fact that, during depolarising steps to the threshold potential for INa (∼−50 mV), INa inactivation is not followed by an INa3 tail is not obvious: one intriguing possibility is that ‘fast inactivation might limit the extent of slow inactivation via charge immobilisation’ (Richmond et al. 1998). It is true that INa3 follows INa inactivation during a ramp, but then INa3 would be activated by the continuing depolarisation (in contrast to the unvarying potential during the square step that elicits INa).
Many of the characteristics of INa3 still need to be defined and this will require further experimentation. In connection with this, one possibility that needs to be considered is that INa3 might be a sub-threshold component of INa. However, INa3 begins some 10 mV negative to the threshold of INa and decays more slowly than INa. Indeed, a truly sub-threshold component of INa may occasionally be superimposed on INa3 (Fig. 2, top boxed inset), but the former activates and inactivates more rapidly than INa3. Furthermore, during a ramp, after the quick inactivation of INa, INa3 seems to be related to the voltage in the same way as when INa is not present. Namely, after the inactivation of INa, INa3 continues to increase, reaches a peak and than decreases as the depolarising ramp continues, as it does when there is no superimposed INa. It is not obvious why INa3 should resume its growth after the fast inactivation of INa if it were a sub-threshold component of INa. INa3 is present with ramps that are too slow for the initiation of INa, presumably because the INa3 channels inactivate slowly and therefore also in this regard are different from INa channels.
The mechanism underlying the slow inactivation of INa3 needs to be determined and could be related to the different behaviour (two inactivated states) of Na+ channels (e.g. see the results in ventricular myocytes: Brown et al. 1981; Kunze et al. 1985; Böhle et al. 1998) or to two different populations of Na+ channels with different inactivation kinetics (as considered by Gintant et al. 1984 in Purkinje fibres). INa3 appears to be different from the steady state Na+ window current (Attwell et al. 1979), since it is time-dependent, and, when the ramp is sufficiently slow, there might be no negative slope (see Fig. 5). In addition, the negative slope during depolarising ramps is much larger than the positive slope during repolarising ramps, and (in confirmation of Gintant et al. 1984) it is larger with faster ramps.
It is of interest that a TTX-sensitive component similar to INa3 has been reported in the SA node of newborn rabbit, which gradually disappears in about 40 days from birth (Baruscotti et al. 2000). In the rabbit SA node preparation, the slow component is also due to a slowly inactivating Na+ current that contributes to the automatic discharge of that structure. Our results suggest that (in contrast to the rabbit SA node) in Purkinje cells the TTX-sensitive component is present in the adult tissue, where it plays a role in pacemaker discharge. The type of Na+ channel involved seems also to be different in the two tissues. In the rabbit SA node, the Na+ channel isoforms for both INa (Baruscotti et al. 1997) and slowly inactivating inward component (Baruscotti et al. 2000) are of the neuronal type I, which is more sensitive to TTX (nearly complete block by 3 μm TTX, Baruscotti et al. 1996, 2000). In the dog (present results), the slow component is relatively resistant to TTX (88 % block by 15 μm TTX), as usually found in cardiac cells (Muramatsu et al. 1996) for the cardiac isoform of the Na+ channel (Brown et al. 1981). Furthermore, the slow inactivating component disappears with age in the rabbit SA node whereas INa3 is present in adult Purkinje cells.
The current of neuronal Na+ channel isoforms (brain α subunit isoforms Nav 1.1, Nav 1.3 and Nav 1.6) has been found in the presence of β scorpion toxin in the transverse tubules in mouse ventricular cells and it would play a role in electromechanical coupling (Maier et al. 2002). These isoforms are unlikely to be present in the same location in Purkinje cells because this tissue has no transverse tubules (see Cordeiro et al. 2001). In addition, neuronal isoforms are sensitive to nanomolar concentrations of TTX (200 nm TTX is expected to block 91 % of neuronal Na+ channels and 3 % of cardiac Nav1.5 isoform, Satin et al. 1992) and yet a much larger TTX concentration (15 μm) reduced (−88 %) but did not abolish INa3. Thus, it would appear that the INa3 channels may belong to the cardiac type (pore-forming α subunit isoform Nav1.5, see Maier et al. 2002).
It is of interest that a small but distinct population of slowly inactivating Na+ channels has been demonstrated in squid giant axon (Gilly & Amstrong, 1984). These threshold Na+ channels are much fewer than the normal Na+ channels, selectively activate on depolarisation to ∼−65 mV (the threshold for INa being −50 mV), activate maximally at −40 mV, have very slow closing kinetics but inactivate more rapidly at more positive potentials, and may play a role in triggering the action potential, in repetitive firing, and (in autorhythmic cells) in pacemaking and bursting behaviour (Gilly & Amstrong, 1984). Thus, there are several analogies with INa3, but there are differences as well.
While INa3 appears to be important for ThVos and spontaneous discharge, in Purkinje cells the slowly inactivating INa2 still activates at less negative potentials, and, in agreement with previous findings (Brown et al. 1981; Gintant et al. 1984; Kunze et al. 1985; Carmeliet, 1987), it appears to be important for the duration of the plateau in cardiac cells. However, here too it should be emphasised that action potential duration, plateau, force of contraction and intracellular Na+ activity are affected differently by different interventions in Purkinje and myocardial tissues, as mentioned above.
A negative slope in the steady state I-V relation is present also in sheep Purkinje strands: the underlying Na+ current is blocked by TTX and lidocaine and has been identified as a slow inactivating phase of INa. The shortening of the plateau by lidocaine was accounted for by the block of this slowly inactivating component (Carmeliet & Saikawa, 1982). INa2 also is blocked by lidocaine (Vassalle & Du, 2000), but it can be activated independently of INa (Bocchi & Vassalle, 2000).
Conclusions
ThVos are an obligatory link between DD and the threshold, and appear to be essential both for the initiation and maintenance of Purkinje fibre discharge (Vassalle, 1965; Spiegler & Vassalle, 1995; Berg & Vassalle, 2000). The present findings document the contribution to pacemaking of inward rectification in the diastolic range and of INa3 in causing the depolarising phase of ThVos. These findings raise the possibility that the ‘oscillatory zone’ is the voltage range where both inward rectification and INa3 contribute to the attainment of the threshold for the upstroke. Quiescence may ensue if diastolic depolarisation fails to activate INa3, either because DD is too small or too slow, or because TTX, lidocaine or high [K+]o block the late DD (Vassalle & Scidá, 1979; Abete et al. 1991; Spiegler & Vassalle, 1995; Vassalle, 1977) and INa3 (present results).
Acknowledgments
This work was supported by a grant from the National Institutes of Health (HL56092).
REFERENCES
- Abete P, Ferrara N, Rengo F, Vassalle M. Mechanisms of lidocaine actions on normal and abnormal rhythms in canine cardiac tissues in vivo and in vitro. Clin Exper Pharmacol Physiol. 1991;18:179–191. doi: 10.1111/j.1440-1681.1991.tb01429.x. [DOI] [PubMed] [Google Scholar]
- Attwell D, Cohen I, Eisner D, Ohba M, Ojeda C. The steady state TTX-sensitive (‘window’) sodium current in cardiac Purkinje fibres. Pflugers Arch. 1979;379:137–142. doi: 10.1007/BF00586939. [DOI] [PubMed] [Google Scholar]
- Baruscotti M, Di Francesco D, Robinson RB. A TTX-sensitive inward sodium current contributes to spontaneous activity in newborn rabbit sino-atrial node cells. J Physiol. 1996;492:21–30. doi: 10.1113/jphysiol.1996.sp021285. [DOI] [PMC free article] [PubMed] [Google Scholar]
- Baruscotti M, Di Francesco D, Robinson RB. Na+ current contribution to the diastolic depolarization in newborn rabbit SA node cells. Am J Physiol Heart Circ Physiol. 2000;279:H2303–2309. doi: 10.1152/ajpheart.2000.279.5.H2303. [DOI] [PubMed] [Google Scholar]
- Baruscotti M, Westenbroek R, Catterall WA, Di Francesco D, Robinson RB. The newborn rabbit sino-atrial node expresses a neuronal type I-like Na+ channel. J Physiol. 1997;498:641–648. doi: 10.1113/jphysiol.1997.sp021889. [DOI] [PMC free article] [PubMed] [Google Scholar]
- Baumgarten CM, Isenberg G. Depletion and accumulation of potassium in the extracellular clefts of cardiac Purkinje fibres during voltage clamp hyperpolarization and depolarization. Pflugers Arch. 1977;386:19–31. doi: 10.1007/BF01063450. [DOI] [PubMed] [Google Scholar]
- Berg DE, Vassalle M. Oscillatory zones and their role in normal and abnormal sheep Purkinje fiber automaticity. J Biomed Sci. 2000;7:364–379. doi: 10.1007/BF02255812. [DOI] [PubMed] [Google Scholar]
- Bhattacharyya ML, Vassalle M. Effect of tetrodotoxin on electrical and mechanical activity of cardiac Purkinje fibers. J Electrocardiol. 1982;15:351–360. doi: 10.1016/s0022-0736(82)81008-x. [DOI] [PubMed] [Google Scholar]
- Bocchi L, Vassalle M. An analysis of the slow sodium current in single Purkinje and myocardial cells. FASEB J. 2000;14:A699. [Google Scholar]
- Böhle T, Steinbis M, Biskup C, Koopmann R, Benndorf K. Inactivation of single cardiac Na+ channels in three different gating modes. Biophys J. 1998;75:1740–1748. doi: 10.1016/S0006-3495(98)77615-5. [DOI] [PMC free article] [PubMed] [Google Scholar]
- Brown AM, Lee KS, Powell T. Sodium current in single rat heart muscle cells. J Physiol. 1981;318:479–500. doi: 10.1113/jphysiol.1981.sp013879. [DOI] [PMC free article] [PubMed] [Google Scholar]
- Carmeliet E. Slow inactivation of the sodium current in rabbit cardiac Purkinje fibres. Pflugers Arch. 1987;408:18–26. doi: 10.1007/BF00581835. [DOI] [PubMed] [Google Scholar]
- Carmeliet E, Saikawa T. Shortening of the action potential and reduction of the pacemaker activity by lidocaine, quinidine and procainamide in sheep cardiac Purkinje fibers. Circ Res. 1982;50:257–272. doi: 10.1161/01.res.50.2.257. [DOI] [PubMed] [Google Scholar]
- Cohen IS, Falk RT, Mulrine NK. Actions of barium and rubidium on membrane currents in canine Purkinje fibres. J Physiol. 1983;338:589–612. doi: 10.1113/jphysiol.1983.sp014691. [DOI] [PMC free article] [PubMed] [Google Scholar]
- Cohen IS, Kline R. K+ fluctuations in the extracellular spaces of cardiac muscle. Evidence from the voltage clamp and extracellular K+-selective microelectrodes. Circ Res. 1982;50:1–16. [PubMed] [Google Scholar]
- Cordeiro JM, Spitzer KW, Giles WR, Ershler PE, Cannell MB, Bridge JH. Location of the initiation site of calcium transients and sparks in rabbit heart Purkinje cells. J Physiol. 2001;531:301–314. doi: 10.1111/j.1469-7793.2001.0301i.x. [DOI] [PMC free article] [PubMed] [Google Scholar]
- Datyner N, Gintant G, Cohen IS. Microprocessor controlled trituration device for the dissociation of cardiac and other tissues. Pflugers Arch. 1985;403:105–108. doi: 10.1007/BF00583289. [DOI] [PubMed] [Google Scholar]
- Gilly WF, Armstrong CM. Threshold channels – a novel type of sodium channel in squid giant axon. Nature. 1984;309:448–450. doi: 10.1038/309448a0. [DOI] [PubMed] [Google Scholar]
- Gintant GA, Datyner NB, Choen IS. Slow inactivation of a tetrodotoxin-sensitive current in canine cardiac Purkinje fibers. Biophys J. 1984;45:509–512. doi: 10.1016/S0006-3495(84)84187-9. [DOI] [PMC free article] [PubMed] [Google Scholar]
- Hall AE, Hutter OF, Noble D. Current-voltage relations of Purkinje fibres in sodium-deficient solutions. J Physiol. 1963;166:225–240. doi: 10.1113/jphysiol.1963.sp007102. [DOI] [PMC free article] [PubMed] [Google Scholar]
- Hanck DA, Sheets MF. Extracellular divalent and trivalent cation effects on sodium current kinetics in single canine cardiac Purkinje cells. J Physiol. 1992;454:267–298. doi: 10.1113/jphysiol.1992.sp019264. [DOI] [PMC free article] [PubMed] [Google Scholar]
- Iacono G, Vassalle M. On the mechanism of the different sensitivity of Purkinje and myocardial fibers to strophanthidin. J Pharmacol Exp Ther. 1990;253:1–12. [PubMed] [Google Scholar]
- Isenberg G. Cardiac Purkinje fibers: cesium as a tool to block inward rectifying potassium currents. Pflugers Arch. 1976;365:99–106. doi: 10.1007/BF01067006. [DOI] [PubMed] [Google Scholar]
- Kline RP, Cohen IS. Extracellular [K+] fluctuations in voltage-clamped canine cardiac Purkinje fibers. Biophys J. 1984;46:663–668. doi: 10.1016/S0006-3495(84)84065-5. [DOI] [PMC free article] [PubMed] [Google Scholar]
- Kunze DL, Lacerda AE, Wilson DL, Brown AM. Cardiac Na currents and the inactivating, reopening, and waiting properties of single cardiac Na channels. J Gen Physiol. 1985;86:691–719. doi: 10.1085/jgp.86.5.691. [DOI] [PMC free article] [PubMed] [Google Scholar]
- Maier SK, Westenbroek RE, Schenkman KA, Feigl EO, Scheuer T, Catterall WA. An unexpected role for brain-type sodium channels in coupling of cell surface depolarization to contraction in the heart. Proc Natl Acad Sci U S A. 2002;99:4073–4078. doi: 10.1073/pnas.261705699. [DOI] [PMC free article] [PubMed] [Google Scholar]
- Muramatsu H, Zou AR, Berkowitz GA, Nathan RD. Characterization of a TTX-sensitive Na+ current in pacemaker cells isolated from rabbit sinoatrial node. Am J Physiol. 1996;270:H2108–2119. doi: 10.1152/ajpheart.1996.270.6.H2108. [DOI] [PubMed] [Google Scholar]
- Naharashi T. Chemicals as tools in the study of excitable membranes. Physiol Rev. 1974;54:813–889. doi: 10.1152/physrev.1974.54.4.813. [DOI] [PubMed] [Google Scholar]
- Richmond JE, Featherstone DE, Hartmann HA, Ruben PC. Slow inactivation in human cardiac sodium channels. Biophys J. 1998;74:2945–2952. doi: 10.1016/S0006-3495(98)78001-4. [DOI] [PMC free article] [PubMed] [Google Scholar]
- Saint DA, Ju YK, Gage PW. A persistent sodium current in rat ventricular myocytes. J Physiol. 1992;453:219–231. doi: 10.1113/jphysiol.1992.sp019225. [DOI] [PMC free article] [PubMed] [Google Scholar]
- Satin J, Kyle JW, Chen M, Bell P, Cribbs LL, Fozzard HA, Rogart RB. A mutant of TTX-resistant cardiac sodium channels with TTX-sensitive properties. Science. 1992;256:1202–1205. doi: 10.1126/science.256.5060.1202. [DOI] [PubMed] [Google Scholar]
- Shah AK, Cohen IS, Datyner NB. Background K+ current in isolated canine cardiac Purkinje myocytes. Biophys J. 1987;52:519–525. doi: 10.1016/S0006-3495(87)83241-1. [DOI] [PMC free article] [PubMed] [Google Scholar]
- Spiegler P, Vassalle M. Role of voltage oscillations in the automaticity of sheep cardiac Purkinje fibers. Can J Physiol Pharmacol. 1995;73:1165–1180. doi: 10.1139/y95-166. [DOI] [PubMed] [Google Scholar]
- Vassalle M. Cardiac pacemaker potentials at different extra- and intracellular K+ concentrations. Am J Physiol. 1965;208:770–775. doi: 10.1152/ajplegacy.1965.208.4.770. [DOI] [PubMed] [Google Scholar]
- Vassalle M. An analysis of cardiac pacemaker potential by means of a ‘voltage clamp’ technique. Am J Physiol. 1966;210:1335–1341. doi: 10.1152/ajplegacy.1966.210.6.1335. [DOI] [PubMed] [Google Scholar]
- Vassalle M. Electrogenic suppression of automaticity in sheep and dog Purkinje fibers. Circ Res. 1970;27:361–377. doi: 10.1161/01.res.27.3.361. [DOI] [PubMed] [Google Scholar]
- Vassalle M. Generation and conduction of impulses in the heart under physiological and pathological conditions. Pharm Ter B. 1977;3:1–39. doi: 10.1016/0306-039x(77)90002-2. [DOI] [PubMed] [Google Scholar]
- Vassalle M. Physiological basis of normal and abnormal automaticity. In: Rosenbaum MB, Elizari MV, editors. Frontiers of Cardiac Electrophysiology. Boston: Blackwell Science Inc; 1983. pp. 120–143. [Google Scholar]
- Vassalle M, Du F. A slow sodium current in single Purkinje cells. FASEB J. 2000;14:A699. [Google Scholar]
- Vassalle M, Scidá EE. The role of sodium in spontaneous discharge in the absence and in the presence of strophanthidin. Fed Proc. 1979;38:880. [Google Scholar]
- Vassalle M, Yu H, Cohen IS. The pacemaker current in cardiac Purkinje myocytes. J Gen Physiol. 1995;106:559–578. doi: 10.1085/jgp.106.3.559. [DOI] [PMC free article] [PubMed] [Google Scholar]
- Vassalle M, Yu H, Cohen IS. Pacemaker channels and cardiac automaticity. In: Zipes DP, Jalife J, editors. Cardiac Electrophysiology. From Cell to Bedside. Philadelphia: Blackwell Science Inc; 1999. pp. 94–103. [Google Scholar]
- Weidmann S. Effect of current flow on the membrane potential of cardiac muscle. J Physiol. 1951;115:227–236. doi: 10.1113/jphysiol.1951.sp004667. [DOI] [PMC free article] [PubMed] [Google Scholar]
- Zilberter YI, Starmer CF, Starobin J, Grant AO. Late Na+ channels in cardiac cells: the physiological role of background Na channels. Biophys J. 1994;67:153–160. doi: 10.1016/S0006-3495(94)80464-3. [DOI] [PMC free article] [PubMed] [Google Scholar]