

Abstract
The present study aimed to investigate whether there was a resetting of the baroreflex control of renal sympathetic nerve activity (RSNA) and heart rate (HR) during exercise. Wistar female rats (n = 11) were chronically implanted with catheters for the measurement of systemic arterial (Pa) and central venous pressures and with electrodes for measurement of RSNA and electrocardiogram (ECG) at least 3 days before study. The baroreflex curve for RSNA was determined by changing Pa using rapid intravenous infusions of phenylephrine and nitroprusside. The baroreflex response curves for RSNA and HR were characterized by an inverse sigmoid function curve from which the response range, gain, centring point and minimum response were estimated. Exercise shifted the Pa-RSNA baroreflex curve upward and to the right and was associated with increases in response range of 122 ± 44 % (P < 0.05), maximum response of 173 ± 40 % (P < 0.05), maximum gain of 149 ± 66 % (P < 0.05) and midpoint pressure of 15 ± 5 mmHg (P < 0.05) compared with the pre-exercise level. After cessation of exercise, the Pa-RSNA baroreflex curve was suppressed vertically with a significant decrease in maximum response of 57 ± 14 % (P < 0.05) compared with the pre-exercise level. These data suggest that the right-upward shift of baroreflex control of sympathetic nerve activity may play a critical role in raising and stabilizing Pa during exercise. The suppression of the baroreflex control of sympathetic nerve activity may partly explain the post-exercise inhibition of sympathetic nerve activity and contribute to the post-exercise hypotension.
Exercise has an important impact on the systems regulating systemic arterial pressure (Pa). The onset of exercise increases Pa, which is accompanied by increases in heart rate (HR) and sympathetic nerve activity in man (Rowell et al. 1996) and animals (Di Carlo & Bishop, 2001). After cessation of exercise, Pa decreases and is accompanied by a fall in sympathetic nerve activity in man (Floras et al. 1989) and animals (Kulics et al. 1999; Di Carlo & Bishop, 2001). These concomitant changes in Pa and sympathetic nerve activity have been explained using the concept of acute resetting of baroreflex control of sympathetic nerve activity. In 1990 Rowell and O'Leary proposed a hypothetical stimulus-response curve for the arterial baroreflex, expressed as a relationship between sympathetic nerve activity and Pa, and which could be immediately reset rightward and upward in parallel manner after the onset of exercise. Since that time the acute baroreflex resetting during exercise has been extensively studied. However, most of the studies investigating the acute resetting of arterial baroreflex function have focused on the reflex control of HR and/or Pa but little is known of how exercise modifies the baroreflex control of sympathetic nerve activity.
Several attempts have been made to assess how baroreflex control of sympathetic nerve activity may be altered during exercise, but inconsistent results have been reported. Kamiya et al. (2001) showed in man that baroreflex control of muscle sympathetic nerve activity, analysed using a simple linear regression, was shifted rightward with an increase in sensitivity of > 300 % during static handgrip exercise at 30 % of maximal voluntary force. Fadel et al. (2001), also using a simple linear regression, showed in man that baroreflex control of muscle sympathetic nerve activity was shifted to the right without changes in sensitivity during arm cycling at 50 % peak O2 uptake. These investigators analysed the baroreflex control of muscle sympathetic nerve activity by fitting data to a simple linear equation, which meant that the complete stimulus-response relationship of the baroreflex control of sympathetic nerve activity during exercise was not obtained and therefore remains unknown.
We recently reported (Miki et al. 2002) that in chronically instrumented rats renal sympathetic nerve activity (RSNA) and Pa were increased at the initiation and for the duration of the exercise regime. The question arises as to whether under these circumstances there was evidence for resetting of the baroreflex control of RSNA. In order to address this problem we determined the entire baroreflex stimulus-response curve for sympathetic nerve activity and HR during treadmill exercise and in the post-exercise period in conscious rats. In this way, the possible role of the acute shift of baroreflex control of RSNA in elevating and stabilizing Pa during exercise as well as causing post-exercise hypotension could be evaluated.
Methods
Animal care and training
Female Wistar rats were housed individually in a temperature (24 °C) and light (12 h:12 h light-dark cycle, light 12:00–24:00 h)-controlled room. The animals were allowed standard laboratory rat chow and water ad libitum and handled every day. Upon arriving, animals weighed between 150 and 200 g and were allowed to adjust to their new environment for 1–2 days. Thereafter, all animals (n = 16) began a daily running programme on a motor-driven rodent treadmill during the dark cycle (09:00–12:00 h). Over a 1 week period, the intensity and duration of running was gradually increased from 10 m min−1 with a 0 % gradient until animals were running 20–30 min day−1 at a speed of 25 m min−1 with a 0 % gradient. We continued to train the animal at this intensity until the day of the experiment. Five rats dropped out of the training regime, thus 11 rats completed the study protocol. All procedures were in accordance with the Guiding Principles in the Care and Use of Animals in the Fields of Physiological Sciences published by The Physiological Society of Japan (1988) with the prior approval of the Animal Care Committee of Nara Women's University.
Instrumentation of animals
When an animal's body weight reached ∼250 g, it was anaesthetized with pentobarbital sodium (45 mg kg−1i.p.) and underwent aseptic surgery for the implantation of catheters and electrodes based on our previous report (Miki et al. 2002). Briefly, the arterial catheter was placed into the abdominal aorta via the tail artery. Two small venous catheters were placed into the superior vena cava via the common jugular vein. A pair of 60 cm polyethylene tubes (PE 10, Intramedic, Sparks, MD, USA) were tied and advanced into the superior vena cava so that the tips lay just above the right atrium. One of the venous catheters was used for the infusion of phenylephrine hydrochloride and the other for the sodium nitroprusside. To record RSNA, a bipolar electrode was implanted. The left kidney was exposed retroperitoneally through a left flank incision, a branch of the renal nerve running on or beside the renal artery was isolated carefully, bipolar stainless steel wire electrodes were hooked onto the nerve and both were embedded in a two-component silicone rubber (see Miki et al. 2002 for full details). A bipolar electrode was also implanted under the skin at the xiphoid and the manubrium levels to record the electrocardiogram (ECG).
Experimental protocol
All experiments were performed in the dark period between 08:00 and 12:00 h and began no earlier than 3 days after the implantation of the electrodes and catheters. On the study day, food and water were removed 1 h before the start of the experiment. The rat was moved onto the treadmill lane and attached to the leads and cannulae for measurement of Pa, central venous pressure (Pcv), EEG and RSNA. Phenylephrine hydrochloride and sodium nitroprusside were loaded separately into the venous catheter. Data collection began once a relatively constant heart rate had been obtained over a 5–10 min period.
The experiment consisted of a 60 min resting period while the animals sat on the treadmill lane, thereafter the animals ran for 30 min at a speed of 20 m min−1 with a 0 % gradient and were then allowed a 60 min rest period on the lane before taking the post-exercise measurements. The steady state level of RSNA and haemodynamic variables were measured by averaging the values taken over 5 min (7.5–12.5 min of each period) and then the baroreflex control of RSNA and HR was assessed during pharmacological manipulation of Pa. The increases and decreases in Pa were achieved using bolus intravenous doses of phenylephrine hydrochloride (10 μg) given over 40 s starting at 12.5 min and sodium nitroprusside (10 μg) over 40 s starting at 17.5 min, before, during and after the treadmill exercise. The phenylephrine and nitroprusside were given in random order. The corresponding responses in RSNA and HR, together with Pa, were recorded and data were then fitted into the sigmoidal logistic equations.
For the time control experiment, a plate was placed above the treadmill lane such that rats were exposed to exactly the same conditions as when exercising, including noise and vibration levels, except that there was no running. The time control experiment consisted of a 60 min resting period on the treadmill lane, 30 min sham treadmill exercise and a 60 min post-exercise period.
At the end of the study protocol, rats were humanely killed by an intravenous overdose of pentobarbital sodium (> 200 mg kg−1).
Measurements
RSNA was amplified by a differential amplifier (MK-1, Biotex, Kyoto, Japan) with a band-pass filter of 150 Hz (low-cut frequency) and of 2 kHz (high-cut frequency), displayed on an oscilloscope and made audible with an amplifier. The amplified neural activity was integrated using a voltage integrator with a time constant of 0.1 s (EI-601G, Nihon Kohden, Tokyo, Japan). The area of integrated nerve discharge was calculated simultaneously by means of a computer using analog-to-digital conversion at 1 ms intervals. ECG signals were amplified using a differential amplifier (MK-2, Biotex). Heart rate (HR) was determined with a cardiotachometer (AT-601G, Nihon Kohden) triggered by the ECG. Pa and Pcv were measured by connecting the catheters to pressure transducers (DX-360, Nihon Kohden).
Pa, Pcv, HR, RSNA and integrated RSNA were displayed on an eight-channel oscillographic recorder (ORP1200, Yokogawa, Tokyo, Japan) and sampled for analog-to-digital conversion at 1 ms intervals. The mean values of the data converted over 1 s were calculated simultaneously, continuously displayed on the computer and stored on the hard disk
The background noise for the RSNA recording was determined when nerve activity was eliminated by increasing arterial pressure with an intravenous infusion of phenylephrine (10 μg) during the pre-exercise period. The background noise was then subtracted from the integrated RSNA data. To quantify the RSNA response, percentage changes were calculated by taking the mean of the values during the pre-exercise period as 100 % RSNA
Data analysis
A logistic sigmoid function as described by Kent et al. (1972) was used to analyse baroreflex curves:
| (1) |
where Y is RSNA or HR; X is Pa; A1 is the response range for Y (maximum response minus minimum response); A2 is the gain coefficient; A3 is the pressure at the midrange of the curve (centring point); A4 is the minimum response of Y. In each animal, Pa and RSNA or HR data were fitted to the logistic function to generate parameters A1, A2, A3 and A4 using graphics software (DeltaGraph, SPSS Chicago, IL, USA). We calculated the maximum response for HR and RSNA, saturation pressure for Pa (Pa,sat), threshold pressure for Pa (Pa,thr), operating range for Pa, first derivative of the curve and maximal gain according to the following equations (Potts et al. 1993; Saigusa et al. 1996):
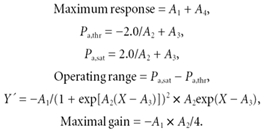 |
The maximum response is the upper plateau of the curve. Pa,thr and Pa,sat are the Pa values at which HR or RSNA was within 5 % of maximum or minimum response, respectively. The operating range implies the range of Pa over which HR and RSNA responded. The first derivative of eqn (1) may indicate the reflex gain whilst the maximal gain is defined as the gain value located at the centring point of the reflex (X = A3).
To avoid the effects of uneven density of Y (HR or RSNA) axis data along the X (Pa) axis, all data were averaged over each 2.5 mmHg bin of Pa. Mean values of RSNA, HR and Pa within every 2.5 mmHg bin of Pa were used for curve fitting. Baroreflex response curves were constructed, and their parameters were calculated for each trial of the pharmacological manipulation of arterial pressure in each animal and then averaged across the animals. The averaged A1, A2, A3 and A4 were then used to generate average baroreflex curves (Figs 2, 3 and 4) and first derivatives of the curve (Fig. 5).
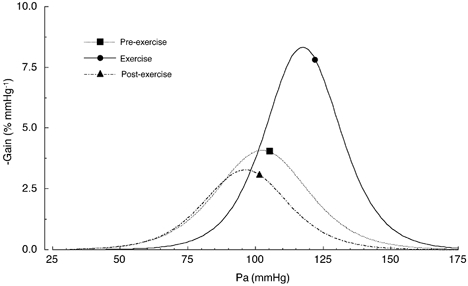
Figure 2. Shifts in the baroreflex curves for RSNA obtained during pre-exercise, treadmill exercise and the post-exercise periods.
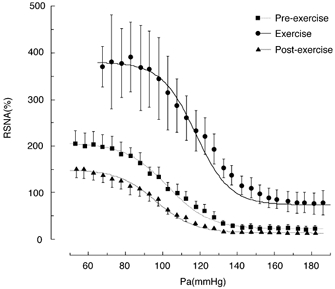
Curves reflect data averaged from 11 animals and symbols and bars indicate means ±s.e.m., respectively, estimated over each 2.5 mmHg bin of Pa.
Figure 3. Shifts in the baroreflex curves for HR obtained during pre-exercise, treadmill exercise and the post-exercise periods.
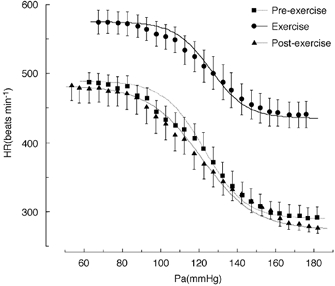
Curves reflect data averaged from 11 animals and symbols and bars indicate means ±s.e.m., respectively, estimated over each 2.5 mmHg bin of Pa.
Figure 4. Shifts in the baroreflex curves for RSNA and HR observed during pre-sham exercise, sham exercise and post-sham exercise periods.
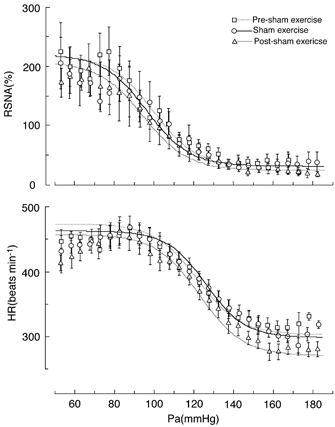
Sham exercise was carried out by placing a plate above the treadmill lane such that rats were exposed to exactly the same conditions of treadmill exercise except that there was no running. Curves reflect data averaged from 11 animals and symbols and bars indicate means ±s.e.m., respectively, which were averaged over each 2.5 mmHg bin of Pa.
Figure 5. First derivative of the Pa-RSNA baroreflex curve shown in Fig. 2.
Symbols indicate steady state levels of Pa in Table 1, which were obtained before the pharmacological manipulations of Pa.
Statistical analysis
Statistical analysis was performed using analysis of variance (ANOVA) for repeated measures. When the F values were significant (P < 0.05), individual comparisons were made using the Fisher's least significant difference test (Sachs, 1982). Values are reported as means ±s.e.m.
Results
The responses of Pa, HR and RSNA to treadmill exercise (20 m min−1 with no gradient) are summarized in Table 1 and show that Pa, HR and RSNA increased significantly (P < 0.05) by 17.3 ± 5.0 mmHg, 102.4 ± 13.0 beats min−1 and 50.9 ± 23.9 %, respectively, compared with the pre-exercise levels.
Table 1.
Steady state haemodynamic parameters
| Pa (mmHg) | HR (beats min−1) | RSNA (%) | |
|---|---|---|---|
| Exercise | |||
| Pre-exercise | 105.3 ± 4.4 | 434.1 ± 11.5 | 100 |
| Exercise | 122.0 ± 5.6*† | 536.5 ± 15.4*† | 150.9 ± 23.9*† |
| Post-exercise | 101.6 ± 4.4 | 412.3 ± 12.5 | 74 ± 12.8* |
| Time control | |||
| Pre-sham exercise | 102.1 ± 5.6 | 414.9 ± 8.9 | 100 |
| Sham exercise | 104.6 ± 5.0 | 419.9 ± 9.5 | 127.7 ± 27.0 |
| Post-sham exercise | 103.5 ± 5.3 | 398.9 ± 8.3 | 105.1 ± 19.6 |
Values are means ±s.e.m. (n = 11); Pa, systemic arterial pressure; HR, heart rate; RSNA, renal sympathetic nerve activity
P < 0.05 vs. pre-exercise
P < 0.05 vs. time control.
Figure 1 depicts a typical recording of ECG, Pa, Pcv, HR, RSNA and integrated RSNA obtained during exercise when the pharmacological manipulations of Pa were undertaken to generate baroreflex curves for RSNA and HR. The peak-to-peak signal of the original RSNA recording was in the range of 100–200 μV while the noise level for the RSNA recording was less than 5 μV and no more than 20 μV, and there was no discernible contamination originating from either muscle contraction or the treadmill machine, which allowed us to quantify the baroreflex curve for RSNA during treadmill exercise.
Figure 1. Typical recordings from an individual rat of electrocardiogram (ECG), systemic arterial pressure (Pa), central venous pressure (Pcv), heart rate (HR), renal sympathetic nerve activity (RSNA) and integrated RSNA during pharmacological manipulation of Pa during treadmill exercise.
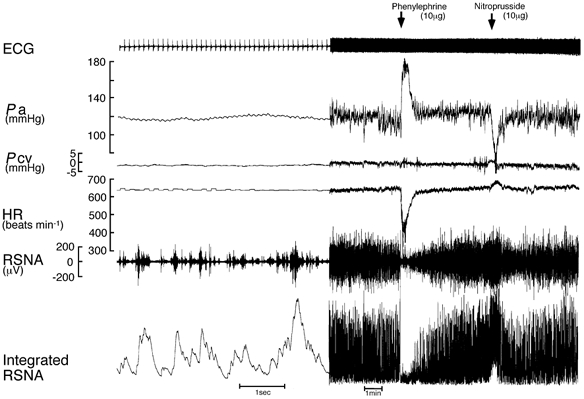
A bolus intravenous infusion of phenylephrine (10 μg) and nitroprusside (10 μg) was given to generate the stimulus-response curves for RSNA and HR. Data are presented at two different recording speeds.
The treadmill exercise shifted the baroreflex curve for RSNA acutely to the right and upward (Fig. 2) which was characterized by a significant increase in the centring point of the reflex (A3) by 15.2 ± 5.3 mmHg (P < 0.05) associated with a significant increase in Pa,thr by 19.0 ± 6.8 mmHg (P < 0.05), and Pa,sat by 11.3 ± 5.3 mmHg (P < 0.05) relative to the pre-exercise level (Tables 2 and 3). The operating range (Pa,sat – Pa,thr) tended to decrease, by 7.7 ± 6.1 mmHg (0.1 > P > 0.05), relative to the pre-exercise level. The Y axis (% RSNA) shift of the baroreflex curve for RSNA was characterized by increases in the response range (A1) of 121.5 ± 44.0 % (P < 0.05), minimum response (A4) of 51.6 ± 16.3 % (P < 0.05) and maximum response (A1+A4) of 173.1 ± 40.8 % (P < 0.05) relative to the pre-exercise level (Table 3). The maximal gain, which is dependent on the response and operating ranges, increased significantly by 149 ± 66.1 % (P < 0.05) during exercise relative to the pre-exercise level, because of the fact that the response range (Y axis) increased significantly whereas the operating range (X axis) showed only a small decrease (Tables 2 and 3).
Table 2.
Logistic model parameters describing the baroreflex curves for RSNA and HR
| Pa-RSNA reflex | A1 (%) | A2 (mmHg−1) | A3 (mmHg) | A4 (%) |
|---|---|---|---|---|
| Exercise | ||||
| Pre-exercise | 184.4 ± 24.4 | 0.089 ± 0.009 | 102.4 ± 3.2 | 23.0 ± 6.7 |
| Exercise | 305.9 ± 53.8*† | 0.109 ± 0.013 | 117.5 ± 7.0*† | 74.6 ± 23.3*† |
| Post-exercise | 135.9 ± 20.3* | 0.097 ± 0.008 | 96.2 ± 3.5 | 14.8 ± 3.1 |
| Time control | ||||
| Pre-sham exercise | 187.3 ± 30.5 | 0.092 ± 0.013 | 99.5 ± 5.2 | 31.8 ± 6.9 |
| Sham exercise | 187.4 ± 30.5 | 0.093 ± 0.011 | 95.9 ± 4.4 | 33.2 ± 8.6 |
| Post-sham exercise | 181.6 ± 37.2 | 0.089 ± 0.007 | 94.4 ± 7.0 | 26.1 ± 6.5 |
| Pa-HR reflex | A1 (beats min−1) | A2 (mmHg−1) | A3 (mmHg) | A4 (beats min−1) |
| Exercise | ||||
| Pre-exercise | 199.4 ± 16.3 | 0.095 ± 0.020 | 122.9 ± 4.0 | 290.2 ± 15.7 |
| Exercise | 139.7 ± 15.6* | 0.106 ± 0.013 | 126.3 ± 4.0 | 435.6 ± 18.5*† |
| Post-exercise | 207.9 ± 18.7 | 0.072 ± 0.005 | 121.3 ± 5.4 | 274.8 ± 9.0 |
| Time control | ||||
| Pre-sham exercise | 172.0 ± 12.0 | 0.093 ± 0.012 | 116.6 ± 2.7 | 302.6 ± 7.1 |
| Sham exercise | 165.3 ± 14.6 | 0.102 ± 0.100 | 121.0 ± 2.2 | 298.1 ± 7.1 |
| Post-sham exercise | 187.9 ± 16.8 | 0.091 ± 0.012 | 117.7 ± 2.6 | 270 ± 7.8 |
Values are means ±s.e.m.A1, response range; A2, gain coefficient; A3, pressure at the midrange of the curve (centring point); A4, minimum response.
P < 0.05 vs. pre-exercise
P < 0.05 vs. time control at corresponding period.
Table 3.
Derived variables describing the baroreflex control of RSNA and HR
| Pa-RSNA reflex | Maximum response (%) | Pa,thr (mmHg) | Pa,sat (mmHg) | Operating range (mmHg) | Maximal gain (%mmHg−1) |
|---|---|---|---|---|---|
| Exercise | |||||
| Pre-exercise | 207.5 ± 27.1 | 78.3 ± 4.6 | 126.5 ± 3.3 | 48.2 ± 4.7 | −3.95 ± 0.50 |
| Exercise | 380.6 ± 55.5*† | 97.3 ± 6.4*† | 137.8 ± 8.3† | 40.5 ± 4.7 | −8.44 ± 1.73*† |
| Post-exercise | 150.7 ± 19.5 | 74.4 ± 3.6 | 118.1 ± 4.5 | 43.7 ± 4.3 | −3.41 ± 0.63 |
| Time control | |||||
| Pre-sham exercise | 219.1 ± 31.1 | 75.4 ± 4.9 | 123.5 ± 7.0 | 48.2 ± 6.2 | −4.80 ± 1.49 |
| Sham exercise | 220.6 ± 34.9 | 72.2 ± 7.1 | 119.7 ± 2.7 | 47.4 ± 6.1 | −4.32 ± 1.06 |
| Post-sham exercise | 207.7 ± 37.0 | 71.0 ± 8.0 | 117.8 ± 6.6 | 46.8 ± 4.2 | −4.10 ± 0.99 |
| Pa-HR reflex | Maximum response (beats min−1) | Pa,thr (mmHg) | Pa,sat (mmHg) | Operating range (mmHg) | Maximal gain (beats min−1 mmHg−1) |
| Exercise | |||||
| Pre-exercise | 489.6 ± 15.4 | 97.2 ± 4.3 | 148.7 ± 5.5 | 51.6 ± 5.7 | −4.24 ± 0.45 |
| Exercise | 575.3 ± 16.9*† | 105.0 ± 3.5 | 147.5 ± 5.4 | 42.5 ± 4.5 | −3.53 ± 0.47 |
| Post-exercise | 482.7 ± 21.3 | 91.5 ± 3.4 | 151.1 ± 8.2 | 59.7 ± 6.6 | −3.70 ± 0.37 |
| Time control | |||||
| Pre-sham exercise | 474.6 ± 13.9 | 92.5 ± 3.0 | 140.7 ± 4.1 | 48.2 ± 4.7 | −3.89 ± 0.44 |
| Sham exercise | 463.4 ± 17.6 | 99.5 ± 3.3 | 142.5 ± 2.9 | 43.0 ± 4.3 | −3.96 ± 0.28 |
| Post-sham exercise | 458.0 ± 18.9 | 92.1 ± 4.9 | 143.4 ± 3.2 | 51.3 ± 6.5 | −3.88 ± 0.29 |
Values are means ±s.e.m.
P < 0.05 vs. pre-exercise
P < 0.05 vs. time control at corresponding period.
The baroreflex curve for HR was shifted upward by the treadmill exercise (Fig. 3, Tables 2 and 3). The parameters relating the shift of the X axis (arterial pressure) including the centring point of the reflex (A3), Pa,thr, Pa,sat and the operating range, did not change significantly during the treadmill exercise relative to the pre-exercise level. As to the parameters describing the shift relating to the Y axis, the minimum response (A4) increased significantly by 145.4 ± 19.7 beats min−1 (P < 0.05), the response range (A1) decreased significantly by 59.7 ± 15.4 beats min−1 (P < 0.05) and the maximum response (A1+A4) increased significantly by 85.6 ± 28.7 beats min−1 (P < 0.05) relative to the pre-exercise level. The maximal gain of the baroreflex curve for HR did not change significantly during the treadmill exercise.
After cessation of the treadmill exercise, Pa, Pcv and HR returned to the pre-excise level (Table 1) while RSNA deceased significantly (P < 0.05) by 26 % relative to the pre-exercise level.
The baroreflex curve for RSNA obtained once exercise had ceased was suppressed vertically (Fig. 2) with the maximum response being significantly decreased by 56.8 ± 14.3 % (P < 0.05) relative to the pre-exercise level. There were no changes in any of the other parameters, that is A1, A2, A3, A4, Pa,thr, Pa,sat, operating range and maximal gain, compared with pre-exercise and corresponding sham exercise. The baroreflex curve for HR obtained after cessation of exercise was almost identical with that obtained during the pre-exercise period (Fig. 3).
In the sham exercise experiments, in which rats were exposed to the same experimental environments but did not run, the baroreflex curves for RSNA and HR obtained during the corresponding pre-exercise, exercise and post-exercise periods demonstrated an almost identical shape (Fig. 4). None of the logistic parameters for RSNA and HR changed over the periods of pre-, during- and post-sham exercise.
Discussion
The major objective of the present study was to generate the full range of the baroreflex stimulus-response curve for RSNA before, during and post-treadmill exercise in rats. Our findings indicated clearly that the treadmill exercise acutely shifted the baroreflex curve for RSNA upward and to the right with significant increases in the response range, centring point of the reflex and maximal gain along with relocation of the operating pressure around the centring point. These adaptations in the parameters would allow Pa to be maintained at a higher level and stabilize any fluctuations in Pa during the treadmill exercise (Rowell & O'Leary, 1990). It was striking that the baroreflex curve for RSNA was suppressed vertically with a significant decrease in the maximum response compared with the pre-exercise level after cessation of the treadmill exercise, which may help explain the post-exercise suppression of sympathetic nerve activity and cardiovascular functions reported previously (Di Carlo & Bishop, 2001; Kajekar et al. 2002).
Shift of baroreflex stimulus-response relationship for RSNA induced by treadmill exercise
Although baroreflex control of HR has been widely studied during exercise (Walgenbach & Donald, 1983; Rowell & O'Leary, 1990; Potts et al. 1993; Bishop, 1994; Rowell et al. 1996), studies on the baroreflex control of sympathetic nerve activity are sparse and there is a lack of data on the full range of the Pa-RSNA baroreflex curve which could be compared with the present results. Importantly, the shift in the Pa-RSNA baroreflex curve observed in the present study during the treadmill exercise could well explain how the cardiovascular system is able to raise and stabilize Pa despite the massive and varying vasodilatation which would be occurring in the exercising muscle. The most obvious effect of the treadmill exercise on the baroreflex control of RSNA was a marked increase in the maximum response (upper plateau) to 380 % (up by 173 %) from 208 % in the pre-exercise period. This would indicate that the treadmill exercise resulted in an approximately twofold increase in the capacity of sympathetic drive to the peripheral organs. Furthermore, the minimum response of the baroreflex curve for RSNA (lower plateau) also increased significantly to 75 %, indicating that the enhanced sympathetic modulation had not been suppressed completely by the maximum inhibitory effects originating from the arterial baroreceptors. It is apparent from these pieces of evidence that the sympathetic influence on the cardiovascular system was tonically enhanced over the entire operating range of Pa during exercise. Furthermore, as shown in Fig. 5, the operating range was reset to the right which was accompanied by a relocation of the operating pressure (steady state level before the pharmacological manipulation of Pa) around the centring point. The relocation of the operating pressure to the centring point, where the gain is maximal, would be favourable for stabilizing Pa because this places the baroreflex curve into a situation such that it can respond to both increases and decreases in Pa. Again, the significant increases in maximal gain would allow the cardiovascular system to buffer the fluctuations in Pa more efficiently, because the arterial baroreflex has been considered to be a closed-loop feedback system and an appropriate increase in feedback gain may produce a more stable regulation. One conclusion that can be drawn is that the shift of the Pa-RSNA baroreflex curve as reported would play a critical role in increasing and stabilizing Pa during exercise.
The neural mechanisms underlying the acute shift of the baroreflex during exercise have been extensively studied (Rowell & O'Leary, 1990; Di Carlo & Bishop, 1992; Potts et al. 1993; Bishop, 1994; Potts & Mitchell, 1998; Potts, 2001; Kajekar et al. 2002; Raven et al. 2002; Williamson et al. 2002), but have not yet been completely elucidated. The present study may provide further insight into the mechanisms underlying the acute resetting of the baroreflex control of sympathetic outflow during exercise; that is, related to the reported changes in maximum and minimum response of the baroreflex curve for RSNA. The maximum response of RSNA has been considered to reflect the number and/or synchronicity of bursting population of the sympathetic motoneurones at the lowest baroreceptor afferent activity (Saigusa & Head, 1993; Saigusa et al. 1996; Head & Burke, 2000). Thus, it might be possible that exercise could enhance the tonic drive of the sympathetic motoneurones, possibly in the rostral ventrolateral medulla (RVLM; Saigusa & Head, 1993; Jordan, 1995; Saigusa et al. 1996), which might overcome the baroreceptor afferent input, such that the maximum and minimum responses increased with the increase in maximal gain during exercise.
Shift of baroreflex stimulus-response relationship for RSNA during the post-exercise period
After cessation of the exercise, the Pa-RSNA baroreflex curve was suppressed vertically with a significant decrease in the maximum response, which was consistent with a recent report by Kajekar et al. (2002). They demonstrated that after a single 40 min bout of treadmill exercise there was a decreased Pa in spontaneously hypertensive rats which was at a time when the baroreflex control of the RVLM sympathetic cardiovascular neuronal activity and lumber sympathetic outflow operated with a significantly reduced maximum neural activity and gain when acutely measured under alpha-chloralose and urethane anaesthetized state (Kajekar et al. 2002). These observations, together with the present results, would suggest that the reduction in tonic drive to the sympathetic motoneurones in the RVLM would cause a reduction in lumber sympathetic nerve activity and RSNA during the post-exercise period.
Post-exercise inhibition of sympathetic nerve activity has been observed in man (Bennett et al. 1984; Floras et al. 1989) and animals (Collins et al. 2001; Di Carlo & Bishop, 2001) with hypertension. Consistent with previous studies in hypertensive rats, the present study further demonstrated that the reduction in steady state level of RSNA also occurred in normotensive rats without change in Pa during the post-exercise period. This post-exercise sympatho-inhibition can be explained by the suppression of the Pa-RSNA baroreflex curve observed in the present study. Because, the vertical suppression of the Pa-RSNA baroreflex curve was due to the reduction of the maximum response of RSNA by ∼50 % without alteration in the minimum response, the outcome was that RSNA became lower at all levels of Pa compared with the pre-exercise period (Fig. 2). Therefore, RSNA would be maintained at a lower level even though Pa remained unchanged after exercise. It is therefore possible to conclude that the acute suppression of the Pa-RSNA baroreflex curve may contribute to the post-exercise sympatho-inhibition (Floras et al. 1989; Di Carlo & Bishop, 2001). This view would be consistent with previous reports that an impairment of sympathetic vasoconstriction occurred during the post-exercise period (Halliwill et al. 1996; Kenny et al. 1998), which may be a potential reason for the decrease in Pa in hypertensive animals and man. In the normotensive rats, Pa did not decrease significantly during the post-exercise period whereas the Pa-RSNA baroreflex curve was attenuated. This observation raises the possibility that there might be less vasoconstriction during the post-exercise period in normotensive rats, but not to the extent of causing a significant reduction in Pa.
Shifts of baroreflex stimulus-response relationship for HR induced by treadmill exercise
The shifts in the baroreflex stimulus-response relationship for HR obtained both during exercise and in the post-exercise period were different from those for RSNA (Fig. 2 and Fig. 3). Exercise resulted in a vertical shift of baroreflex stimulus-response curve for HR without alterations in the coefficient of gain or maximal gain, which would be consistent with previous reports (Potts et al. 1993; Gallagher et al. 2001; Raven et al. 2002). Furthermore, the Pa-HR baroreflex curve obtained during the post-exercise period was identical to that obtained in the pre-exercise period while the Pa-RSNA baroreflex curve was suppressed vertically during the post-exercise period (Fig. 2). These results clearly indicate that the physiological relevance of the baroreflex sensitivity or gain of the Pa-HR baroreflex curve is different from that of the Pa-RSNA baroreflex curve. This is an important point as previous discussions of the shifts in baroreflex function curve have often been considered without specifying the dependent variables including HR, Pa and sympathetic nerve activity. The majority of investigations have reported that the baroreflex stimulus-response curves for HR and Pa occurred without changes in the maximal gain of the reflex during exercise (Raven et al. 2002), and this view has been extrapolated to sympathetic nerve activity without providing direct evidence for sympathetic responses (Collins et al. 2001). Obviously the current study would indicate that the dependent variable of the baroreflex control has to be specified when shifts in baroreflex stimulus response curves are discussed.
There may be a number of possible explanations for the difference between the Pa-HR and Pa-RSNA baroreflex curves which may be related to: (1) the participation of cardiac vagal nerve activity, (2) the maximum heart rate which can be achieved, and/or (3) regional differences in sympathetic nerve activity, that is between the cardiac and renal nerves. Regarding the first point, it is reasonable to speculate that exercise might modify not only sympathetic but also vagal nerve activity; however, little attention has been paid as to how exercise might influence the baroreflex control of vagal activity. In the post-exercise phase, we observed no significant difference in either the steady state value of HR or the baroreflex stimulus-response curve for HR compared with the pre-exercise period, whereas both steady state values for RSNA and the baroreflex stimulus-response curves for RSNA were suppressed. This suggests that steady state cardiac vagal nerve activity and the baroreflex stimulus-response curve for cardiac vagal nerve might be suppressed during the post-exercise period. Because HR is determined by the reciprocal balance between sympathetic and vagal nerve activities, sympathetic and vagal nerve activities must change in the same direction in order to maintain HR at the same value HR. Secondly, the maximum response of the Pa-HR baroreflex curve was 575 beats min−1 which is close to the highest heart rate achieved at the point of maximal oxygen consumption during treadmill exercise in female rats (Morris et al. 1993). If this is so, then the vertical expansion of the Pa-HR baroreflex curve may not be achieved because heart rate has reached an upper physiological limit. Finally, the possibilities discussed above are based on the assumption that there are no differences in the patterns of cardiac and renal sympathetic outflows elicited during exercise. Although no attempt has been made to measure cardiac and renal sympathetic nerve activities simultaneously, the possibility of the regional differences in sympathetic nerve activity cannot be discounted (Simon & Riedel, 1975). This issue may be extended to the possible differences in sympathetic nerve activity between kidney and muscle which have been reported to occur during exercise (Fadel et al. 2001)
Limitations
The average oxygen consumption attained during treadmill exercise at a speed of 20 m min−1 with 0 % gradient performed in the present study was 51 ml min−1 kg−1, which was approximately 70 % of the maximum oxygen consumption (K. Miki, M. Yoshimoto, A. Honda & A. Kosho, unpublished observation). Moreover, the heart rate obtained during treadmill exercise at this speed was approximately 90 % of the maximum heart rate (Morris et al. 1993) suggesting that high-intensity exercise was performed in the present study (Veras-Silva et al. 1997). This intensity was chosen because the majority of the animals were able to keep running continuously at this speed, while some of animal would only run intermittently back and forth on the treadmill lane when a lower speed was chosen. Since it is well established that a shift in the baroreflex control of HR occurs in direct relation to the intensity of exercise from rest to maximum, a lower exercise intensity may possibly cause a different, possibly attenuated, shift in the Pa-RSNA baroreflex curve (Fadel et al. 2001).
Small bolus doses of vasoactive drugs were injected intravenously, which caused slow ramp changes in Pa for evaluating baroreflex control of RSNA in the present study. This method allows the evaluation of dynamic rather than steady state baroreflex responses to gradual (step-by-step) changes in Pa which would be achieved by the continuous infusion of vasoactive drugs. Since, it has been reported that NO has a central influence on baroreflex control of sympathetic nerve activity (Liu et al. 1996), bolus and small infusions of nitroprusside rather than a continuous infusion may be more appropriate to avoid the possible effect of nitroprusside per se on the baroreflex curve. To study possible effects of the nitroprusside injection (10 μg) on the Pa-RSNA baroreflex curve, time control experiments were carried out and the Pa-RSNA and Pa-HR baroreflex curves obtained during the pre-exercise, sham exercise and post-exercise periods were compared (Fig. 4). As shown in Fig. 4, the Pa-RSNA and Pa-HR baroreflex curves were almost identical, suggesting that the method of bolus injection of nitroprusside may have, if any, negligible effects on both the Pa-RSNA and Pa-HR baroreflex curves. Since bolus injections of vasoactive drugs, including nitroprusside, have been used for evaluating baroreflex function in human experiments, the small bolus injections of vasoactive drugs might have an advantage in keeping a methodological consistency with human experiments (Rudas et al. 1999).
Acknowledgments
The authors thank Dr Edward J. Johns (Department of Physiology, University College Cork, Ireland) for his critical reading of the manuscript. This study was supported in part by a Grant-in-Aid for Scientific Research from Ministry of Education, Science, and Culture of Japan, and a grant from the Kituen Kagaku foundation of Japan.
REFERENCES
- Bennett T, Wilcox RG, Macdonald IA. Post-exercise reduction of blood pressure in hypertensive men is not due to acute impairment of baroreflex function. Clin Sci (Lond) 1984;67:97–103. doi: 10.1042/cs0670097. [DOI] [PubMed] [Google Scholar]
- Bishop VS. Carotid baroreflex control of blood pressure and heart rate in men during dynamic exercise. J Appl Physiol. 1994;77:491–492. doi: 10.1152/jappl.1994.77.2.491. [DOI] [PubMed] [Google Scholar]
- Collins HL, Rodenbaugh DW, Di Carlo SE. Central blockade of vasopressin V(1) receptors attenuates postexercise hypotension. Am J Physiol Regul Integr Comp Physiol. 2001;281:R375–380. doi: 10.1152/ajpregu.2001.281.2.R375. [DOI] [PubMed] [Google Scholar]
- Di Carlo SE, Bishop VS. Onset of exercise shifts operating point of arterial baroreflex to higher pressures. Am J Physiol. 1992;262:H303–307. doi: 10.1152/ajpheart.1992.262.1.H303. [DOI] [PubMed] [Google Scholar]
- Di Carlo SE, Bishop VS. Central baroreflex resetting as a means of increasing and decreasing sympathetic outflow and arterial pressure. Ann N Y Acad Sci. 2001;940:324–337. doi: 10.1111/j.1749-6632.2001.tb03688.x. [DOI] [PubMed] [Google Scholar]
- Fadel PJ, Stromstad M, Hansen J, Sander M, Horn K, Ogoh S, Smith ML, Secher NH, Raven PB. Arterial baroreflex control of sympathetic nerve activity during acute hypotension: effect of fitness. Am J Physiol Heart Circ Physiol. 2001;280:H2524–2532. doi: 10.1152/ajpheart.2001.280.6.H2524. [DOI] [PubMed] [Google Scholar]
- Floras JS, Sinkey CA, Aylward PE, Seals DR, Thoren PN, Mark AL. Postexercise hypotension and sympathoinhibition in borderline hypertensive men. Hypertension. 1989;14:28–35. doi: 10.1161/01.hyp.14.1.28. [DOI] [PubMed] [Google Scholar]
- Gallagher KM, Fadel PJ, Stromstad M, Ide K, Smith SA, Querry RG, Raven PB, Secher NH. Effects of exercise pressor reflex activation on carotid baroreflex function during exercise in humans. J Physiol. 2001;533:871–880. doi: 10.1111/j.1469-7793.2001.t01-2-00871.x. [DOI] [PMC free article] [PubMed] [Google Scholar]
- Halliwill JR, Taylor JA, Eckberg DL. Impaired sympathetic vascular regulation in human after acute dynamic exercise. J Physiol. 1996;495:279–288. doi: 10.1113/jphysiol.1996.sp021592. [DOI] [PMC free article] [PubMed] [Google Scholar]
- Head GA, Burke SL. Comparison of renal sympathetic baroreflex effects of rilmenidine and alpha-methylnoradrenaline in the ventrolateral medulla of the rabbit. J Hypertension. 2000;18:1263–1276. doi: 10.1097/00004872-200018090-00013. [DOI] [PubMed] [Google Scholar]
- Jordan D. CNS integration of cardiovacular regulation. In: Jordan D, Marshall J, editors. Cardiovascular Regulation. London: Blackwell Science Inc; 1995. pp. 1–14. [Google Scholar]
- Kajekar R, Chen CY, Mutoh T, Bonham AC. GABA(A) receptor activation at medullary sympathetic neurons contributes to postexercise hypotension. Am J Physiol Heart Circ Physiol. 2002;282:H1615–1624. doi: 10.1152/ajpheart.00725.2001. [DOI] [PubMed] [Google Scholar]
- Kamiya A, Michikami D, Fu Q, Niimi Y, Iwase S, Mano T, Suzumura A. Static handgrip exercise modifies arterial baroreflex control of vascular sympathetic outflow in humans. Am J Physiol Regul Integr Comp Physiol. 2001;281:R1134–1139. doi: 10.1152/ajpregu.2001.281.4.R1134. [DOI] [PubMed] [Google Scholar]
- Kenny GP, Chen AA, Nurbakhsh BA, Denis PM, Proulx CE, Giesbrecht GG. Moderate exercise increases postexercise thresholds for vasoconstriction and shivering. J Appl Physiol. 1998;85:1357–1361. doi: 10.1152/jappl.1998.85.4.1357. [DOI] [PubMed] [Google Scholar]
- Kent BB, Drane JW, Blumenstein B, Manning JW. A mathematical model to assess changes in the baroreceptor reflex. Cardiology. 1972;57:295–310. doi: 10.1159/000169528. [DOI] [PubMed] [Google Scholar]
- Kulics JM, Collins HL, Di Carlo SE. Postexercise hypotension is mediated by reductions in sympathetic nerve activity. Am J Physiol. 1999;276:H27–32. doi: 10.1152/ajpheart.1999.276.1.H27. [DOI] [PubMed] [Google Scholar]
- Liu JL, Murakami H, Zucker IH. Effects of NO on baroreflex control of heart rate and renal nerve activity in conscious rabbits. Am J Physiol. 1996;270:R1361–1370. doi: 10.1152/ajpregu.1996.270.6.R1361. [DOI] [PubMed] [Google Scholar]
- Miki K, Kosho A, Hayashida Y. Method for continuous measurements of renal sympathetic nerve activity and cardiovascular function during exercise in rats. Exp Physiol. 2002;87:33–39. doi: 10.1113/eph8702281. [DOI] [PubMed] [Google Scholar]
- Morris GS, Fitzsimons DP, Baldwin KM, Barnard RJ. Exercise capacity of rats remains unaffected by a chronic pressure overload. Cardiovasc Res. 1993;27:1346–1349. doi: 10.1093/cvr/27.7.1346. [DOI] [PubMed] [Google Scholar]
- Potts JT. Exercise and sensory integration. Role of the nucleus tractus solitarius. Ann N Y Acad Sci. 2001;940:221–236. [PubMed] [Google Scholar]
- Potts JT, Mitchell JH. Rapid resetting of carotid baroreceptor reflex by afferent input from skeletal muscle receptors. Am J Physiol. 1998;275:H2000–2008. doi: 10.1152/ajpheart.1998.275.6.H2000. [DOI] [PubMed] [Google Scholar]
- Potts JT, Shi XR, Raven PB. Carotid baroreflex responsiveness during dynamic exercise in humans. Am J Physiol. 1993;265:H1928–1938. doi: 10.1152/ajpheart.1993.265.6.H1928. [DOI] [PubMed] [Google Scholar]
- Raven PB, Fadel PJ, Smith SA. The influence of central command on baroreflex resetting during exercise. Exerc Sport Sci Rev. 2002;30:39–44. doi: 10.1097/00003677-200201000-00008. [DOI] [PubMed] [Google Scholar]
- Rowell LB, O'Leary DS. Reflex control of the circulation during exercise: chemoreflexes and mechanoreflexes. J Appl Physiol. 1990;69:407–418. doi: 10.1152/jappl.1990.69.2.407. [DOI] [PubMed] [Google Scholar]
- Rowell LB, O'Leary DS, Kellogg DL. Integration of cardiovascular control systems in dynamic exercise. In: Rowell LB, Shepherd JT, editors. Handbook of Physiology, section 12, Exercise: Regulation and Integration of Multiple Systems. New York: Blackwell Science Inc; 1996. [Google Scholar]
- Rudas L, Crossman AA, Morillo CA, Halliwill JR, Tahvanainen KU, Kuusela TA, Eckberg DL. Human sympathetic and vagal baroreflex responses to sequential nitroprusside and phenylephrine. Am J Physiol. 1999;276:H1691–1698. doi: 10.1152/ajpheart.1999.276.5.h1691. [DOI] [PubMed] [Google Scholar]
- Sachs L. Applied Statistics. New York: Blackwell Science Inc; 1982. [Google Scholar]
- Saigusa T, Head GA. Renal sympathetic baroreflex effects of angiotensin II infusions into the rostral ventrolateral medulla of the rabbit. Clin Exp Pharmacol Physiol. 1993;20:351–354. doi: 10.1111/j.1440-1681.1993.tb01703.x. [DOI] [PubMed] [Google Scholar]
- Saigusa T, Iriki M, Arita J. Brain angiotensin II tonically modulates sympathetic baroreflex in rabbit ventrolateral medulla. Am J Physiol. 1996;271:H1015–1021. doi: 10.1152/ajpheart.1996.271.3.H1015. [DOI] [PubMed] [Google Scholar]
- Simon E, Riedel W. Diversity of regional sympathetic outflow in integrative cardiovascular control: patterns and mechanisms. Brain Res. 1975;87:323–333. doi: 10.1016/0006-8993(75)90429-1. [DOI] [PubMed] [Google Scholar]
- Veras-Silva AS, Mattos KC, Gava NS, Brum PC, Negrao CE, Krieger EM. Low-intensity exercise training decreases cardiac output and hypertension in spontaneously hypertensive rats. Am J Physiol. 1997;273:H2627–2631. doi: 10.1152/ajpheart.1997.273.6.H2627. [DOI] [PubMed] [Google Scholar]
- Walgenbach SC, Donald DE. Inhibition by carotid baroreflex of exercise-induced increases in arterial pressure. Circ Res. 1983;52:253–262. doi: 10.1161/01.res.52.3.253. [DOI] [PubMed] [Google Scholar]
- Williamson JW, McColl R, Mathews D, Mitchell JH, Raven PB, Morgan WP. Brain activation by central command during actual and imagined handgrip under hypnosis. J Appl Physiol. 2002;92:1317–1324. doi: 10.1152/japplphysiol.00939.2001. [DOI] [PubMed] [Google Scholar]