

Abstract
We investigated how inhibition of mitochondrial Ca2+ uptake affects transmitter release from mouse motor terminals during brief trains of action potentials (500 at 50 Hz) in physiological bath [Ca2+]. When mitochondrial Ca2+ uptake was inhibited by depolarizing mitochondria with antimycin A1 or carbonyl cyanide m-chlorophenyl-hydrazone, the stimulation-induced increase in cytosolic [Ca2+] was greater (> 10 μm, compared to ≤ 1μm in control solution), the quantal content of the endplate potential (EPP) depressed more rapidly (∼84 % depression compared to ∼8 % in controls), and asynchronous release during the stimulus train reached higher frequencies (peak rates of ∼6000 s−1 compared to ∼75 s−1 in controls). These effects of mitochondrial depolarization were not accompanied by a significant change in EPP quantal content or the rate of asynchronous release during 1 Hz stimulation, and were not seen in oligomycin, which blocks mitochondrial ATP synthesis without depolarizing mitochondria. Inhibition of endoplasmic reticular Ca2+ uptake with cyclopiazonic acid also had little effect on stimulation-induced changes in cytosolic [Ca2+] or EPP amplitude. We hypothesize that the high rate of asynchronous release evoked by stimulation during mitochondrial depolarization was produced by the elevation of cytosolic [Ca2+], and contributed to the accelerated depression of phasic release by reducing the availability of releasable vesicles. During mitochondrial depolarization, the post-tetanic potentiation of the EPP observed under control conditions was replaced by a post-tetanic depression with a slow time course of recovery. Thus, mitochondrial Ca2+ uptake is essential for sustaining phasic release, and thus neuromuscular transmission, during and following tetanic stimulation.
When motor nerve terminals are stimulated repetitively, cytosolic [Ca2+] increases to a plateau amplitude that is maintained as long as stimulation persists (Wu & Betz, 1996; Ravin et al. 1997; David et al. 1998, David & Barrett, 2000; Suzuki et al. 2000). Mitochondrial Ca2+ uptake contributes importantly to limiting the increase in cytosolic [Ca2+], because when this uptake is inhibited by depolarizing the electrical potential across the inner mitochondrial membrane (Ψm), cytosolic [Ca2+] increases to much higher levels during stimulus trains (Tang & Zucker, 1997; David et al. 1998; David & Barrett, 2000; Suzuki et al. 2002). Similar effects of Ψm depolarization on stimulation-induced cytosolic [Ca2+] responses have also been observed in other nerve terminals, neuronal somata and certain secretory cells (Friel & Tsien, 1994; Steunkel, 1994; Werth & Thayer, 1994; White & Reynolds, 1995; Herrington et al. 1996; Sidky & Baimbridge, 1997; Medler & Gleason, 2002). Mitochondrial Ca2+ uptake is passive, mediated by a uniporter in the inner mitochondrial membrane and powered mainly by the Ψm created by the electron transport chain (reviewed in Gunter & Pfeiffer, 1990).
This study investigated how mitochondrial Ca2+ uptake affects quantal transmitter release from mouse motor nerve terminals, using Ψm depolarizing drugs to block this uptake. Previous studies reported that these drugs increase the rate of asynchronous release recorded from resting frog, snake, crayfish and cockroach motor terminals, and increase the quantal content of phasic release evoked by nerve stimulation (Alnaes & Rahamimoff, 1975; Washio, 1982; Molgo & Pecot-Dechavassine, 1988; Zengel et al. 1994; Tang & Zucker, 1997; Calupca et al. 2001). Both of these effects were attributed to an increase in cytosolic [Ca2+], which would be predicted to increase asynchronous release directly, and to increase phasic release by a ‘residual Ca2+’ mechanism such as that postulated to mediate short-term historical processes such as facilitation. However, the studies of phasic release in vertebrate nerve terminals reduced Ca2+ influx into stimulated terminals by using low bath [Ca2+] to prevent muscle contraction. In addition, none of these preceding studies measured asynchronous release during the stimulus train, when the large increase in cytosolic [Ca2+] during Ψm depolarization might be predicted to have its major effect. We present evidence that blocking mitochondrial Ca2+ uptake by Ψm depolarization markedly increases both EPP depression and asynchronous release during 50 Hz stimulation. Therefore, the ability of mitochondria to sequester Ca2+ and thus prevent large increases in cytosolic [Ca2+] is essential to prevent desynchronization of release during repetitive stimulation.
METHODS
Preparation and solutions
In our experiments we used internal oblique neuromuscular preparations dissected from male mice (3–5 months old) that had been killed with 100 % CO2, in accordance with the guidelines of the University of Miami Animal Care and Use Committee. This thin preparation (1–2 muscle layers) was bathed in mammalian saline (mm: NaCl 137, NaHCO3 15, KCl 4, CaCl2 1.8, MgCl2 1.1, glucose 11.2 and Na2 HPO4 0.33, gassed with 95 % O2/5 % CO2) and pinned into a small chamber (0.75 ml volume) with a glass coverslip bottom and silicone rubber walls. Action potentials were elicited by stimulating the motor nerve with brief (0.3 ms) suprathreshold depolarizing pulses delivered via a suction electrode; the resulting muscle contractions demonstrated the viability of the preparation. Muscle contractions were then minimized using one of three techniques. d-tubocurare (1–3 mg l−1), which blocks nicotinic acetylcholine receptors, was used during measurements of cytosolic [Ca2+] transients (Fig. 1A and Fig. 2). During electrophysiological measurements, we either applied μ-conotoxin GIIIA (2–4 μg ml−1), which blocks muscle Na+ channels (Hong & Chang, 1989), or lesioned the ends of the muscle fibre to depolarize its resting potential (cut-muscle technique); these two methods have the advantages of permitting measurement of miniature EPPs (mEPPs) and of not interacting with nicotinic receptors on the motor nerve terminal. Nerve stimulation was applied at 1 Hz throughout the experiment, with trains of 50 Hz for 10 s superimposed. Because post-train mitochondrial [Ca2+] transients decay slowly (David, 1999), repeated stimulus trains were separated by intervals of at least 15 min. The temperature of the preparation during recordings was maintained at ∼26–30 °C, because mitochondrial Ca2+ uptake in mouse preparations is temperature dependent, with more uptake occurring at warmer than at cooler temperatures (David & Barrett, 2000). These were the warmest temperatures at which the preparation remained viable throughout the 1–2 h course of each experiment. These temperatures were achieved by blowing hot air onto the bottom of the experimental chamber, the temperature of which was monitored with a thermistor. The volume of solution in the chamber was kept constant to prevent artefacts due to evaporation. Both cytosolic [Ca2+] transients and electrophysiological recordings were stable under control conditions.
Figure 1. Inhibition of ER Ca2+ uptake has minimal effects on the changes in cytosolic [Ca2+] and in EPP amplitude evoked by a 10 s, 50 Hz stimulus train.

A, changes in cytosolic [Ca2+] evoked in control solution (open circles), 15 min after application of 5 μm cyclopiazonic acid (CPA; open triangles), and 15 min after increasing the concentration of CPA to 25 μm (filled circles). Cytosolic [Ca2+] was calculated from changes in the fluorescence of iontophoretically injected Oregon Green BAPTA 5N, assuming a resting value of 0.1 μm (dashed line, see Methods). B, changes in EPP amplitude (normalized to pre-train EPP amplitude) during and after the stimulus train in control solution (open circles) and after addition of 50 μm CPA (filled circles). Pre-train EPP amplitudes averaged 17.8 ± 1.4 mV in control solution and 12.5 ± 2.2 mV in CPA; this difference did not reach statistical significance (unpaired t test). Data in A are from a single terminal; data in B are averaged from 4–5 terminals in each condition. CPA induced strong muscle contractions within 1–2 min after its application, so measurements were made after these contractions subsided.
Figure 2. Ψm depolarization increases peak cytosolic [Ca2+] in mouse motor nerve terminals during a train of 500 action potentials at 50 Hz.
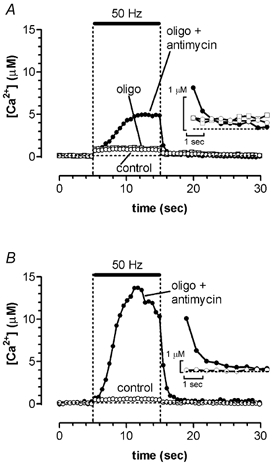
Insets show the initial post-train records on expanded amplitude and time scales. The terminal in A was stimulated in control solution (open circles), 24 min after addition of oligomycin (oligo, 5 μg ml−1, open squares), and 8 min after further addition of antimycin A1 (antimycin, 2 μm, filled circles) to depolarize Ψm. The terminal in B was stimulated in control solution and 19 min after simultaneous application of oligomycin and antimycin A1. The slight decline of cytosolic [Ca2+] towards the end of the train in B may have been due to partial inhibition of terminal Ca2+ currents. Note that the [Ca2+] axis in A and B is compressed relative to that in Fig. 1A. Transients in A were calculated from fluorescence transients in Fig. 5B of David & Barrett (2000).
Ψm was depolarized using either the protonophore carbonyl cyanide m-chlorophenyl-hydrazone (CCCP, 1–2 μm) or antimycin A1 (2 μm), which inhibits complex III of the electron transport chain. Depolarizing Ψm reduces not only the electrical gradient that permits mitochondrial Ca2+ uptake, but also the proton motive force that permits mitochondrial ATP synthesis. In addition, when Ψm is depolarized, the F1, F0 ATP synthetase (complex V) actually operates in reverse mode, hydrolysing ATP and maintaining partial Ψm polarization. To prevent this extra ATP hydrolysis and to ensure complete Ψm depolarization, we inhibited complex V by adding oligomycin (5–10 μg ml−1) to all solutions containing CCCP or antimycin A1. In addition, solutions containing oligomycin alone were tested to measure the effect of inhibiting mitochondrial ATP production without depolarizing Ψm. In some preparations, data were recorded first in control solution, then in oligomycin, and finally in a combination of oligomycin plus a Ψm depolarizing drug (e.g. Fig. 2A). Other preparations were studied in only two of these solutions, first in either control or oligomycin-only solution, and then in the combination of oligomycin plus Ψm depolarizing drug (e.g. Fig. 2B). The duration of exposure to oligomycin was usually 15–45 min, and the duration of Ψm depolarization was 15–20 min.
Results described later show that Ψm depolarizing agents produced clear and prompt effects on cytosolic [Ca2+] responses and transmitter release, but oligomycin alone did not. To test whether the oligomycin was effective and could produce predictable effects in this preparation, we performed the following experiment. Recordings were made from an endplate that had been exposed for 70 min to antimycin alone and had a slightly elevated mEPP frequency (11.7 s−1), suggesting an elevation of cytosolic [Ca2+]. The mitochondria in such terminals would be expected to maintain a partial Ψm (due to the reverse action of the F1, F0 ATP synthetase), enabling them to take up some of the extra cytosolic Ca2+. Addition of oligomycin (8 μg ml−1) to such a preparation would be predicted to completely depolarize Ψm and to release this Ca2+ from mitochondria, thus transiently elevating the mEPP frequency. This effect was indeed observed; the increase in mEPP frequency began within 1 min after oligomycin addition, peaked at ∼250 s−1 after ∼5 min, and then returned to the original frequency within 8 min. This addition of oligomycin had no effect on the average mEPP amplitude (0.48 mV before and 0.49 mV after oligomycin addition). This result indicates that oligomycin was indeed effective at the concentrations and exposure times used here.
We also carried out preliminary experiments with Ru360, a compound purified from ruthenium red that in heart cells blocks uniporter-mediated Ca2+ uptake without depolarizing mitochondria (Matlib et al. 1998). At the 10 μm concentration used by these authors, Ru360 had no effect on EPPs recorded at 1 or 50 Hz. Increasing the concentration to 40 μm produced repetitive discharge of the motor terminal, as evidenced by multiple EPPs recorded in response to a single stimulus applied to the motor nerve. Thus, Ru360 was not used in further experiments.
Fluorescence imaging techniques
Stimulation-evoked changes in spatially averaged cytosolic [Ca2+] were measured by monitoring the emission of Oregon Green BAPTA 5N (OG–5N), injected iontophoretically into an internodal region of the proximal motor axon using techniques described in David & Barrett (2000). The relatively low affinity of OG–5N (Kd∼40–60 μm) ensured minimal disruption of cellular Ca2+-dependent processes and prevented dye saturation at the higher cytosolic [Ca2+] attained during repetitive stimulation with Ψm depolarization. Images were collected using an Odyssey XL confocal microscope (Noran Instruments, Middleton WI, USA), as described in David et al. (1997). Image data were analysed on a Pentium computer using V++ software (Digital Micro Optics, Auckland, New Zealand). Background was subtracted from all fluorescence values, and stimulation-induced fluorescence transients were converted to estimates of cytosolic [Ca2+] as described in David & Barrett (2000), assuming a resting value of 100 nm.
Electrophysiological recordings and analysis
Resting potentials, EPPs and mEPPs were recorded with a 3 m KCl-filled microelectrode (5–20 MΩ) inserted into the muscle fibre in the endplate region, using standard intracellular recording techniques. The prolonged duration of the recordings precluded voltage clamping. mEPPs were detected using the Synaptosoft Mini-Analysis program (Jaejin Software, Leonia, NJ, USA) followed by visual inspection, and average peak amplitudes and resting frequencies were calculated from ∼100 pre-train mEPPs. EPP amplitudes were measured using Clampfit (Axon Instruments, Union City, CA, USA). Quantal content (m) was calculated using an equation from McLachlan & Martin (1981), which incorporates a correction for non-linear summation of the EPP:
where EPPr and mEPPr are the peak amplitudes of the recorded EPP and mEPP, respectively, f is an empirical correction factor set at 0.5, Vm is the resting muscle membrane potential, and Vrev is the reversal potential of the EPP, assumed to be 0 mV (Linder & Quastel, 1978). The correction for non-linear summation is not precise, but errors in this correction would not affect the major conclusions of the study. In Fig. 7, the average rate of phasic release during the train was calculated by dividing m by the interstimulus interval.
Figure 7. During Ψm depolarization, asynchronous release rapidly exceeds phasic release during 50 Hz stimulation.

A, rates of asynchronous (open circles) and phasic (filled circles) release during trains delivered in oligomycin alone (left) and in oligomycin plus CCCP (right) for the terminal of Fig. 6B. Phasic and asynchronous release rates were averaged over each 20 ms interstimulus interval (see text). mEPP frequencies were computed by dividing the voltage × time integral of the baseline depolarization (Fig. 6Ba and b) by the voltage × time integral of the averaged mEPP. Records in control solution (not shown) were similar to those in oligomycin alone. The inset expands the early portion of the response, showing that in CCCP the rate of asynchronous release exceeded the rate of phasic release after ∼1 s of stimulation, and that an increase in the rate of rise of asynchronous release (arrowhead) preceded the onset of the accelerated depression of phasic release (arrow). Four additional terminals (including that in D) exhibited similar behaviour. Dashed lines were drawn by eye through the first 0.5 s of asynchronous and phasic release data. B, cumulative phasic (continuous line) and asynchronous (dashed line) quantal release, calculated from the release rate data in A. In oligomycin, most quanta released during stimulation were phasic (∼15 000 phasic vs. ∼700 asynchronous), whereas during Ψm depolarization most release was asynchronous (∼7800 phasic vs.∼36 000 asynchronous). C, cumulative total quantal release (phasic plus asynchronous) for the data in B. D, rates of asynchronous (open circles) and phasic (filled circles) release during trains in oligomycin plus antimycin, measured in a different terminal. The inset was constructed as in A. Calibration bars for insets in A and D were 2 s and 4000 quanta s−1.
The rate of asynchronous release during the train was estimated using two techniques. The first technique was to count mEPPs occurring during the latter half of each 20 ms interstimulus interval, after the EPP had decayed to near-baseline levels. This technique was reasonably accurate for mEPP frequencies occurring in control and oligomycin-only solutions, where peak frequencies averaged ∼50 s−1 (Fig. 6A), but markedly underestimated mEPP frequencies during trains in Ψm depolarizing solutions, where mEPP frequencies became so high that the baseline during the counting interval was depolarized by several millivolts (see Fig. 6Bb). In this case, mEPP frequencies were calculated using a modification of the technique of Van der Kloot (1990), by measuring the baseline depolarization during the latter half of each 20 ms interstimulus interval, extrapolating this value to the entire interval and correcting for non-linear summation. The voltage × time integral of the mean baseline depolarization was calculated for each interval during the stimulus train, and then divided by the voltage × time integral averaged from ∼100 pre-train mEPPs. This technique is valid only for recordings in which EPPs decayed completely within 10 ms, and the baseline returned to pre-train values following the train. The technique will overestimate mEPP frequency if EPP decays persist for more than 10 ms, and will underestimate mEPP frequency if mEPP voltage × time integrals decrease during the train (Naves & Van der Kloot, 2001).
Figure 6. Ψm depolarization increases asynchronous release during a stimulus train.

A, estimates of asynchronous release rates were obtained by counting mEPPs during the latter half of each 20 ms interstimulus interval. Filled circles indicate counts in oligomycin plus Ψm depolarization during the indicated intervals spanning the first 2 s, middle 2 s and final 2 s of a 10 s stimulus train, and at 1 s intervals after the train. Counts in control solution and in oligomycin alone were similar, and both are indicated by open circles. Each point represents the average of three endplates. Ba and b show voltage recordings encompassing the entire stimulus train, demonstrating a minimal change in baseline in oligomycin alone (Ba), but a marked transient baseline depolarization in oligomycin plus CCCP (dashed line in Bb). Because of this baseline shift, the intra-train mEPP frequencies counted during Ψm depolarization in A underestimate the true asynchronous release rate (see corrected estimates in Fig. 7A). Bc shows representative voltage trajectories recorded during two representative 20 ms interstimulus intervals at times 1–4 indicated in b; note the change in asynchronous release as the train progresses. EPP amplitudes are truncated in all records. Records in B are from one of the terminals averaged in A. In Bc the amplification is greater and the time base is faster than in a and b.
The post-train decay of normalized mEPP frequencies (Fig. 8) was fitted with a double exponential of the form Y =Afexp(−t/τf) +Asexp(−t/τs), where A is the amplitude at time 0, τ is the time constant, and f and s indicate fast and slow components, respectively.
Figure 8. Post-train decays of asynchronous release become similar after 5–10 s.

A, asynchronous release rates were normalized to the pre-train mEPP frequency and then averaged for 7–9 endplates for each condition (means ±s.e.m., note semilogarithmic coordinates). Normalized post-train frequencies were similar in control and oligomycin-only solutions (open symbols), but were greater for the first ∼5 s during Ψm depolarization (filled circles). Comparison of normalized frequencies during the first post-train second yielded P < 0.05 for Ψm depolarization compared to both control and oligomycin alone. B, same data plotted with a double-exponential decay (continuous curves) fitted for each condition. The program used to detect mEPPs is reasonably accurate for the lower mEPP frequencies at later post-train times, but underestimates the higher release rates at early post-train times during Ψm depolarization; thus the first four points in this condition were excluded from the fitted points. Parameters used in the fitted curves (listed in the order: control, oligomycin only and oligomycin plus Ψm depolarization) were 3.4, 8.2 and 685, respectively, for the amplitude of the faster component at t = 0; 4.7, 6.0 and 5.9, respectively, for the amplitude of the slower component at t = 0; 2.5 s, 2.1 s and 1.1 s, respectively for the time constant of the faster component; and 45 s, 40 s and 50 s, respectively for the time constant of the slower component.
Reagents
OG-5N and the styryl dye FM2–10 came from Molecular Probes (Eugene, OR, USA), and μ-conotoxin GIIIA and Ru360 came from Calbiochem (San Francisco, CA, USA) or Alomone Labs (Jerusalem, Israel). All other reagents were from Sigma.
Statistical analysis
The significance of differences between values recorded in control solution, oligomycin alone, and oligomycin plus Ψm depolarizing drug was evaluated using the Student-Newman-Keuls multiple comparisons test.
RESULTS
Stimulation-induced elevations of cytosolic [Ca2+] are increased more by Ψm depolarization than by inhibition of endoplasmic reticulum (ER) Ca2+ uptake
Ca2+ entering motor terminals might be sequestered by active transport into the ER and/or by uniporter-mediated passive influx into the mitochondria. Figure 1A plots the increase in average cytosolic [Ca2+] produced in mouse motor terminals by a train of 500 action potentials delivered at 50 Hz under control conditions and after inhibition of ER Ca2+ uptake with cyclopiazonic acid (CPA, 5–25 μm). These [Ca2+] transients were calculated from changes in fluorescence of iontophoretically injected OG-5N, as described in Methods. Under control conditions, cytosolic [Ca2+] increased rapidly during the initial portion of the stimulus train, and more slowly thereafter, with a final amplitude that remained at submicromolar levels. Following the train there was a rapid initial decay, followed by a slowly decaying residual tail of elevated [Ca2+]. This residual tail was not studied further, because it would be better resolved by indicators with a higher Ca2+ affinity than the OG-5N used here. CPA slightly increased the stimulation-induced elevation of cytosolic [Ca2+], but the final amplitude remained at submicromolar levels.
The experiment depicted in Fig. 1B tested the effect of CPA on averaged EPP amplitudes recorded during and following a similar stimulus train. EPP amplitudes were normalized to the pre-train EPP amplitude. During the 50 Hz train, the EPP amplitude decreased only slightly, and following the train there was a post-tetanic potentiation (PTP) that decayed slowly. Hong & Chang (1989) likewise reported minimal EPP depression in a mouse phrenic nerve-diaphragm preparation that had been paralysed using μ-conotoxin GIIIA, in contrast to the more marked EPP rundown measured in repetitively stimulated mouse and rat neuromuscular preparations that had been paralysed with tubocurare (Hubbard et al. 1969; Hubbard & Wilson, 1973; Magleby et al. 1981). Application of CPA had no significant effect on the pattern of EPP changes, leading us to conclude that ER Ca2+ uptake had little effect on the phasic release evoked by this brief stimulus train.
Figure 2A shows that the stimulation-induced increase in cytosolic [Ca2+] was not altered by a 24 min exposure to oligomycin (5 μg ml−1, open squares), which inhibits mitochondrial ATP synthesis but does not by itself depolarize Ψm. However, when Ψm was depolarized by antimycin A1 (2 μm) combined with oligomycin, the increase in cytosolic [Ca2+] was much larger (see also David & Barrett, 2000). Its rate of rise and final level increased with increasing duration of exposure to antimycin (8 min in Fig. 2A, 19 min in Fig. 2B). Similar changes were measured when Ψm was depolarized with CCCP (not shown), except that the effects of CCCP were partially reversible, whereas those of antimycin A1 were not. The measurements of transmitter release during Ψm depolarization reported below were made typically after at least 15 min of exposure to these agents, and thus were expected to be accompanied by cytosolic [Ca2+] changes comparable to that shown in Fig. 2B. The fact that [Ca2+] responses recorded in oligomycin alone were indistinguishable from those recorded in control solution (Fig. 2A), combined with the independent evidence of oligomycin's effectiveness presented in Methods, indicate that the illustrated increases in [Ca2+] were due mainly to Ψm depolarization rather than to inhibition of mitochondrial ATP synthesis.
After the train, the elevated cytosolic [Ca2+] during Ψm depolarization decayed to values indistinguishable from those recorded in control solution within 5 s (insets in Fig. 2). Studies using higher-affinity [Ca2+] indicators have presented evidence that Ca2+ extrusion from mitochondria contributes to the slowly decaying tail of residual cytosolic [Ca2+] (Friel & Tsien, 1994; Tang & Zucker, 1997) via secondary active transport (e.g. mitochondrial Na+-Ca2+ exchanger, reviewed in Gunter & Pfeiffer, 1990).
Ψm depolarization accelerates depression of phasic release during 50 Hz stimulation
Figure 3 plots representative EPP amplitudes at the beginning and end of a 50 Hz, 500 stimulus train delivered in control solution (A) and during Ψm depolarization with CCCP (B). EPP amplitudes at the beginning of the train were similar under both conditions. However, by the end of the train there was a marked difference: EPPs remained near pre-train levels under control conditions, but were much smaller during Ψm depolarization. At the end of the train there was more asynchronous release during Ψm depolarization than under control conditions, as will be described later.
Figure 3. Ψm depolarization increases depression of phasic release during 50 Hz stimulation.

A, five EPPs recorded at the onset (1–5, left) and end (496–500, right) of the stimulus train, illustrating minimal depression in control solution. B, first five and last five EPPs recorded in another fibre in 5 μg ml−1 oligomycin plus 2 μm CCCP, showing marked depression and an increase in asynchronous release. EPPs recorded in oligomycin alone were similar to controls (not shown, but see Fig. 4).
Most treatments that accelerate the depression of phasic release during repetitive stimulation also increase pre-train (baseline) phasic release. However, the averaged data given in Table 1 demonstrate that this was not the case for the increased EPP depression recorded during Ψm depolarization. For the brief (< 1 h) exposure times used here, neither oligomycin alone nor the combination of oligomycin with a Ψm depolarizing agent had any significant effect on EPP amplitude or on quantal contents calculated during the pre-train period. Average pre-train quantal contents ranged from 27 to 35. Brief exposure to Ψm depolarizing agents also had no significant effect on muscle resting potentials, mEPP amplitude or mEPP frequency (Table 1), although more prolonged exposure to these agents eventually depolarized the muscle resting potential, increased mEPP frequency and abolished phasic release (not shown).
Table 1.
Effects of oligomycin and Ψm depolarization on pre-train values and depression
| Control | Oligo only | Oligo +Ψm depol | |
|---|---|---|---|
| Resting potentials (mV) | −59.0 ± 3.5 | −56.3 ± 4.7 | −50.9 ± 4.3 |
| EPP amplitudes, uncorrected (mV) | 15.6 ± 2.0 | 15.3 ± 2.4 | 14.4 ± 3.6 |
| mEPP amplitude (mV) | 0.56 ± 0.06 | 0.66 ± 0.14 | 0.62 ± 0.08 |
| mEPP frequency (s−1) | 2.16 ± 0.57 | 6.89 ± 2.83 | 4.24 ± 2.69 |
| EPP quantal content | 35.0 ± 4.8 | 32.1 ± 5.7 | 26.7 ± 4.9 |
| Depression index | 0.92 ± 0.11 | 1.13 ± 0.18 | 0.16 ± 0.08* |
Means ± s.e.m. for 8-11 endplates, calculated as described in Methods. Oligo, oligomycin. Ψm depolarization was achieved with CCCP or antimycin Al. Uncorrected EPP amplitudes were not corrected for non-linear summation. EPP quantal contents were calculated after correction for non- linear summation. The depression index is the average quantal content of the last 10 EPPs in the train (50 Hz, 10 s) divided by the average quantal content of 10 pre-train EPPs (as in Fig. 4B). *Significant difference from both control and oligomycin only. None of the pre-train values in oligomycin alone or in oligomycin plus Ψm depolarization was significantly different from control. In resting cells, [Ca2+] in the mitochondrial matrix is low, so brief (< 30 min) Ψm depolarizations would not be expected to elevate cytosolic [Ca2+] or mEPP frequency.
Figure 4A plots quantal contents before, during and after the stimulus train, averaged for 8–11 terminals in control solution, oligomycin alone and oligomycin plus Ψm depolarization. Control and oligomycin-only solutions yielded the same pattern of EPP amplitude changes, namely minimal depression during the stimulus train, with a slight but prolonged PTP thereafter. During Ψm depolarization, the pronounced depression of phasic release was followed by a prolonged post-train depression lasting > 40 s. The similarity between phasic release patterns measured in control and oligomycin-only solutions demonstrates that the pronounced intra- and post-train depression of phasic release recorded during Ψm depolarization was due mainly to mitochondrial depolarization rather than to inhibition of mitochondrial ATP synthesis.
Figure 4. Ψm depolarization increases tetanic depression and eliminates post-tetanic potentiation of phasic release.

A, time course of changes in average EPP quantal content during and after a 50 Hz stimulus train in control solution (open circles, left), oligomycin (oligo, open squares, middle) or oligomycin plus a Ψm depolarizing agent (oligo + depol with either 1–2 μm CCCP or antimycin A1, filled circles, right), averaged for 8–11 endplates for each condition. The duration of exposure to oligomycin was 15–45 min, and the duration of Ψm depolarization was 15–20 min. B left, average of quantal contents (m) that had been normalized to pre-train values, for the data in A. B right, onset of the stimulus train plotted on a faster time scale to show the delayed onset of the accelerated EPP depression associated with Ψm depolarization. Quantal contents were calculated as described in Methods. The pre-train quantal content was averaged from 10–20 EPPs recorded during 1 Hz stimulation prior to the 50 Hz train. Horizontal bars indicate the timing of the 50 Hz stimulus train, and error bars show ±s.e.m. Dashed lines indicate pre-train quantal content.
Historical processes are traditionally calculated as the percent change from pre-train values. Thus in Fig. 4B (left), the quantal content of each endplate was normalized to its pre-train value prior to calculating the average. The normalized patterns resemble those shown in Fig. 4A, except that the average magnitude of depression in the control and oligomycin-only solutions is less in the normalized records. This difference arises because endplates with higher initial quantal contents, which tended to exhibit greater EPP depression, contribute more to the averages plotted in Fig. 4A than to the normalized ratios seen in Fig. 4B. Thus we consider the normalized data to reflect better the frequency-induced changes in synaptic efficacy. These data were used to calculate the depression index listed in Table 1, indicating an average depression of ∼8 % in control solution and ∼84 % during Ψm depolarization. Depression was similar whether CCCP or antimycin A1 was used to depolarize Ψm (not shown). Quantal content in oligomycin alone showed a slight potentiation (13 %) during the train (neither the slight depression in control solution nor the slight potentiation in oligomycin alone was statistically significant). Figure 4B (right) plots normalized quantal contents at the onset of the stimulus train, demonstrating that the extra depression associated with Ψm depolarization developed with a delay, about 1–1.5 s (50–75 action potentials) following the onset of stimulation.
Several findings indicate that the accelerated EPP depression during stimulation with Ψm depolarization was not due to failure of action potentials to invade the motor terminal. First, in many Ψm depolarized preparations, EPPs continued to be detected throughout the stimulus train (Fig. 3). Second, cytosolic [Ca2+], which normally falls rapidly when stimulation ceases, remained elevated until the end of the stimulus train. Also, when Ψm depolarizing agents were applied to frog and lizard neuromuscular junctions in reduced bath [Ca2+], EPP amplitudes increased rather than decreased during repetitive stimulation (Alnaes & Rahamimoff, 1975; Zengel et al. 1994; Talbot et al. 2003), indicating that brief Ψm depolarization does not by itself block action potential propagation. The latter results also argue that the EPP depression measured in physiological bath [Ca2+] did not result from toxic organic molecules released into the cytosol by Ψm depolarization per se.
To test the possibility that the increased EPP depression was caused (directly or indirectly) by the larger stimulation-induced increase in cytosolic [Ca2+] during Ψm depolarization, we loaded terminals with an exogenous Ca2+ buffer, EGTA. Figure 5 shows that in terminals preloaded with EGTA prior to Ψm depolarization, the onset of EPP depression was delayed, although the final magnitude of the depression was similar to that measured in Ψm-depolarized terminals that had not been pre-loaded (see Discussion).
Figure 5. Pre-loading with an exogenous Ca2+ buffer delays the onset, but does not alter the final magnitude, of EPP depression in Ψm depolarized terminals.

Changes in normalized EPP amplitude during the stimulus train are plotted for terminals not pre-loaded (open circles) or pre-loaded with EGTA (filled circles) via a 2 h incubation in 15 μm EGTA-AM. In each case Ψm depolarization was achieved by a 20 min exposure to antimycin (2 μm) and oligomycin (5 μg ml−1). Plots show the average of 2 terminals in each condition.
PTP is absent during Ψm depolarization
Our finding that during Ψm depolarization the stimulus train was followed by a prolonged depression instead of potentiation is consistent with the hypothesis of Tang & Zucker (1997) that PTP is mediated by mitochondrial extrusion into the cytosol of Ca2+ taken up during the stimulus train, and with the finding of Hubbard & Gage (1964) that antimycin A and azide (both of which depolarize Ψm) abolish PTP at rat neuromuscular junctions. However, our data cannot distinguish whether the absence of PTP during Ψm depolarization was due to abolition of the underlying mechanism(s) or to masking of PTP by the profound depression of phasic release following the stimulus train.
During Ψm depolarization, high-frequency stimulation greatly increases asynchronous release
The spatially averaged cytosolic [Ca2+] elevations shown in Fig. 1A and Fig. 2 do not, of course, measure the localized, transient elevations of [Ca2+] near release sites that produce phasic release, but these averaged [Ca2+] measurements are predicted to correlate with the rate of asynchronous release. As indicated in Methods, one way used to measure asynchronous release was to count mEPPs during the intervals between the end of the EPP and the onset of the next stimulus; representative interstimulus intervals during Ψm depolarization are shown in Fig. 6Bc. Figure 6A plots average rates of asynchronous release measured in this way during the first 2 s, middle 2 s and final 2 s of the stimulus train for a subset of three terminals that had the best signal-to-noise ratio for detecting mEPPs. In control solution and oligomycin alone (both plotted as open circles), average mEPP frequencies increased from < 7 s−1 at rest to a maximum of ∼75 s−1 during the stimulus train. In contrast, when Ψm was depolarized (filled circles), asynchronous release rose to much higher levels during stimulation, reaching a peak and then declining somewhat towards the end of the train. Such reductions in asynchronous release under conditions expected to elevate cytosolic [Ca2+] to very high levels have also been reported by Ohta & Kuba (1980) and Calupca et al. (2001). The maximal mEPP frequencies measured in this way (> 500 s−1) exceeded the frequencies that can be counted accurately with the Synaptosoft program or by eye, leading us to suspect that the true peak mEPP frequencies might be even greater. Indeed, the record in Fig. 6Bb shows a significant transient baseline depolarization during stimulation in CCCP (white dashed line), suggesting that the mEPP counts in Fig. 6A represented only a fraction of the total. No such baseline depolarization was seen in oligomycin alone (Fig. 6Ba).
The open circles in Fig. 7A plot a revised estimate of the rates of asynchronous release that occurred during the train illustrated in Fig. 6B, calculated by integrating the baseline depolarization as described in Methods. Again, records in oligomycin alone (left) indicated only modest asynchronous release during the train, but during CCCP-induced Ψm depolarization (right), mEPP frequencies exceeding 6000 s−1 were measured within 2–3 s following the onset of stimulation. Figure 7D shows a similar peak rate and time course of asynchronous release measured in another Ψm depolarized terminal. Peak rates of asynchronous release approaching those in Fig. 7A and D have also been reported in frog and mouse motor terminals treated with black widow spider venom or lanthanum (5000 s−1, Segal et al. 1984; 1500 s−1, Fesce et al. 1986; 1000 s−1, Curtis et al. 1986). The pattern of changes in asynchronous release obtained with the integral method in Fig. 7A and D was qualitatively similar to that measured with the mEPP counting method in Fig. 6A, since in both cases the rate of asynchronous release peaked and then declined during the latter half of the stimulus train, but peak release rates calculated using the integral method were > 10-fold greater, around 6000 s−1. Even at the end of the train, mEPP frequency during Ψm depolarization was greater than that measured in oligomycin alone. The decline in mEPP frequency towards the end of the train occurred even though cytosolic [Ca2+] remained elevated throughout the train (Fig. 2).
Filled circles in Fig. 7A plot the rate of phasic (synchronous) release during the train, calculated from EPP quantal content. For this analysis, the rate of phasic release was averaged over the 20 ms interstimulus interval, to facilitate comparison of phasic and asynchronous release rates. For example, an EPP comprising 30 quanta occurring within a 20 ms interstimulus interval would yield an average rate of phasic release of (30/(2 × 10−2) s−1) = 1500 quanta s−1 for that interval. This calculation underestimates the peak rate of phasic release, most of which occurs within 1 ms, yielding for the above example a peak rate of 30 000 quanta s−1. The insets in Fig. 7A and D show that in Ψm depolarized terminals, the rate of asynchronous release grew to exceed the rate of phasic release within 1 s after the onset of 50 Hz stimulation. A sharp increase in the rate of rise of asynchronous release was detected ∼0.5 s before the onset of the accelerated depression of phasic release.
Figure 7B plots cumulative phasic (continuous line) and asynchronous (dashed line) release rates for the data of Fig. 7A, demonstrating that during Ψm depolarization, most of the quanta released during the stimulus train were asynchronous, whereas in oligomycin alone (as in control solution), most of the release was phasic. Figure 7C plots total release (phasic plus asynchronous) for this terminal, demonstrating that during Ψm depolarization there was more total release (∼44 000 quanta) than in oligomycin alone (∼16 000 quanta). Thus, even though phasic release was diminished during Ψm depolarization, total release was increased.
Because electrophysiological measurements of the high asynchronous release rates in Ψm depolarized terminals were inexact, we sought to check our estimates by using destaining of styryl dyes to measure total vesicular release during stimulus trains in the three experimental solutions studied here. However, repeated attempts to make these measurements in mouse motor terminals were unsuccessful, probably due to phototoxicity and to the small signal-to-noise ratio for the brief stimulus trains used here. Measurements of FM2–10 destaining in lizard motor terminals proved more successful, and did show higher cumulative total release during 50 Hz stimulation with Ψm depolarization (Talbot et al. 2003).
During Ψm depolarization, post-train asynchronous release rates return to control levels within 10 s
Figure 8A plots on semi-logarithmic coordinates the post-train mEPP frequencies (normalized to pre-train frequencies) averaged for 7–9 terminals in control solution, oligomycin alone or in oligomycin with Ψm depolarization. In control solution and oligomycin alone (represented by open circles and squares, respectively), normalized post-train mEPP frequencies were similar, exhibiting a slow decline towards baseline that lasted > 50 s. During Ψm depolarization (filled circles), post-train mEPP frequencies were initially much higher, but within 10 s became indistinguishable from those in control solution. This rapid decline in mEPP frequency may reflect the rapid post-train decay of cytosolic [Ca2+] measured during Ψm depolarization (Fig. 2). Figure 8B shows the same data fitted with double exponentials. This analysis omitted the high mEPP frequencies measured during the first four post-train seconds with Ψm depolarization, which are likely to underestimate the true mEPP frequency (see above). Extrapolation of the faster exponential to the end of the train yielded an estimated 685-fold increase above resting frequencies. The estimated slow time constant of decay was similar for all three experimental conditions, in the range of 40–50 s.
DISCUSSION
High rates of asynchronous release during stimulation of Ψm depolarized terminals can be accounted for by increased cytosolic [Ca2+]
Motor nerve terminals, other presynaptic terminals and secretory cells have release mechanisms that are activated when cytosolic [Ca2+] is elevated to ∼10 μm or less (Augustine & Neher, 1992; Rieke & Schwartz, 1996; Ravin et al. 1997; Bollmann et al. 2000; Schneggenburger & Neher, 2000; Angleson & Betz, 2001). These mechanisms are thought to contribute to asynchronous and sometimes phasic release, as well as to historical Ca2+-dependent processes such as facilitation, augmentation and PTP (reviewed in Zucker & Regehr, 2001). The large increases in cytosolic [Ca2+] evoked by stimulus trains during Ψm depolarization would be expected to activate these release mechanisms. Our measurements of asynchronous release support this prediction, since during 50 Hz stimulation in control and oligomycin-only solutions, both cytosolic [Ca2+] (Fig. 2A) and asynchronous release (Fig. 6A) rose to similar plateau levels that were sustained until stimulation stopped. Also, the larger increase in cytosolic [Ca2+] recorded during stimulation with Ψm depolarization was accompanied by higher rates of asynchronous release both during and immediately after stimulation.
To investigate whether the increase in cytosolic [Ca2+] during stimulation with Ψm depolarization was sufficient to account for the magnitude of the increase in asynchronous release, we compared the plateau values of cytosolic [Ca2+] and asynchronous release rates measured during stimulation in control and oligomycin-only conditions (∼0.7 μm Ca2+ from David & Barrett, 2000; ∼75 s−1 from Fig. 6A) to the [Ca2+] and peak asynchronous release rates measured during Ψm depolarization (∼7μm Ca2+ at 3 s after the onset of stimulation in Fig. 2B, 6000 s−1 in Fig. 7A and D). Assuming no saturation, the 10-fold increase in cytosolic [Ca2+] (from 0.7 to 7 μm) could account for the 80-fold increase in release rate (from 75 to 6000 s−1) if the power of the relationship linking [Ca2+] and release were at least 2, consistent with powers of 1–4 estimated for asynchronous release in other synaptic preparations (Goda & Stevens, 1994; Ravin et al. 1997; Angleson & Betz, 2001). If instead one assumes a power of 4, these data suggest a Kd of ∼2μm. Note, however, that the pairing of the values used for cytosolic [Ca2+] and asynchronous release during Ψm depolarization is only speculative, because these measurements were in different terminals, and the magnitude of the stimulation-induced increase in cytosolic [Ca2+] varied with the duration of Ψm depolarization.
The accelerated depression of phasic release measured during Ψm depolarization has an unconventional mechanism
Most treatments that accelerate the rate of EPP depression during high-frequency stimulation also increase the ‘baseline’ quantal content recorded during low-frequency stimulation. In these cases, a suggested mechanism for the accelerated depression is that the greater initial phasic release depletes the releasable vesicle pool more rapidly. In contrast, Ψm depolarization accelerated EPP depression without increasing pre-train quantal content. The minimal effects of brief (< 30 min) Ψm depolarization on nerve terminal function at rest and during 1 Hz stimulation suggests no initial effect on Ca2+ influx through voltage-dependent Ca2+ channels or on access of this incoming Ca2+ to release sites. This finding is consistent with morphological evidence that in these terminals mitochondria are separated from active zone Ca2+ channels by clusters of synaptic vesicles (Lichtman et al. 1989).
The minimal effects of oligomycin on cytosolic [Ca2+] transients, asynchronous release and EPP depression suggest that the enhanced EPP depression was not due primarily to the inhibition of mitochondrial ATP synthesis produced by Ψm depolarization. When mitochondrial ATP synthesis is inhibited, the ATP required to maintain release might be supplied by glycolysis. Motor nerve terminals might be predicted to have a significant capacity for anaerobic ATP synthesis, since neuromuscular transmission is maintained even in the hypoxic environment of an intensely contracting muscle. ATP might also diffuse into the terminal from the axon, since the perineural and myelin sheaths (which envelop axons but not terminals) would limit the access of bath-applied oligomycin to the axon.
The enhanced EPP depression was not due to progressive desensitization of postsynaptic acetylcholine receptors, because mEPPs continued to be detected throughout the stimulus train (see also Calupca et al. 2001).
The most likely possibility is that the enhanced EPP depression seen during Ψm depolarization was linked to the increased accumulation of cytosolic [Ca2+] (Fig. 2). The finding that pre-loading terminals with EGTA delayed the onset, but did not alter the final magnitude, of the EPP depression during Ψm depolarization (Fig. 5) is consistent with this hypothesis. EGTA would slow the rate of rise of cytosolic [Ca2+] during stimulation, but would eventually become saturated as Ca2+ continued to enter the terminal (e.g. Cummings et al. 1996). EGTA (Kd∼0.3 μm) becomes a relatively ineffective buffer at the high cytosolic [Ca2+] attained during 50 Hz stimulation with Ψm depolarization (5–14 μm in Fig. 2). Those studies in which pre-loaded Ca2+ buffer blocked most of the postulated effects of residual Ca2+ used many fewer stimuli than our study (e.g. only 4–20 stimuli in Hagler & Goda, 2001; Billups & Forsythe, 2002).
High rates of asynchronous release during 50 Hz stimulation with Ψm depolarization probably deplete the readily releasable pool
Measurements of asynchronous release suggested one mechanism contributing to the accelerated EPP depression. During 50 Hz stimulation of Ψm depolarized terminals, a marked increase in the rate of rise of asynchronous release preceded the acceleration of EPP depression, such that the rate of asynchronous release soon exceeded the time-averaged rate of phasic release (insets in Fig. 7A and D). Our estimate of ∼44 000 total quanta (phasic plus asynchronous) released from Ψm depolarized terminals during a 500 impulse train can be compared to the electrophysiological estimate of Schofield & Marshall (1980) of ∼174 000 total quanta in mouse diaphragm terminals; estimates of total quanta in larger rat motor terminals range from 69 000 to 366 000, as cited in Reid et al. (1999). Richards et al. (2000) estimated that in frog motor nerve terminals, about 20 % of total vesicles are readily releasable. Assuming that the same percentage applies to mouse motor terminals, our data suggest that the total release evoked by a train of 500 action potentials in Ψm depolarized preparations approached or exceeded the limits of the readily releasable pool. This is because during the train there was not only a decrease in phasic release, but also (towards the end of the train) a decrease in asynchronous release from its peak level, even though cytosolic [Ca2+] remained high. In the terminals studied in detail, asynchronous release peaked after about ∼3 s of stimulation, when about 20 000 total quanta had been released. Thus, if phasic and asynchronous release share the same readily releasable pool (Hagler & Goda, 2001), it seems likely that depletion of this pool contributed importantly to the rapid depression of EPP amplitudes during stimulation of Ψm depolarized preparations. Increased asynchronous release might also depress phasic release during the train via a mechanism proposed for central synapses in vitro by Stevens & Tsujimoto (1995), in which release from an active zone suppresses further release from that zone for ∼10 ms. This latter mechanism could not, however, account for the long-lasting (> 40 s) post-train depression measured during Ψm depolarization, since most of the post-train elevation of mEPP frequency had decayed within 5 s.
Mechanisms in addition to depletion might also contribute to the accelerated depression of phasic release measured during stimulation when Ψm was depolarized. For example, the increased total release during Ψm depolarization might inhibit phasic release by activating inhibitory autoreceptors (reviewed by Wu & Saggau, 1997). The large elevation of cytosolic [Ca2+] might inhibit activation of the P/Q-type Ca2+ channels that mediate phasic release from these terminals (Forsythe et al. 1998; DeMaria et al. 2001). Prolonged elevations of cytosolic [Ca2+] might also inhibit phasic release by producing ‘adaptation’ of the release mechanism (Adams et al. 1985; Augustine & Neher, 1992; Hsu et al. 1996) or by activating Ca2+-dependent enzymes (e.g. a Ca2+-calmodulindependent kinase).
The increased total release during stimulation with Ψm depolarization probably contributes to the slow recovery from depression
The large increase in total quantal release during stimulation of Ψm depolarized preparations probably also contributed to their slow (> 40 s) post-train recovery from depression. Studies in both peripheral and central synapses indicate that high preceding release rates slow the rate at which vesicular membrane is recovered by endocytosis (Wu & Betz, 1996, 1998; Sun et al. 2002). The post-train recovery from depression in Ψm depolarized preparations was slower than recovery of cytosolic [Ca2+], which had recovered to near-baseline levels within < 5 s after the train. Thus, any influence of elevated [Ca2+] on the slowed post-train recovery during Ψm depolarization was likely to have been indirect, with a delayed time course. Billups & Forsythe (2002) found that agents that block mitochondrial Ca2+ uptake also slowed recovery from depression of phasic release in the calyx of Held. However, in their preparation, Ψm depolarization was not associated with enhanced depression of phasic release or increased cytosolic [Ca2+] transients during the stimulus train. One likely reason for the difference between our and their results is that they used stimulus trains (16–20 depolarizations within < 0.5 s) that were much briefer than those applied here. The increased EPP depression and cytosolic [Ca2+] transients that we measured during Ψm depolarization usually became apparent only after ∼1 s of 50 Hz stimulation. Another noteworthy difference is that unlike release from mouse motor terminals, phasic release from the calyx of Held depressed rapidly (90 % depression after five stimuli at 200 Hz), even under control conditions.
Mitochondrial Ca2+ sequestration has a greater effect than ER Ca2+ sequestration
For the stimulation pattern employed here, inhibition of mitochondrial Ca2+ uptake had a much greater effect on the elevation of cytosolic [Ca2+] and on phasic release than inhibition of Ca2+ transport into the ER. This finding is similar to that reported for stimulation-induced [Ca2+] elevations in crayfish, lizard and frog motor nerve terminals (Tang & Zucker, 1997; David, 1999; Suzuki et al. 2002). Carter et al. (2002) and Billups & Forsythe (2002) also reported that blocking ER Ca2+ uptake and/or Ca2+-induced Ca2+ release had little effect on short-term pre-synaptic plasticity at certain mammalian central synapses. Drugs that inhibit ER Ca2+ uptake or release have been reported to alter phasic and asynchronous transmitter release in frog motor nerve terminals (Narita et al. 1998, 2000; Castonguay & Robitaille, 2001), but demonstration of these effects required preconditioning stimulation.
Conclusions
The diagram in Fig. 9 summarizes the hypothesized relationship between stimulation-induced elevations of cytosolic [Ca2+] and phasic and asynchronous release, under normal conditions (left) and following Ψm depolarization (right). In this model, the large increase in cytosolic [Ca2+] measured during 50 Hz stimulation when Ψm is depolarized produces a dramatic increase in asynchronous release, which in turn accelerates EPP depression by depleting the readily releasable pool. Our results indicate that the ability of motor terminal mitochondria to limit the increase in average cytosolic [Ca2+] is essential for maintaining phasic release, and hence faithful neuromuscular transmission, during high-frequency stimulation.
Figure 9. Consequences of 50 Hz stimulation under control conditions (left) and during Ψm depolarization (right).

Dashed lines indicate the more tentative or indirect connections.
Acknowledgments
We thank Dr John Barrett for reading drafts of this manuscript and Janet Talbot for permission to cite unpublished results. Supported by NIH NS 12404.
references
- Adams DJ, Takeda K, Umbach JA. Inhibitors of calcium buffering depress evoked transmitter release at the squid giant synapse. J Physiol. 1985;369:145–159. doi: 10.1113/jphysiol.1985.sp015893. [DOI] [PMC free article] [PubMed] [Google Scholar]
- Alnaes E, Rahamimoff R. On the role of mitochondria in transmitter release from motor nerve terminals. J Physiol. 1975;248:285–306. doi: 10.1113/jphysiol.1975.sp010974. [DOI] [PMC free article] [PubMed] [Google Scholar]
- Angleson JK, Betz WJ. Intraterminal Ca2+ and spontaneous transmitter release at the frog neuromuscular junction. J Neurophysiol. 2001;85:287–294. doi: 10.1152/jn.2001.85.1.287. [DOI] [PubMed] [Google Scholar]
- Augustine GJ, Neher E. Calcium requirements for secretion in bovine chromaffin cells. J Physiol. 1992;450:247–271. doi: 10.1113/jphysiol.1992.sp019126. [DOI] [PMC free article] [PubMed] [Google Scholar]
- Billups B, Forsythe ID. Presynaptic mitochondrial calcium sequestration influences transmission at mammalian central synapses. J Neurosci. 2002;22:5840–5847. doi: 10.1523/JNEUROSCI.22-14-05840.2002. [DOI] [PMC free article] [PubMed] [Google Scholar]
- Bollmann JH, Sakmann B, Borst JG. Calcium sensitivity of glutamate release in a calyx-type terminal. Science. 2000;289:953–957. doi: 10.1126/science.289.5481.953. [DOI] [PubMed] [Google Scholar]
- Calupca MA, Prior C, Merriam LA, Hendricks GM, Parsons RL. Presynaptic function is altered in snake K+-depolarized motor nerve terminals containing compromised mitochondria. J Physiol. 2001;532:217–227. doi: 10.1111/j.1469-7793.2001.0217g.x. [DOI] [PMC free article] [PubMed] [Google Scholar]
- Carter AG, Vogt KE, Foster KA, Regehr WG. Assessing the role of calcium-induced calcium release in short-term presynaptic plasticity at excitatory central synapses. J Neurosci. 2002;22:21–28. doi: 10.1523/JNEUROSCI.22-01-00021.2002. [DOI] [PMC free article] [PubMed] [Google Scholar]
- Castonguay A, Robitaille R. Differential regulation of transmitter release by presynaptic and glial Ca2+ internal stores at the neuromuscular synapse. J Neurosci. 2001;21:1911–1922. doi: 10.1523/JNEUROSCI.21-06-01911.2001. [DOI] [PMC free article] [PubMed] [Google Scholar]
- Cummings DD, Wilcox KS, Dichter MA. Calcium-dependent paired-pulse facilitation of miniature EPSC frequency accompanies depression of EPSCs at hippocampal synapses in culture. J Neurosci. 1996;16:5312–5323. doi: 10.1523/JNEUROSCI.16-17-05312.1996. [DOI] [PMC free article] [PubMed] [Google Scholar]
- Curtis MJ, Quastel DMJ, Saint DA. Lanthanum as a surrogate for calcium in transmitter release at mouse motor nerve terminals. J Physiol. 1986;373:243–260. doi: 10.1113/jphysiol.1986.sp016045. [DOI] [PMC free article] [PubMed] [Google Scholar]
- David G. Mitochondrial clearance of cytosolic Ca2+ in stimulated lizard motor nerve terminals proceeds without progressive elevation of mitochondrial matrix [Ca2+] J Neurosci. 1999;19:7495–7506. doi: 10.1523/JNEUROSCI.19-17-07495.1999. [DOI] [PMC free article] [PubMed] [Google Scholar]
- David G, Barrett EF. Stimulation-evoked increases in cytosolic [Ca2+] in mouse motor nerve terminals are limited by mitochondrial uptake and are temperature-dependent. J Neurosci. 2000;20:7290–7296. doi: 10.1523/JNEUROSCI.20-19-07290.2000. [DOI] [PMC free article] [PubMed] [Google Scholar]
- David G, Barrett JN, Barrett EF. Stimulation-induced changes in [Ca2+] in lizard motor nerve terminals. J Physiol. 1997;504:83–96. doi: 10.1111/j.1469-7793.1997.083bf.x. [DOI] [PMC free article] [PubMed] [Google Scholar]
- David G, Barrett JN, Barrett EF. Evidence that mitochondria buffer physiological Ca2+ loads in lizard motor nerve terminals. J Physiol. 1998;509:59–65. doi: 10.1111/j.1469-7793.1998.059bo.x. [DOI] [PMC free article] [PubMed] [Google Scholar]
- DeMaria CD, Soong TW, Alseikhan BA, Alvania RS, Yue DT. Calmodulin bifurcates the local Ca2+ signal that modulates P/Q-type Ca2+ channels. Nature. 2001;411:484–489. doi: 10.1038/35078091. [DOI] [PubMed] [Google Scholar]
- Fesce R, Segal JR, Ceccarelli B, Hurlbut WP. Effects of black widow spider venom and Ca2+ on quantal secretion at the frog neuromuscular junction. J Gen Physiol. 1986;88:59–81. doi: 10.1085/jgp.88.1.59. [DOI] [PMC free article] [PubMed] [Google Scholar]
- Forsythe ID, Tsujimoto T, Barnes-Davies M, Cuttle MF, Takahashi T. Inactivation of presynaptic calcium current contributes to synaptic depression at a fast central synapse. Neuron. 1998;20:797–807. doi: 10.1016/s0896-6273(00)81017-x. [DOI] [PubMed] [Google Scholar]
- Friel DD, Tsien RW. An FCCP-sensitive Ca2+ store in bullfrog sympathetic neurons and its participation in stimulus-evoked changes in [Ca2+]i. J Neurosci. 1994;14:4007–4024. doi: 10.1523/JNEUROSCI.14-07-04007.1994. [DOI] [PMC free article] [PubMed] [Google Scholar]
- Goda Y, Stevens CF. Two components of transmitter release at a central synapse. Proc Natl Acad Sci U S A. 1994;91:12942–12946. doi: 10.1073/pnas.91.26.12942. [DOI] [PMC free article] [PubMed] [Google Scholar]
- Gunter TE, Pfeiffer DR. Mechanisms by which mitochondria transport calcium. Am J Physiol. 1990;258:C755–786. doi: 10.1152/ajpcell.1990.258.5.C755. [DOI] [PubMed] [Google Scholar]
- Hagler DJ Jr, Goda Y. Properties of synchronous and asynchronous release during pulse train depression in cultured hippocampal neurons. J Neurophysiol. 2001;85:2324–2334. doi: 10.1152/jn.2001.85.6.2324. [DOI] [PubMed] [Google Scholar]
- Herrington J, Park YB, Babcock DR, Hille B. Dominant role of mitochondria in clearance of large Ca2+ loads from rat adrenal chromaffin cells. Neuron. 1996;16:219–228. doi: 10.1016/s0896-6273(00)80038-0. [DOI] [PubMed] [Google Scholar]
- Hong SJ, Chang CC. Use of geographutoxin II (μ-conotoxin) for the study of neuromuscular transmission in mouse. Br J Pharmacol. 1989;97:934–940. doi: 10.1111/j.1476-5381.1989.tb12034.x. [DOI] [PMC free article] [PubMed] [Google Scholar]
- Hsu S-F, Augustine GJ, Jackson MB. Adaptation of Ca2+-triggered exocytosis in presynaptic terminals. Neuron. 1996;17:501–512. doi: 10.1016/s0896-6273(00)80182-8. [DOI] [PubMed] [Google Scholar]
- Hubbard JI, Gage PW. Abolition of post-tetanic potentiation. Nature. 1964;202:299–300. doi: 10.1038/202299a0. [DOI] [PubMed] [Google Scholar]
- Hubbard JI, Wilson DF. Neuromuscular transmission in a mammalian preparation in the absence of blocking drugs and the effect of d-tubocurarine. J Physiol. 1973;228:307–325. doi: 10.1113/jphysiol.1973.sp010088. [DOI] [PMC free article] [PubMed] [Google Scholar]
- Hubbard JI, Wilson DF, Miyamoto M. Reduction of transmitter release by d-tubocurarine. Nature. 1969;223:531–533. doi: 10.1038/223531a0. [DOI] [PubMed] [Google Scholar]
- Lichtman JW, Sunderland W, Wilkinson RS. High resolution imaging of synaptic structure with a simple confocal microscope. New Biol. 1989;1:75–82. [PubMed] [Google Scholar]
- Linder TM, Quastel DM. A voltage-clamp study of the permeability change induced by quanta of transmitter at the mouse end-plate. J Physiol. 1978;281:535–556. doi: 10.1113/jphysiol.1978.sp012438. [DOI] [PMC free article] [PubMed] [Google Scholar]
- McLachlan EM, Martin AR. Non-linear summation of end-plate potentials in the frog and mouse. J Physiol. 1981;311:307–324. doi: 10.1113/jphysiol.1981.sp013586. [DOI] [PMC free article] [PubMed] [Google Scholar]
- Magleby KL, Pallotta BS, Terrar DA. The effect of (+)-tubocurarine on neuromuscular transmission during repetitive stimulation in the rat, mouse, and frog. J Physiol. 1981;312:97–113. doi: 10.1113/jphysiol.1981.sp013618. [DOI] [PMC free article] [PubMed] [Google Scholar]
- Matlib MA, Zhou Z, Knight S, Ahmed S, Choi KM, Krause-Bauer J, Phillips R, Altschuld R, Katsube Y, Sperelakis N, Bers DM. Oxygen-bridged dinuclear ruthenium amine complex specifically inhibits Ca2+ uptake into mitochondria in vitro and in situ in single cardiac myocytes. J Biol Chem. 1998;273:10223–10231. doi: 10.1074/jbc.273.17.10223. [DOI] [PubMed] [Google Scholar]
- Medler K, Gleason EL. Mitochondrial Ca2+ buffering regulates synaptic transmission between retinal amacrine cells. J Neurophysiol. 2002;87:1426–1439. doi: 10.1152/jn.00627.2001. [DOI] [PubMed] [Google Scholar]
- Molgo J, Pecot-Dechavassine M. Effects of carbonyl cyanide m-chlorophenylhydrazone on quantal transmitter release and ultrastructure of frog motor nerve terminals. Neuroscience. 1988;24:695–708. doi: 10.1016/0306-4522(88)90362-4. [DOI] [PubMed] [Google Scholar]
- Narita K, Akita T, Hachisuka J, Huang S, Ochi K, Kuba K. Functional coupling of Ca2+ channels to ryanodine receptors at presynaptic terminals. Amplification of exocytosis and plasticity. J Gen Physiol. 2000;115:519–532. doi: 10.1085/jgp.115.4.519. [DOI] [PMC free article] [PubMed] [Google Scholar]
- Narita K, Akita T, Osanai M, Shirasaki T, Kijima H, Kuba K. A Ca2+-induced Ca2+ release mechanism involved in asynchronous exocytosis at frog motor nerve terminals. J Gen Physiol. 1998;112:593–609. doi: 10.1085/jgp.112.5.593. [DOI] [PMC free article] [PubMed] [Google Scholar]
- Naves LA, Van Der Kloot W. Repetitive nerve stimulation decreases the acetylcholine content of quanta at the frog neuromuscular junction. J Physiol. 2001;532:637–647. doi: 10.1111/j.1469-7793.2001.0637e.x. [DOI] [PMC free article] [PubMed] [Google Scholar]
- Ohta Y, Kuba K. Inhibitory action of Ca2+ on spontaneous transmitter release at motor nerve terminals in a high K+ solution. Pflugers Arch. 1980;386:29–34. doi: 10.1007/BF00584183. [DOI] [PubMed] [Google Scholar]
- Ravin R, Spira ME, Parnas H, Parnas I. Simultaneous measurement of intracellular Ca2+ and asynchronous transmitter release from the same crayfish bouton. J Physiol. 1997;501:251–262. doi: 10.1111/j.1469-7793.1997.tb00001.x. [DOI] [PMC free article] [PubMed] [Google Scholar]
- Reid B, Slater CR, Bewick GS. Synaptic vesicle dynamics in rat fast and slow motor nerve terminals. J Neurosci. 1999;19:2511–2521. doi: 10.1523/JNEUROSCI.19-07-02511.1999. [DOI] [PMC free article] [PubMed] [Google Scholar]
- Richards DA, Guatimosim C, Betz WJ. Two endocytic recycling routes selectively fill two vesicle pools in frog motor nerve terminals. Neuron. 2000;27:551–559. doi: 10.1016/s0896-6273(00)00065-9. [DOI] [PubMed] [Google Scholar]
- Rieke F, Schwartz EA. Asynchronous transmitter release: control of exocytosis and endocytosis at the salamander rod synapse. J Physiol. 1996;493:1–8. doi: 10.1113/jphysiol.1996.sp021360. [DOI] [PMC free article] [PubMed] [Google Scholar]
- Schneggenburger R, Neher E. Intracellular calcium dependence of transmitter release rates at a fast central synapse. Nature. 2000;406:889–893. doi: 10.1038/35022702. [DOI] [PubMed] [Google Scholar]
- Schofield GG, Marshall IG. Neuromuscular transmission in the athymic nude mouse. J Neurol Sci. 1980;48:21–34. doi: 10.1016/0022-510x(80)90147-1. [DOI] [PubMed] [Google Scholar]
- Segal JR, Ceccarelli B, Fesce R, Hurlbut WP. Frequency of miniature end plate potentials determined by an extension of Campbell's theorem. In: Rahamimoff R, Katz B, editors. Calcium, Neuronal Function and Transmitter Release. Boston: Blackwell Science Inc; 1984. p. 331. p. [Google Scholar]
- Sidky AO, Baimbridge KG. Calcium homeostatic mechanisms operating in cultured postnatal rat hippocampal neurons following flash photolysis of nitrophenyl-EGTA. J Physiol. 1997;504:579–590. doi: 10.1111/j.1469-7793.1997.579bd.x. [DOI] [PMC free article] [PubMed] [Google Scholar]
- Steunkel EL. Regulation of intracellular calcium and calcium buffering properties of rat isolated neurohypophysial nerve endings. J Physiol. 1994;481:251–271. doi: 10.1113/jphysiol.1994.sp020436. [DOI] [PMC free article] [PubMed] [Google Scholar]
- Stevens CF, Tsujimoto T. Estimates for the pool size of releasable quanta at a single central synapse and for the time required to refill the pool. Proc Natl Acad Sci U S A. 1995;92:846–849. doi: 10.1073/pnas.92.3.846. [DOI] [PMC free article] [PubMed] [Google Scholar]
- Sun J-Y, Wu X-S, Wu L-G. Single and multiple vesicle fusion induce different rates of endocytosis at a central synapse. Nature. 2002;417:555–559. doi: 10.1038/417555a. [DOI] [PubMed] [Google Scholar]
- Suzuki S, Osanai M, Mitsumoto N, Akita T, Narita K, Kijima H, Kuba K. Ca2+-dependent Ca2+ clearance via mitochondrial uptake and plasmalemmal extrusion in frog motor nerve terminals. J Neurophys. 2002;87:1816–1823. doi: 10.1152/jn.00456.2001. [DOI] [PubMed] [Google Scholar]
- Suzuki S, Osanai M, Murase M, Suzuki N, Shirasaki T, Narita K, Ohnuma K, Kuba K, Kijima H. Ca2+ dynamics at the frog motor nerve terminal. Pflugers Arch. 2000;440:351–365. doi: 10.1007/s004240000278. [DOI] [PubMed] [Google Scholar]
- Talbot JD, David G, Barrett EF. Inhibition of mitochondrial Ca2+ uptake has differential effects on phasic release from motor terminals in physiological and low bath [Ca2+] J Neurophys. 2003 doi: 10.1152/jn.00012.2003. in the Press. [DOI] [PubMed] [Google Scholar]
- Tang YG, Zucker RS. Mitochondrial involvement in post-tetanic potentiation of synaptic transmission. Neuron. 1997;18:483–491. doi: 10.1016/s0896-6273(00)81248-9. [DOI] [PubMed] [Google Scholar]
- Van Der Kloot W. Methods for estimating release rates during high frequency quantal secretion and for testing such methods. J Neurosci Methods. 1990;33:33–39. doi: 10.1016/0165-0270(90)90079-u. [DOI] [PubMed] [Google Scholar]
- Washio H. Effect of uncoupling agents of oxidative phosphorylation on the spontaneous release of transmitter from insect motor nerve terminals. Comp Biochem Physiol. 1982;C72:369–373. doi: 10.1016/0306-4492(82)90107-1. [DOI] [PubMed] [Google Scholar]
- Werth JL, Thayer SA. Mitochondria buffer physiological calcium loads in cultured dorsal root ganglion neurons. J Neurosci. 1994;14:348–356. doi: 10.1523/JNEUROSCI.14-01-00348.1994. [DOI] [PMC free article] [PubMed] [Google Scholar]
- White RJ, Reynolds IJ. Mitochondria and Na+/Ca2+ exchange buffer glutamate-induced calcium loads in cultured cortical neurons. J Neurosci. 1995;15:1318–1328. doi: 10.1523/JNEUROSCI.15-02-01318.1995. [DOI] [PMC free article] [PubMed] [Google Scholar]
- Wu L-G, Betz WJ. Nerve activity but not intracellular calcium determines the time course of endocytosis at the frog neuromuscular junction. Neuron. 1996;17:769–779. doi: 10.1016/s0896-6273(00)80208-1. [DOI] [PubMed] [Google Scholar]
- Wu L-G, Betz WJ. Kinetics of synaptic depression and vesicle recycling after tetanic stimulation of frog motor nerve terminals. Biophys J. 1998;74:3003–3009. doi: 10.1016/S0006-3495(98)78007-5. [DOI] [PMC free article] [PubMed] [Google Scholar]
- Wu L-G, Saggau P. Presynaptic inhibition of elicited neurotransmitter release. Trends Neurosci. 1997;20:204–212. doi: 10.1016/s0166-2236(96)01015-6. [DOI] [PubMed] [Google Scholar]
- Zengel JE, Sosa MA, Poage RE, Mosier DR. Role of intracellular Ca2+ in stimulation-induced increases in transmitter release at the frog neuromuscular junction. J Gen Physiol. 1994;104:337–355. doi: 10.1085/jgp.104.2.337. [DOI] [PMC free article] [PubMed] [Google Scholar]
- Zucker RS, Regehr WG. Short-term synaptic plasticity. Ann Rev Physiol. 2002;64:355–405. doi: 10.1146/annurev.physiol.64.092501.114547. [DOI] [PubMed] [Google Scholar]