Abstract
Heat production and force were measured during tetani of single muscle fibres from anterior tibialis of frog. During stimulation fibres were either kept under isometric conditions, or were stretched or allowed to shorten (at constant velocity) after isometric force had reached its plateau value. The energy change was evaluated as the sum of heat and work (work = integral of force with respect to length change). Net energy absorption occurred during stretch at velocities greater than about 0.35 L0 s−1 (L0 is fibre length at resting sarcomere length 2.10 μm). Heat produced by 1 mm segments of the fibre was measured simultaneously and separately; energy absorption is not an artefact due to patchy heat production. The maximum energy absorption, 0.092 ± 0.002 P0L0 (mean ±s.e.m., n = 8; where P0 is isometric force at L0), occurred during the fastest stretches (1.64 L0 s−1) and amounted to more than half of the work done on the fibre. Energy absorption occurred in two phases. The amount in the first phase, 0.027 ± 0.003 P0L0 (n = 32), was independent of velocity beyond 0.18 L0 s−1. The quantity absorbed in the second phase increased with velocity and did not reach a limiting value in the range of velocities used. After stretch, energy was produced in excess of the isometric rate, probably from dissipation of the stored energy. About 34 % (0.031 P0L0/0.092 P0L0) of the maximum absorbed energy could be stored elastically (in crossbridges, tendons, thick, thin and titin filaments) and by redistribution of crossbridge states. The remaining energy could have been stored in stretching transverse, elastic connections between myofibrils.
Muscles act as the brakes of the body as well as the motors. During locomotion the optimum performance of muscles as brakes is just as important as their performance as motors, yet braking has been far less studied. Whereas a motor converts chemical energy into mechanical work and heat, brakes convert mechanical work into some other form of energy. In the simplest case, the work done on the brakes immediately becomes heat. However, studies of muscles acting as brakes suggest that they are not operating in this simplest way (Hill & Howarth, 1959; Constable et al. 1997). In these experiments, both the heat produced in the muscle and the work done on the muscle by the apparatus stretching it were measured. If the muscles had simply converted the work directly into heat (and did nothing else), the sum would have been zero during the time the stretch was occurring. However, this is not what happened. Instead the total amount of energy in the form of heat and work declined during the stretch, and it can be concluded that energy is absorbed and stored by the muscle during stretch.
Our first aim was to gain experimental evidence about the degree of uniformity of heat production during stretch. Extreme non-uniformity could lead to serious artefacts and make the conclusion about energy storage unsafe. Several authors have been concerned that such an artefact could have arisen in the following way (Hill & Howarth, 1959; Woledge et al. 1985; Constable et al.1997). In these experiments heat was measured from a part of the muscle only, and it was assumed that this part was representative of the entire muscle. The concern was that a part of the muscle gave way under the extra force during stretch. In the most extreme case the entire stretch might have occurred in one place while the rest of the muscle was not stretched at all. If the muscle were acting as a simple brake, converting all of the work done on it during stretch into heat, then all of this heat would be produced at the site of the stretch and none elsewhere. If heat were measured from the part that was not stretched (and thus not converting work into heat) the results would falsely indicate that the muscle absorbed energy during stretch. To test for this type of artefact, we measured heat production by single muscle fibres using a thermopile designed to give improved spatial resolution for measurement of heat production along the length of the fibre. We found that heat production was reasonably uniform during stretch, and concluded that energy absorption is not an artefact.
Our second aim was to measure the amount and time course of energy storage, which allows quantitative consideration of possible mechanisms and sites of energy storage. We have compared our results with estimates of the amounts of energy that could be stored in: (a) tendons, (b) thick and thin filaments, (c) titin filaments and (d) crossbridges. The models of Lombardi & Piazzesi (1990) and Piazzesi & Lombardi (1995) were extended to describe the energy changes during stretch and the modified model was used to predict the amounts of free energy change due to crossbridges during stretch.
METHODS
Preparation and mounting of fibres
The experiments were carried out on fibres isolated from frogs (Rana temporaria) killed by decapitation followed by destruction of the spinal cord in accordance with Schedule I of the UK Animals (Scientific Procedures) Act 1986. Single fibres were dissected from the lateral head of the tibialis anterior muscle. Dissection and experiments were performed with fibres under saline containing (mmol l−1): 115 NaCl, 2.5 KCl, 1.8 CaCl2 and 3.0 sodium phosphate buffer at pH 7.1. The fibre tendons were held in platinum foil T-shaped clips. The total length of tendon outside the clips was 300–500 μm. The sarcomere length in the resting fibre was measured by laser diffraction and set to 2.10 μm; this fibre length is defined as L0. The fibre dimensions were measured under a stereomicroscope.
Measurement of tendon compliance
To evaluate the contribution of tendon compliance to the overall fibre compliance, fibres were mounted between the levers of a servo-controlled loudspeaker motor, similar to that described by Lombardi & Piazzesi (1990) and a capacitance gauge force transducer (resonant frequency, 40–50 kHz) similar to that described by Huxley & Lombardi (1980). Step length changes of different sizes, complete in 120 μs, were imposed at the plateau of the isometric tetanus and the actual change in sarcomere length was recorded by a striation follower (Huxley et al. 1981) from a selected segment of the fibre, 1–2 mm long. The force at the end of the step (T1, Huxley & Simmons, 1971) was plotted against the corresponding length change measured by the motor position and that measured by the striation follower. The stiffness of the whole fibre and the stiffness of the fibre segment were measured as the slopes of these relationships (Fig. 9).
Figure 9. Tendon compliance.
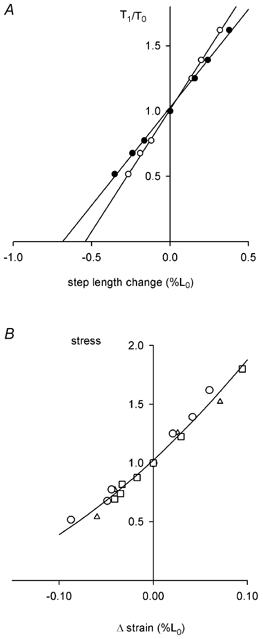
A, results for one fibre showing the values of force (T1) recorded at the end of a step change in fibre length expressed relative to the force before the step (T0) vs. the step length change produced by the motor (•) and the change in sarcomere length detected by the striation follower (○). Length change is expressed relative to the length before the step change. See text for further explanation. L0, 5.61 mm; P0, 5.84 mN; sarcomere length at L0, 2.11 μm; segment length under the striation follower, 1.20 mm; average segment sarcomere length, 2.10 μm; cross-sectional area, 18 300 μm2; temperature, 4.8 °C. B, stress vs. strain relationship for the tendon. Stress is the value of T1/T0 shown in A. Δ strain is the change in length of the tendon, expressed relative to L0. Δ strain is the difference between motor movement and change in sarcomere length (difference between • and ○ in A). Results for 3 fibres shown as different symbols. P0, 4.21 ± 0.56 mN; fibre cross-sectional area, 15 900 ± 1300 μm2; and temperature, 4.2 ± 0.3 °C.
Heat experiments
Thermopile
A thermopile was constructed which consisted of nine sections, each 1 mm long and containing four thermocouples. The antimony-bismuth thermocouples were made by vacuum deposition (Mulieri et al. 1977) on a 6 μm thick polyimide film (Kapton, Goodfellow Metals Ltd, Cambridge, UK). The Seebeck coefficient of the thermocouples was measured using the method described by Kretzschmar & Wilkie (1972, 1975) and was 64.36 ± 0.47 μV (±s.e.m.) per thermocouple per K temperature difference (n = 9 sections). The heat capacity of the thermopile was 0.24 ± 0.01 mJ mm−1 K−1 (n = 9 sections), which is about the same as the heat capacity of a typical fibre used in this experiment. Ancom C-3A amplifiers (filter 100 Hz), modified to chop at 1 kHz as described by Dijkema et al. (1985), amplified the output of each thermopile section. Thus the output of each section was recorded simultaneously and separately, and the temperature of different segments of the fibre was measured. Records were made from, on average, 66.6 ± 6.9 % (±s.e.m., n = 6 fibres) of the fibre length (range 40.0 to 85.7 %).
The heat conduction delay of the thermopile was estimated by applying a voltage pulse (1 ms and 50 V amplitude) to an inexcitable fibre via the stimulating electrodes and recording the thermopile output directly on an oscilloscope (not amplified by the Ancoms). The temperature rose exponentially with a time constant of about 5 ms.
Experimental protocol
The fibre was mounted horizontally between a capacitance gauge force transducer (2.1 kHz frequency response, Model 400A, Aurora Scientific Inc., Aurora, Ontario, Canada) and a motor (Model 300B, Cambridge Technology Inc., Watertown, MA, USA or the loudspeaker motor). After adjusting the fibre length to L0, all but a thin layer of saline was removed from around the fibre and the thermopile chamber was closed. Thermal equilibrium was reached in 15 to 20 min. The temperature was constant during each experiment, and ranged between 0.8 and 1.8 °C in different experiments.
Single electrical stimuli (0.2 or 0.5 ms duration) were applied to determine the threshold stimulus strength. During the rest of the experiment, tetanic stimulation was used at strengths of 1.5 times the threshold, and a frequency sufficient to give a fused tetanus (10–15 Hz). The time constant for heat loss from each thermopile section and the heat capacity in contact with each section were evaluated using the Peltier heating method (Kretzschmar & Wilkie, 1972, 1975).
The fibre performed a series of contractions with shortening, lengthening and purely isometric conditions. In the contractions with movement, the motor controlled the distance and velocity of the movement. The fibre was stimulated for 0.5 s under isometric conditions before movement started. Movement was centred on L0 (fibre length at which resting sarcomere length is 2.10 μm). The distance moved ranged between 0.54 and 1.1 mm (corresponding to 7.3 to 15.0 % L0, average 10.8 ± 0.4 % L0, ±s.e.m., n = 52 records). For four of the six fibres, only one distance was used, and in the other cases two distances were used. Several velocities of movement were used. During the isometric contractions the fibre was at the L0. There was a recovery period of at least 4 min between contractions.
A program written with TestPoint (Capital Equipment Corp., Billerica, MA, USA) was used for data acquisition and to control the stimulator and motor. It also performed various calculations, such as converting the thermopile output to heat and correction for heat loss. An 1802AO data acquisition board (Keithley Instruments Ltd, Theale, UK) was used.
Measurements of force, heat and work
The force, motor position (fibre length change), and the output from each section of the thermopile were recorded at 1000 Hz. The values reported for isometric force were measured after 0.5 s of stimulation, which was just before movement started. Velocity was calculated from distance and duration of movement. The cumulative work at each time point was calculated from the integral of force with respect to distance moved (work done by the fibre is treated as positive, and work done on the fibre by the motor is treated as negative).
Heat from each thermopile section was calculated from that section's output using the Seebeck coefficient and the heat capacity of the part of the fibre preparation over that thermopile section, and its time constant for heat loss. Total heat output for the whole fibre (H) was calculated as:
where Σh is the sum of heats from all thermopile sections in use, L0 is the fibre length defined above and T is the length of the thermopile sections in use. Total energy output at each time point was calculated as the sum of heat (H) and work.
The quantities of heat, work and energy during movement reported in Fig. 5 and Table 2 are the net quantities (the value at end of movement minus the value at start of movement). Rates are net quantities/duration of movement. Isometric values are quantities for the 0.1 s period before movement started.
Figure 5. Force, energy and energy rate at different velocities of stretch.
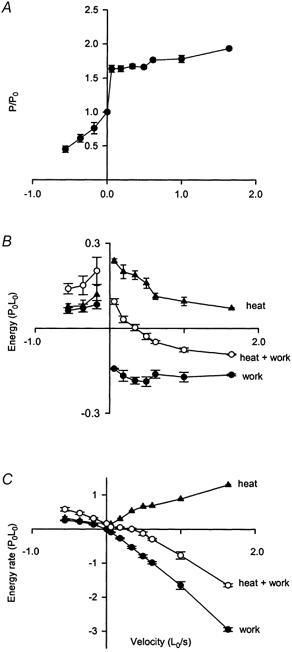
A, force-velocity relation for shortening (negative velocities) and stretch. Force expressed relative to the isometric force in the same tetanus. Forces for stretch were measured in the middle of the second phase of force production (see Fig. 3) during stretch. B, energy produced as heat (▴), work (•) and heat + work (○) during shortening and during stretch at different velocities. Energy is expressed relative to P0L0 to take account of variations in fibre size and contractility. C, results shown in B expressed as rates (energy/duration of movement). All values are means ±s.e.m. and n values vary between 2 and 11. Results for 6 fibres and 52 tetani.
Table 2.
Energy turnover
| Velocity (L0s−1 | Force during movement (P0) | n | Heat rate (P0L0s−1) | Work rate (P0L0s−1) | Energy rate (P0L0s−1) | Heat (P0L0) | Work (P0L0) | Energy (P0L0) |
|---|---|---|---|---|---|---|---|---|
| Shortening | ||||||||
| −0.561 ± 0.047 | 0.450 ± 0.046 | 4 | 0.324 ± 0.041 | 0.256 ± 0.013 | 0.580 ± 0.054 | 0.077 ± 0.010 | 0.063 ± 0.010 | 0.140 ± 0.018 |
| −0.362 ± 0.029 | 0.612 ± 0.057 | 5 | 0.248 ± 0.031 | 0.218 ± 0.010 | 0.466 ± 0.036 | 0.080 ± 0.020 | 0.072 ± 0.014 | 0.152 ± 0.033 |
| −0.177 ± 0.014 | 0.761 ± 0.083 | 3 | 0.181 ± 0.056 | 0.133 ± 0.010 | 0.315 ± 0.024 | 0.119 ± 0.033 | 0.084 ± 0.015 | 0.203 ± 0.048 |
| Isometric | ||||||||
| 0.000 | 1.000 | 10 | 0.182 ± 0.015 | 0.000 | 0.182 ± 0.015 | — | — | — |
| Stretch | ||||||||
| 0.057 ± 0.008 | 1.636 ± 0.050 | 2 | 0.151 ± 0.040 | −0.091 ± 0.014 | 0.060 ± 0.002 | 0.238 ± 0.008 | −0.143 ± 0.002 | 0.095 ± 0.010 |
| 0.180 ± 0.008 | 1.638 ± 0.044 | 7 | 0.300 ± 0.021 | −0.268 ± 0.020 | 0.049 ± 0.020 | 0.200 ± 0.024 | −0.168 ± 0.019 | 0.032 ± 0.012 |
| 0.337 ± 0.015 | 1.671 ± 0.033 | 11 | 0.534 ± 0.013 | −0.532 ± 0.032 | 0.001 ± 0.031 | 0.188 ± 0.015 | −0.185 ± 0.012 | 0.003 ± 0.011 |
| 0.490 ± 0.010 | 1.662 ± 0.020 | 8 | 0.666 ± 0.021 | −0.791 ± 0.042 | −0.126 ± 0.050 | 0.160 ± 0.018 | −0.188 ± 0.017 | −0.028 ± 0.011 |
| 0.613 ± 0.013 | 1.764 ± 0.027 | 9 | 0.690 ± 0.014 | −0.985 ± 0.034 | −0.295 ± 0.026 | 0.144 ± 0.011 | −0.162 ± 0.014 | −0.048 ± 0.005 |
| 0.997 ± 0.050 | 1.781 ± 0.051 | 7 | 0.886 ± 0.013 | −1.654 ± 0.113 | −0.767 ± 0.105 | 0.096 ± 0.015 | −0.172 ± 0.017 | −0.076 ± 0.007 |
| 1.637 ± 0.001 | 1.934 ± 0.015 | 8 | 1.300 ± 0.020 | −2.947 ± 0.056 | −1.647 ± 0.044 | 0.072 ± 0.002 | −0.164 ± 0.003 | −0.092 ± 0.002 |
Mean (±s.e.m.) values offorce, heat, work and energy (heat + work) during movement at various velocities. n is the number of contractions. Results for 6 single fibres. L0 is resting fibre length at sarcomere length 2.1 μm and P0 is isometric force. All energy values are expressed relative to P0L0, which is proportional to fibre volume, and thus normalizes for differences in fibre size.
Stimulus heat
The electrical stimulation can produce heat as the current flows through the resistance of the muscle fibre. We measured the heat produced when fibres that had spontaneously become inexcitable were stimulated using stimulus patterns and strengths in the range used in experiments on excitable fibres. There was a linear relationship between heat (μJ) and V2t, where V is the stimulus voltage (V) and t is the stimulus pulse duration (ms) with a slope of 0.002. Thus stimulus heat (SH) was calculated as:
where SH is in microjoules, and V and t are as defined above. In most of the experiments stimulus heat was negligible compared with total heat produced. However, where stimulus heat exceeded 2 % of the total heat during stretch it was subtracted.
Time course of energy output during stretch
The time course of energy change (heat + work) during stretch was characterized by fitting straight lines through the values of energy vs. time. The Solver function in Microsoft Excel was used for fitting. The data set included 0.1 s of isometric contraction immediately before the stretch started, and the entire period of stretch. One straight line was fitted through the isometric points, and one or two straight lines were fitted through the values during stretch (see Fig. 6). The isometric fitted line and the line fitted to the initial part of stretch were constrained to intersect at the start of stretch. Two lines were used to fit the stretch values when the mean squared deviation was less than 90 % of that for a single line. Using this criterion, two lines were used to fit 34 records out of a total of 52. In one unusual case in which periodic noise occurred, this criterion was not applied and a single line was used. We report the amounts and rates of energy change during the isometric period, and during the one or two phases during stretch. When there were two phases the following assumptions were made for the purpose of calculating the amount of energy change in each phase: it was assumed that both phases started at the beginning of stretch and that the first phase ended when the two lines intersected.
Figure 6. Examples of phases in the energy record during stretch.
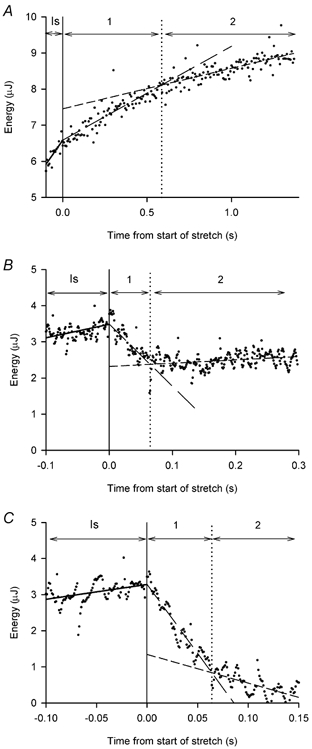
Records of energy (dots) vs. time for 3 tetani with stretch at different velocities (L0 s−1): A, 0.066; B, 0.50; C, 1.0. The continuous vertical line marks the end of the isometric period and the start of stretch, time = 0. Isometric values were measured during the period labelled Is. Phases 1 and 2 during stretch are marked 1 and 2, respectively. Straight lines were fitted through the isometric points (continuous lines) and the two phases of energy change during stretch (dashed lines) as described in the Methods. The dotted vertical line marks the intersection of the lines fitted to the energy during stretch (end of phase 1 and start of phase 2).
Fibre size
Results for six fibres are reported here. Energy is expressed relative to an estimate of fibre volume (P0L0) to take account of differences due to fibre size. Fibre length (L0) at sarcomere length 2.10 μm was measured with an eyepiece micrometer in the stereomicroscope. The isometric force at L0 (P0), which is directly proportional to fibre cross-sectional area (Elzinga et al. 1989), was used as an estimate of cross-sectional area. Energy values are expressed as the dimensionless quantity energy/(P0L0).
Fibre cross-sectional area was also calculated from measurements of perpendicular fibre diameters measured with an eyepiece micrometer; values are included in Table 1. The energy and force results would have been more scattered, but our conclusions unaffected, if these areas had been used to estimate fibre size.
Table 1.
Fibre properties
| Isometric force (P0) (mN) | Fibre length at 2.1 μm(L0) (mm) | Cross-sectional area (μm2) | Dryweight (μg) |
|---|---|---|---|
| 7.65 ± 0.98 | 6.61 ± 0.33 | 21300 ± 3300 | 42.6 ± 8.7 |
Mean values (±s.e.m.) for 6 fibres.
At the end of each experiment the fibre was fixed in ethanol and dried in air. Non-fibre material was removed and the fibre itself was weighed on a Cahn electrobalance (Table 1).
Statistics
The values reported are means ±s.e.m. unless otherwise stated.
Theoretical calculations
Our modelling work was based on the models of Lombardi & Piazzesi (1990) and Piazzesi & Lombardi (1995). Numerical calculations were made as described in the latter paper but using Mathcad 2001. The x distribution of crossbridges was represented in finite steps of 0.088 nm. The integration over time was carried out using a time interval between 10 and 50 μs depending on the speed of sliding of the filaments. The calculation method was validated by showing that the results agreed with those given by Piazzesi & Lombardi (1995) in their Figs 2, 6A and 7B (for ramp shortening at 0.62 μm s−1). To predict ATP turnover during stretching, additional assumptions were needed to specify whether an attached bridge (state A1, A2 or A3) detaches to state D1 or D2 by moving to the upper or lower of the two possible energy levels for each detached state. We have assumed that detachment occurs to the upper level whenever the energy in the bridge is above that level. Under these circumstances the cycle is completed without ATP hydrolysis.
Figure 2. Spatial variation in heat production during stretch and isometric contraction.
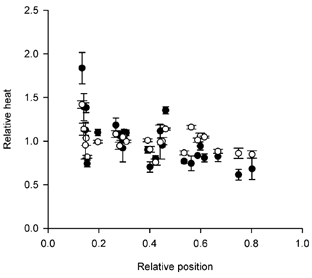
The amount of heat measured by each thermopile section, expressed as a fraction of the heat per section averaged over all sections, plotted against the position along the fibre from which heat was recorded. Position is expressed relative to the L0 of the fibre. Abscissa zero indicates the end of the fibre close to the motor. Results for heat recorded during 52 tetani, 25 thermopile sections and 6 fibres. ○, isometric period; •, period during stretch. Each symbol is the mean (±s.e.m.) of values for a section for n tetani, range 2–24.
Figure 7. Two phases of energy change during stretch.
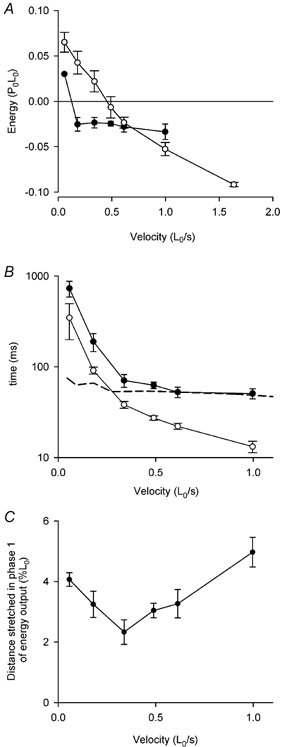
A, the amounts of energy change during phase 1 (•) and phase 2 (○) of stretch at different velocities. See Fig. 6 and text. Means ±s.e.m., n = 2–11. Results for 6 fibres. B, the time to the end of phase 1 (•) and the delay to the change in slope of force (○, same as Fig. 4B) during stretch at different velocities. Note that the time axis is log scale. Means ±s.e.m., n = 2–10. Results for 6 fibres. The dashed line shows the predictions from the model of the time to reach the steady state distribution of crossbridge states during stretch. C, the distance stretched during phase 1. Means ±s.e.m., n = 2–9. Results for 6 fibres.
RESULTS
Uniformity of heat production along the fibre length
Figure 1A shows records of force and heat production during an isometric contraction. Heat was recorded from five sections of the fibre. A similar pattern of heat production occurred in each section, although some differences are apparent. For example at the start of the contraction, there was rather less heat produced by the section shown at the top of the figure than the others.
Figure 1. Heat records from thermopile sections and force responses.
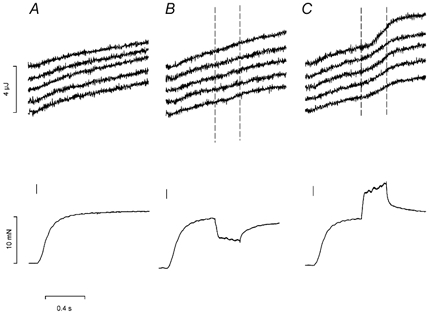
Upper row shows heat recorded simultaneously by 5 separate adjacent sections of the thermopile (the top trace is recorded from the section of the thermopile closest to the motor end). Lower row shows force responses. Records from an isometric tetanus (A), a tetanus with shortening at 0.363 L0 s−1 (B) and a tetanus with stretch at 0.364 L0 s−1 (C). The short vertical line marks the start of stimulation, and dashed vertical lines on the heat records mark the period of movement. L0, 6.68 mm; dry weight per unit length, 6.44 μg mm−1; sarcomere length at L0, 2.10 μm; cross-sectional area, 35 200 μm2; temperature, 1.6 °C.
Figure 1 also shows records of force and heat production from a contraction that included a period of shortening (B) or a period of stretching (C) at a constant speed. As in the isometric tetanus, there was reasonable similarity among the heat records from the different sections of the fibre. (The small increase in heat rate that occurs during shortening (as reported by Linari & Woledge, 1995, for example) is not obvious in these records from single sections of the thermopile but is apparent in the averaged results. See Fig. 5.) In each segment there is a clear increase in the heat rate during stretch. Although there is some variation between sections during stretch, it certainly is not the case that all the extra heat appears in a small region of the fibre that has given way under the extra force.
Figure 2, which shows the results for all six fibres, compares the variability of heat production in an isometric period (○) with the variability during stretch (•). The quantity plotted is the heat measured in each section expressed as a fraction of the heat per section averaged over all sections used. There is scatter, which may be somewhat greater during stretch than in the isometric periods.
Heat production, work and energy during movement
Figure 3 shows example records of length change, force and energy during tetani with stretch at four different velocities. As has been described in previous studies (for example, Edman et al. 1978; Lombardi & Piazzesi, 1990), force increases in two phases during stretch, the first increase being much steeper than the second. The rate of heat production increased during the stretch, but only after a clear delay. This delay was first described by Constable et al. (1997), who observed it during stretch of muscle fibre bundles from mouse and cane toad. In Fig. 4 we have compared the time to the change in slope of the force record with the delay in the heat records and found that the force break occurs earlier than the increase in heat production. Correspondingly, the distance stretched before the change in slope of the force (1.46 ± 0.06 % L0) is only about half as far as the distance stretched before heat production increases (2.89 ± 0.011 % L0). Figure 4B shows that the force and heat delays have a similar dependence on velocity; both decrease as velocity increases. In the log plot (Fig. 4B) the separation between the lines is approximately constant indicating that the ratio of the two delays is almost independent of velocity.
Figure 3. Time course of energy during steady lengthening at different velocities.
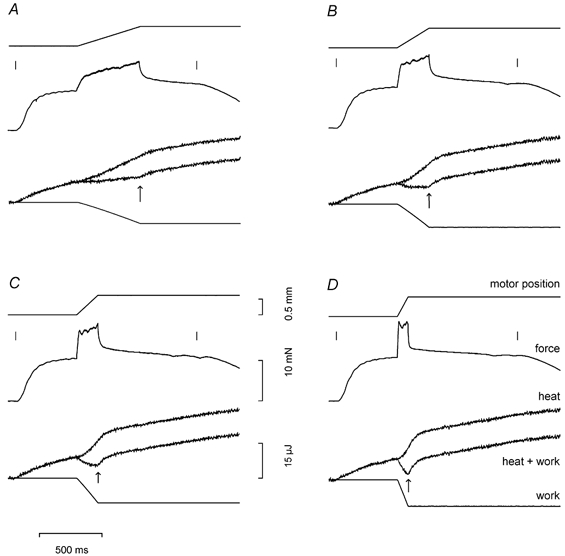
Each panel shows from top to bottom: motor position, force, heat, energy (heat + work) and work for tetani with stretch at different velocities (L0 s−1): A, 0.185; B, 0.364; C, 0.532; and D, 1.09. Short vertical lines mark the beginning and the end of the stimulation. The vertical arrow on each energy trace marks the end of stretch. Same fibre as in Fig. 1.
Figure 4. Time to change in rate of force and heat production during stretch.
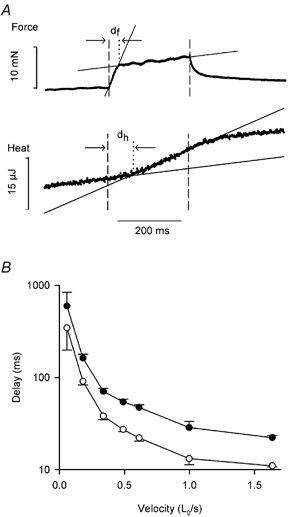
A, method of measuring the time to change in rate of force (df) and heat production (dh). Vertical dashed lines mark the start and end of stretch. Continuous lines are fits through the data points. The vertical dotted line marks the time of intersection of the fitted lines. Velocity of stretch: 0.364 L0 s−1. B, relationship between df (○), dh (•) and velocity of stretch. Note the delay axis is log scale. Means ±s.e.m., n values vary between 2 and 10. Results for 6 fibres and 44 tetani.
Figure 3 shows that work was done on the fibres at an almost constant rate during stretch. The net energy (heat + work) varied with the velocity of stretch. There was a small net energy production during stretch at the lowest velocity as indicated by the record of energy output being greater at the end of the stretch than at the start (Fig. 3A). At all other velocities there was net energy absorption during stretch. The amount of energy absorption increased with velocity of stretch. After the end of stretch as stimulation continued, force dropped quickly at first and then approached the isometric value more slowly. After the end of stretch, there was always an increase in energy production; the rate was initially high and gradually declined approaching the isometric rate. This point is considered in more detail later.
Total quantities
Figure 5A shows the relationship between force during movement and the velocity of movement. As expected from earlier studies, force is less when velocity of shortening is greater. At all velocities of stretch the force is greater than the isometric force. It rises steeply with increasing velocity reaching a relatively stable value about 175 % of the isometric force.
Figure 5B summarizes the total quantities of heat, work and energy (heat + work) produced by six fibres during movement at different velocities. The results for shortening are typical in showing that work and energy vary with velocity. The results show that during stretch the work done on the fibre increases with velocity for very slow stretches (work is zero under isometric conditions where velocity is zero) and then remains relatively constant as velocity increases above 0.057 L0 s−1. The heat production is highest at the lowest velocity and decreases with increasing velocity. The energy, which is the sum of heat and work, is positive at the two slowest velocities. The value decreases as velocity increases, and is zero for a velocity of about 0.34 L0 s−1; in other words, heat output is equal to the work done on the fibre at this velocity. For faster stretches the net energy is negative, which means that more work was done on the fibre than it released as heat. So during stretch at these higher velocities, there has been a net gain of energy by the fibre during the stretch, which at the fastest velocity was on average 56 % of the work done on the fibre. These gains of energy at the four highest velocities are statistically significant (see Table 2). The energies are shown as rates in Fig. 5C, where it can be appreciated that they reach values that are large compared with the rates under isometric conditions and during shortening.
Two phases in the time course of energy change during stretch
The energy change (heat + work) occurred in one or two phases, which were measured as described in the Methods. At the fastest velocity of stretch there was a single phase of energy absorption. In 34 of the 44 records at lower velocities, the energy change occurred in two distinct phases as illustrated in Fig. 6.
Figure 7A shows how the amount of energy change during each phase varied with velocity of stretch. In phase 1 (•) there is energy produced at the lowest velocity of stretch (0.057 L0 s−1). At all the other velocities, energy is absorbed in phase 1 and the amount is independent of velocity; the average value is 0.027 ± 0.003 P0L0 (n = 32). In phase 2 (○), however, the energy change varied continuously with velocity. Figure 7B shows that except at the lowest velocity, the time to the end of phase 1 is significantly greater than the delay to the change in slope of the force during stretch (from Fig. 4B). Figure 7C shows that the distance stretched during phase 1 was not strongly dependent on velocity. The results for the five velocities, excluding the fastest, are not significantly different from each other (ANOVA, P = 0.22). The value for the highest velocity is significantly different from the others (ANOVA, P = 0.006).
Energy output after the end of stretch
As can be seen in Fig. 3, net energy production occurred after the end of stretch (after the arrows) when the fibre length was held constant and stimulation continued. Initially the rate of energy output was very high, particularly after the fastest stretch, but it declined to about the same rate as in the isometric period before stretch. The example record in Fig. 8A shows that the energy output after the end of stretch could be described as the sum of an exponential component and a constant rate. The time constant of the fast, exponential phase was about 40 ms, and was about the same for all velocities of stretch (see Fig. 8B). The amount of energy output in the fast phase increases with velocity as shown in Fig. 8C (•). This energy output is greater than the energy absorption that occurred during the stretch (○). Thus it seems that by about 200 ms after the end of stretch all the energy that had been stored has been released as heat.
Figure 8. Energy change during and after stretch.
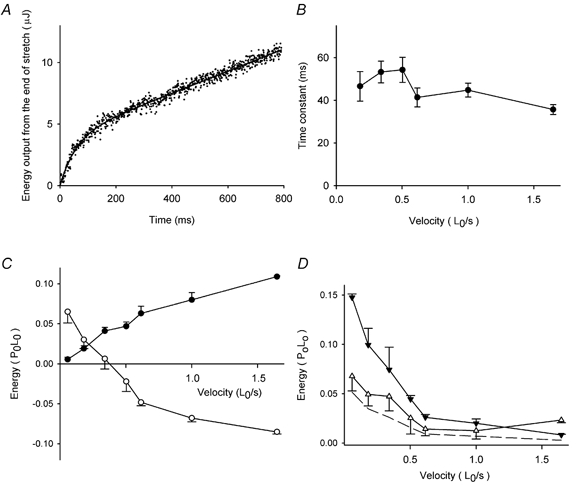
A, example record of heat production (dots) after the end of stretch at 0.532 L0 s−1. The curve fitted to the record is shown as a continuous line. The fitted curve is y =A[1 - exp(-t/τ)]+bt, where t is time, and A, τ and b are fitted constants. B, values of τ fitted to the records as shown in A for stretch at different velocities. Means ±s.e.m., 46 records from 6 fibres. C, energy change during stretch (○) and amplitude of the fast component of heat production after stretch in the same records (•). Means ±s.e.m., 48 records from 6 fibres. D, the sums of the energy change during stretch and the fast component of heat production after stretch (▵) as shown in C, and heat produced in isometric contractions over the same period as stretch for the velocities indicated (▾). Means ±s.e.m., 48 records from 6 fibres. The dashed line is 0.35 × isometric values (see text).
If energy storage during stretch and its release shortly after stretch were the only processes occurring, the net energy change would be zero. In fact, as shown in Fig. 8D, there was net energy output (▵) for all velocities of stretch, suggesting that some ATP hydrolysis occurred during stretch.
Figure 8D also compares this net energy (▵) with the heat produced under isometric conditions for the period corresponding to the period of stretch (▾). Except at the highest velocity of stretch, there was less net energy output during stretch than during an equivalent isometric period, indicating that ATP was hydrolysed less rapidly during stretch than in isometric contraction. The net energy output during stretch is not significantly different from the dashed line in Fig. 8D, which is 35 % of the isometric energy and equivalent to that due to the ATP hydrolysis by the sarcoplasmic reticulum Ca2+ pump (see Discussion).
Tendon compliance
When an active muscle fibre is stretched some of the work is used to elongate the tendon, which is in series with the sarcomeres. Because the tendon is elastic, this energy is stored in the tendon. The amount of this stored energy can be evaluated from the stress-strain characteristics of the tendon. Figure 9A shows the stress-strain results from an experiment in which step changes in length were imposed during the plateau of an isometric tetanus. The two lines show the total length change imposed on the fibre by the motor (•) and the change in length of the sarcomeres (○), as detected by the striation follower. The difference between these length changes at each stress value gives the change in tendon length (Fig. 9B) and the area under this curve is the amount of energy in the tendons. During ramp lengthening the force increases from P0 to a value of about 1.75 P0. The additional energy stored in the tendons during this increase in force is the area under this part of the stress-strain curve and amounts to about 0.0014 P0L0.
DISCUSSION
Is energy storage during stretching an artefact?
The following artefact could misleadingly appear as energy storage. If part of the fibre did not elongate during stretch, and heat production was only measured in this region, then the measured heat would be artefactually small and the net energy change could indicate storage when in fact there was none. This seems unlikely because Edman et al. (1982) provided evidence that stretches applied to single muscle fibres from frog caused elongation of every segment (0.6–0.7 mm) of the fibre. Our results lead to a similar conclusion. Heat was measured from individual, 1 mm sections along much of the length (on average 67 %) of the fibre, and during stretch the amounts of heat produced by different segments were not grossly different from each other (Fig. 1). In addition, the spatial variation of heat production was not obviously different from that during isometric contraction (Fig. 2). We conclude that energy storage is a genuine phenomenon.
Quantity of energy stored
The amount of energy stored is large compared with other energy changes during contraction. Up to 56 % of the work done on the fibre during stretch can be stored. The rate of energy storage was as much as nine times the rate of isometric energy production. Furthermore, the rate of energy storage increased with velocity of stretch and showed no sign of reaching a maximum value (Fig. 5C), so our observations of the quantity of energy stored cannot be taken as maximum possible values.
It is also of interest to consider the quantity of energy stored in relation to the number of crossbridges and to the free energy change per molecule of ATP hydrolysed. The maximum amount of energy storage that we observed occurred at the highest velocity of stretch and was 0.092 P0L0, which is equivalent to 234 pnJ per myosin head (where pn = 10−9× 10−12= 10−21). This value was calculated for all heads, attached and detached, using P0 from Table 1, L0 as 1050 nm (half-sarcomere length) and 0.51 × 10¹⁵ thick filaments per m2 (taking the lattice spacing as 37.5 nm (Matsubara & Elliott, 1972) and the fraction of the cross-section occupied by myofibrils as 0.83 (Mobley & Eisenberg, 1975)), and 290 myosin heads per half of a thick filament (49 crowns, 6 heads per crown). The free energy available from hydrolysis of one molecule of ATP is about 83 pnJ. Thus the energy storage during stretch was equivalent to about three (= 234/83) ATP molecules per myosin head, which is too much to be due to shifts between crossbridge states. The amount of energy stored during phase 1 (Fig. 7A, •) is almost independent of velocity. The average for all velocities except the lowest is 0.027 P0L0, which is equivalent to about 0.8 ATP molecules per myosin head. This amount of energy storage could conceivably result from shifts between crossbridge states. However, this would require that the states have widely spaced energy levels and that a high proportion of the crossbridges participate in the shifts.
Energy after end of stretch: how long can energy remain stored?
After the end of stretch, there is a rapid phase of energy production, which is sufficient to account for the energy storage during stretch. After stretch, this energy is produced with a time constant of 40–50 ms; thus there is no need to suppose that stored energy remains in the fibre for more than 200 ms after the end of stretch. This energy release may be due to release of strain in an elastic component, which might also result in a decay of force. Edman and colleagues (Edman et al. 1978, 1982; Edman & Tsuchiya, 1996) have examined the mechanical after-effects of stretch. They found that force continued to decay for several seconds during isometric contraction after the end of stretch, which is much more prolonged than the period of energy release found here. Thus these two effects do not seem to correspond in a simple way.
The sum of the energy change during the stretch and that produced after the stretch is always positive (Fig. 8D, ▵) indicating that some ATP is split during stretch. Thus the results provide additional support for the conclusion that net ATP synthesis does not occur during stretch (Curtin & Davies, 1973). The energy from ATP hydrolysis during stretch (Fig. 8D, ▵) is less than for an equivalent isometric period (Fig. 8D, ▴) indicating that ATP turnover is reduced by the stretch to be less than in isometric contraction. During isometric contraction ATP is hydrolysed both by actomyosin activity and also by the Ca2+ pump in the sarcoplasmic reticulum membrane. The Ca2+ pump accounts for about 30 to 40 % of the total ATP use. Thus if stretch completely suppressed actomyosin activity, about a third of the total would remain. The results shown in Fig. 8D are compatible with this and agree with the conclusions of Curtin & Davies (1973), which were based on measurements of ATP hydrolysis.
Where could the energy be stored?
We will consider the following possible sites of energy storage: tendons, thick and thin filaments, the crossbridges and titin filaments.
Tendon: compliance in series with the fibre. The amount of energy that can be stored in the tendons’ compliance is about 0.0014 P0L0 (see above, Fig. 9B), which is only about 1.5 % of the maximum energy storage during stretch (0.092 P0L0). Energy storage in tendons is about 4.0 % of the energy storage during phase 1 (0.027 P0L0).
Thick and thin filaments: compliance in series with the crossbridges. The amount of energy that can be stored in the filaments’ compliance is about 0.004 P0L0, assuming an equivalent filament compliance of 3.1 nm per half-sarcomere per P0 (Dobbie et al. 1998). This is 4.3 % of the maximum energy storage (0.092 P0L0) and 14.8 % of the energy stored during phase 1 (0.027 P0L0).
Thus these two compliances in series with the crossbridges can store only about 5.4 % of the maximum energy storage we observed, and about 18.5 %, almost one-fifth, of the phase 1 energy storage.
Titin in ‘popped’ sarcomeres. Titin forms filaments that span the half-sarcomere from M-line to Z-line. They are elastic and thus exert force when stretched. They are believed to exert passive force when resting fibres are stretched to long sarcomere lengths. In our experiments no passive force was produced. Nevertheless, titin could contribute to energy storage in our experiments in the following way.
Morgan (1990, 1994) has suggested that during stretch of active muscle some of the sarcomeres elongate much more than others. These long, so-called ‘popped’, sarcomeres reach lengths at which there is little if any filament overlap and force is transmitted through the long sarcomeres by some other structure with elastic properties. This structure acts in series with non-popped sarcomeres where crossbridges are producing force in the conventional way. Since the popped and non-popped sarcomeres are in series, the force in each must be the same. The work done in stretching this elastic structure in the popped sarcomeres would remain stored for the entire time that force remains high. Titin filaments are obvious candidates for this additional elastic structure. We will consider how much energy could be stored in this way and how it compares with the energy storage that we observed.
Kellermayer et al. (2001) measured the stress-strain characteristics of single titin molecules. The energy required to elongate a titin molecule to a length of 3.5 μm (equivalent to a sarcomere length of 7.0 μm) is 56 × 10−18 J per titin molecule. To elongate all (100 %) titin molecules in a fibre by this amount would require an energy input (or work) of 0.34 P0L0 in the energy units in which we have expressed our results. The units were converted using the following values: 2268 titin molecules per μm2 fibre cross-sectional area, each titin molecule spans one half-sarcomere (Kellermayer et al. 2001) and P0 of 359 kN m−2 (Table 1).
The maximum energy storage we observed was 0.092 P0L0, so 27 % of the titin molecules would have to be elongated to 3.5 μm to store this amount of energy. The total elongation of the fibre needed to achieve this is 63 % L0, which is much greater than the total stretch imposed in our experiments (on average 10.4 % L0). Thus, although energy storage in titin molecules probably occurs during stretch, it cannot account for the majority of the energy storage we have observed. The most energy that could be stored in titin during the stretches that we used is 0.015 P0L0. This value was calculated from the extreme assumption that the entire length change, 10.4 % L0, occurs in 4.5 % of the sarcomeres where titin elongates to 3.5 μm and the other 95.5 % of the sarcomeres do not change in length.
Energy storage in crossbridges themselves.Linari et al. (2000) measured by quick-release experiments the amount of mechanical energy content of the attached myosin heads during ramp stretch. It is about 0.002 P0L0, which is about twice that stored during isometric contraction. In such quick releases there is not enough time for a change of crossbridge state to occur; and all of the change is due to the elasticity of the crossbridges. However, energy could also be stored by crossbridges being dragged into higher energy states during stretch, so the total amount of energy stored in bridges may be greater than what can be deduced from the results of Linari et al. (2000).
We have examined how much energy could be stored by stretching crossbridge elasticity and by redistribution of crossbridge states. We extended the model of Piazzesi & Lombardi (1995) so that the energy changes during stretch could be predicted. This required additional assumptions as explained in the Methods. A typical simulation of the force and the energy output before and during a stretch at a constant speed is shown in Fig. 10. The model predicts that energy is absorbed during the transition between the steady isometric state (IM) and the new steady state reached during stretching (SSS). This energy absorption occurs because: (a) during stretch there is more energy stored in the elasticity of the crossbridges than during isometric contraction and (b) the distribution between the three attached states in the model is shifted towards higher energy states. The simulation shows that energy production resumes after the brief period of energy absorption, but at a rate less than in the isometric period. This is because the rate of ATP splitting is reduced by the ongoing stretch.
Figure 10. Predictions from the model.
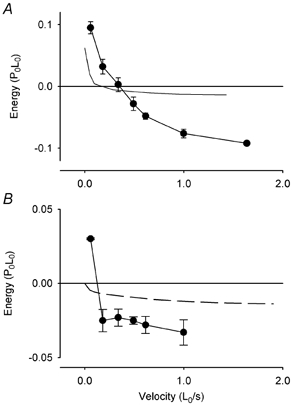
A, length change (expressed in fractions of L0). B, force, expressed as multiples of P0. C, energy expressed relative to P0L0. IM, isometric period before stretch; PSS, pre-steady state phase; SSS, steady state phase. See text.
The model predicts that energy storage can only occur in the early, pre-steady state of the stretch (PSS) as attached crossbridges are dragged into a higher energy state. No additional energy storage could occur once all the crossbridges are in the new, stable distribution of states.
We have made simulations similar to that in Fig. 10 for a range of stretch velocities. The quantity of energy stored is almost independent of velocity (Fig. 11B, dashed line). This feature of the model predictions resembles our observations of phase 1 of energy change during stretch but, the amount of energy storage predicted is much smaller than what is observed. The steady state in the model would be reached after 0.03–0.07 s of stretch depending on velocity; at low velocity the observed times to the end of phase 1 are considerably longer than this (Fig. 7B). Thus there is qualitative similarity between what the model predicts for the pre-steady state and our observations of phase 1 energy, but the quantitative match is poor. The duration of phase 1 (observed) does not match the time required to reach the new steady state as assessed by the simulation or the time to change in force slope (observed).
Figure 11. Energy storage during lengthening and model predictions.
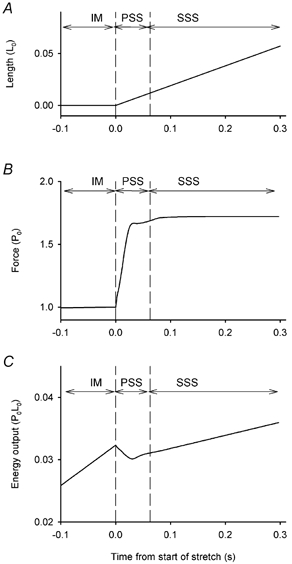
A, total energy change vs. velocity of stretch. Continuous line, no points: total predicted energy from ATP hydrolysis and energy absorption. •, observed energy, means ±s.e.m., n values vary from 2 to 11. B, energy change vs. velocity of stretch. Energy change observed during phase 1 (symbols are means ±s.e.m., n values vary from 2 to 9) and energy absorption predicted to occur in the period before the steady state distribution of crossbridge states is reached (dashed line).
The total energy change predicted by the model is shown by the continuous line (no symbols) in Fig. 11A. It is the sum of the energy change associated with stretching crossbridge elasticity and in redistribution of states during stretch (Fig. 11B, dashed line) and from the predicted ATP hydrolysis. It is positive at low velocities and negative at high velocities. The total observed energy output (Fig. 11A, •) shows a similar dependence on velocity, but the quantities of energy do not match those predicted. In particular at high stretch velocities, the observed energy absorption is much greater than the prediction.
One or three crossbridge cycles per ATP?
The model of Piazzesi & Lombardi (1995) on which we have based our simulations was devised to provide an explanation for the force and ATP hydrolysis during shortening. The model assumes that a high proportion of bridges are attached, as was considered reasonable at the time. Using realistic values for force-length relationship during a power stroke, the maximum work done by one crossbridge during a power stroke was only a small fraction of the free energy from hydrolysis of one ATP molecule. Therefore in their model the hydrolysis of each ATP molecules drives three crossbridge cycles. In this way the predicted efficiencies match those observed.
If each ATP drives only one crossbridge cycle then the predicted force would then be three times greater than that observed. This discrepancy could be avoided if some mechanism acted to ensure that only one-third of the crossbridges attached at any one time. In such a model all of the crossbridges could act to store energy during stretch if the distance and duration of stretch were sufficient to involve all the bridges, including those not attached at the start of stretch. In this case approximately three times as much energy could be stored as shown in the predictions in Fig. 11B (dashed line). A detailed model along these lines has not been developed, but could probably account for the energy storage in phase 1 (Fig. 11B, •). The difficulty is to devise a feasible mechanism for limiting the proportion of bridges that attach and add it to the model while retaining other, successful features.
Summary of sites of energy storage
The total energy that can be stored in tendons, thick and thin filaments, crossbridges and titin is 0.031 P0L0 (= 0.001 + 0.004 + 0.011 + 0.015) P0L0, which is much less than the observed maximum energy storage that we observed (0.092 P0L0).
It is also interesting to consider the energy that can be stored during what we have called the pre-steady state period. The pre-steady state is the period during which force is rising at the start of the stretch, in other words before the crossbridges have reached their new steady state distribution. During the pre-steady state period energy storage occurs in tendons, in thick and thin filaments, and in the crossbridges; each being proportional to the increase in force during this period. We have not included energy storage in titin because it can continue to increase after force reaches its steady value. The energy storage that can occur during the pre-steady state phase of stretch is 0.016 P0L0 (= 0.001 + 0.004 + 0.011), which is less than the amount of energy observed to be stored in our phase 1 (0.027 P0L0). In addition phase 1 continues after force has reached its steady value.
There are at least three other ways that energy could be stored. First, the crossbridges could have up to three times the energy content assumed in the crossbridge model (as described in the paragraph above, ‘One or three crossbridge cycles per ATP?’). Second, there might be entropy changes associated with the changes among crossbridge states. There are no entropy changes in the model; the free energy and enthalpy changes are assumed to be the same. A third possibility is that energy is stored in stretching elastic elements that join myofibrils transversely; this mechanism was proposed by Edman & Tsuchiya (1996) to explain their mechanical results and is described in some detail in their paper. Not enough is known about these transverse structures to enable us to estimate how much energy could be stored in them, but this seems a reasonable location for energy storage on the scale observed here. The role of these transverse connections could be explored quantitatively in experiments comparing the mechanical and energetic behaviour of single myofibrils, which do not include these connections, with that of fibres or bundles of myofibrils in which these transverse connections remain intact.
Acknowledgments
The authors wish to thank Professor Gabriella Piazzesi for advice and helpful discussion and Professor Vincenzo Lombardi for comments on the manuscript. We also wish to thank Mr Tony Christopher, Mr Alessandro Aiazzi and Mr Mario Dolfi for skilled technical assistance. The Wellcome Trust supported this research.
references
- Constable JK, Barclay CJ, Gibbs CL. Energetics of lengthening in mouse and toad skeletal muscles. J Physiol. 1997;505:205–215. doi: 10.1111/j.1469-7793.1997.205bc.x. [DOI] [PMC free article] [PubMed] [Google Scholar]
- Curtin NA, Davies RE. Chemical and mechanical changes during stretching of activated frog skeletal muscle. Cold Spring Harb Symp Quant Biol. 1973;37:619–626. [Google Scholar]
- Dijkema FK, Elzinga G, Holewijn AJ. Measurement of temperature changes in muscle contraction with a thermopile and amplifier designed to improve signal-to-noise ratio and resolution in time and place. J Physiol. 1985;366 P. [Google Scholar]
- Dobbie I, Linari M, Piazzesi G, Reconditi M, Koubassova N, Ferenczi MA, Lombardi V, Irving M. Elastic bending and active tilting of myosin heads during muscle contraction. Nature. 1998;396:383–387. doi: 10.1038/24647. [DOI] [PubMed] [Google Scholar]
- Edman KAP, Elzinga G, Noble MIM. Enhancement of mechanical performance by stretch during tetanic contractions of vertebrate skeletal muscle fibres. J Physiol. 1978;281:139–155. doi: 10.1113/jphysiol.1978.sp012413. [DOI] [PMC free article] [PubMed] [Google Scholar]
- Edman KAP, Elzinga G, Noble MIM. Residual force enhancement after stretch of contracting frog single muscle fibres. J Gen Physiol. 1982;80:769–784. doi: 10.1085/jgp.80.5.769. [DOI] [PMC free article] [PubMed] [Google Scholar]
- Edman KAP, Tsuchiya T. Strain of passive elements during force enhancement by stretch in frog muscle fibres. J Physiol. 1996;490:191–205. doi: 10.1113/jphysiol.1996.sp021135. [DOI] [PMC free article] [PubMed] [Google Scholar]
- Elzinga G, Stienen GJM, Wilson MGA. Isometric force production before and after chemical skinning in isolated muscle fibres of the frog Rana temporaria. J Physiol. 1989;410:171–185. doi: 10.1113/jphysiol.1989.sp017527. [DOI] [PMC free article] [PubMed] [Google Scholar]
- Hill AV, Howarth JV. The reversal of chemical reactions in contracting muscle during an applied stretch. Proc R Soc Lond B Biol Sci. 1959;151:169–193. [Google Scholar]
- Huxley AF, Lombardi V. A sensitive force transducer with resonant frequency 50 kHz. J Physiol. 1980;305:15–16P. [Google Scholar]
- Huxley AF, Lombardi V, Peachey LD. A system for fast recording of longitudinal displacement of a striated muscle fibre. J Physiol. 1981;317:12–13. P. [Google Scholar]
- Huxley AF, Simmons RM. Proposed mechanism of force generation in striated muscle. Nature. 1971;233:534–537. doi: 10.1038/233533a0. [DOI] [PubMed] [Google Scholar]
- Kellermayer MSZ, Smith SB, Bustamante C, Granzier HK. Mechanical fatigue in repetitively stretched single molecules of titin. Biophys J. 2001;80:852–863. doi: 10.1016/S0006-3495(01)76064-X. [DOI] [PMC free article] [PubMed] [Google Scholar]
- Kretzschmar KM, Wilkie DR. A new method for absolute heat measurement utilizing the Peltier effect. J Physiol. 1972;224:18–21. P. [PubMed] [Google Scholar]
- Kretzschmar KM, Wilkie DR. The use of the Peltier effect for simple and accurate calibration of thermoelectric devices. Proc R Soc Lond B Biol Sci. 1975;190:315–321. doi: 10.1098/rspb.1975.0095. [DOI] [PubMed] [Google Scholar]
- Linari M, Lucii L, Reconditi M, Casoni ME, Amenitsch H, Bernstorff S, Piazzesi G, Lombardi V. A combined mechanical and X-ray diffraction study of stretch potentiation in single frog muscle fibres. J Physiol. 2000;526:589–596. doi: 10.1111/j.1469-7793.2000.00589.x. [DOI] [PMC free article] [PubMed] [Google Scholar]
- Linari M, Woledge RC. Comparison of energy output during ramp and staircase shortening in frog muscle fibres. J Physiol. 1995;487:699–710. doi: 10.1113/jphysiol.1995.sp020911. [DOI] [PMC free article] [PubMed] [Google Scholar]
- Lombardi V, Piazzesi G. The contractile response during steady lengthening of stimulated frog muscle fibres. J Physiol. 1990;431:141–191. doi: 10.1113/jphysiol.1990.sp018324. [DOI] [PMC free article] [PubMed] [Google Scholar]
- Matsubara I, Elliott GF. X-ray diffraction studies on skinned single fibres of frog skeletal muscle. J Mol Biol. 1972;72:657–669. doi: 10.1016/0022-2836(72)90183-0. [DOI] [PubMed] [Google Scholar]
- Mobley BA, Eisenberg BR. Sizes of components in frog skeletal muscle measured by methods in stereology. J Gen Physiol. 1975;66:31–45. doi: 10.1085/jgp.66.1.31. [DOI] [PMC free article] [PubMed] [Google Scholar]
- Morgan DL. New insights into the behavior of muscle during active lengthening. Biophys J. 1990;57:209–221. doi: 10.1016/S0006-3495(90)82524-8. [DOI] [PMC free article] [PubMed] [Google Scholar]
- Morgan DL. An explanation for residual increased tension in striated muscle after stretch during contraction. Exp Physiol. 1994;79:831–838. doi: 10.1113/expphysiol.1994.sp003811. [DOI] [PubMed] [Google Scholar]
- Mulieri LA, Luhr G, Trefrey J, Alpert NR. Metal film thermopiles for use with rabbit right ventricular papillary muscles. Am J Physiol. 1977;233:C146–156. doi: 10.1152/ajpcell.1977.233.5.C146. [DOI] [PubMed] [Google Scholar]
- Piazzesi G, Lombardi V. A cross-bridge model that is able to explain mechanical and energetic properties of shortening muscle. Biophys J. 1995;68:1966–1979. doi: 10.1016/S0006-3495(95)80374-7. [DOI] [PMC free article] [PubMed] [Google Scholar]
- Woledge RC, Curtin NA, Homsher E. Energetic Aspects of Muscle Contraction. London: Blackwell Science Inc; 1985. [PubMed] [Google Scholar]


