

Abstract
Chronic hypoxia is accompanied by changes in blood and skeletal muscle acid-base control. We hypothesized that the underlying mechanisms include altered protein expression of transport systems and the enzymes involved in lactate, HCO3− and H+ fluxes in skeletal muscle and erythrocytes. Immunoblotting was used to quantify densities of the transport systems and enzymes. Muscle and erythrocyte samples were obtained from eight Danish lowlanders at sea level and after 2 and 8 weeks at 4100 m (Bolivia). For comparison, samples were obtained from eight Bolivian natives. In muscle membranes there were no changes in fibre-type distribution, lactate dehydrogenase isoforms, Na+,K+-pump subunits or in the lactate-H+ co-transporters MCT1 and MCT4. The Na+–H+ exchanger protein NHE1 was elevated by 39 % in natives compared to lowlanders. The Na+-HCO3− co-transporter density in muscle was elevated by 47–69 % after 2 and 8 weeks at altitude. The membrane-bound carbonic anhydrase (CA) IV in muscle increased in the lowlanders by 39 %, whereas CA XIV decreased by 23–47 %. Levels of cytosolic CA II and III in muscle and CA I and II in erythrocytes were unchanged. The erythrocyte lactate-H+ co-transporter MCT1 increased by 230–405 % in lowlanders and was 324 % higher in natives. The erythrocyte inorganic anion exchanger (Cl−-HCO3− exchanger AE1) was increased by 149–228 %. In conclusion, chronic hypoxia induces dramatic changes in erythrocyte proteins, but only moderate changes in muscle proteins involved in acid-base control. Together, these changes suggest a hypoxia-induced increase in the capacity for lactate, HCO3− and H+ fluxes from muscle to blood and from blood to erythrocytes.
Skeletal muscle and erythrocyte pH regulation
Intracellular pH in muscle is regulated through the coordinated activity of several transporters (Fig. 1). In resting skeletal muscle, the cellular production of acid and the negative membrane potential both tend to accumulate H+ intracellularly. This tendency for H+ accumulation is counteracted by a number of membrane transport systems that mediate H+ efflux. Together these transporters make up the pH-regulating system. At rest, the Na+–H+ exchange system is the most important pH regulator, but cellular pH is also influenced by transport of HCO3− into the cell. However, the proteins involved in Na+-HCO3− co-transport have never been quantified in muscle, and the functional importance for pH regulation is unknown (Juel, 1998a). Intense muscle activity is associated with an increase in the cellular production of lactate and H+. Thus, during intense exercise there is a large need for H+ removal from muscle, which is predominantly mediated by a 1:1 coupled co-transport of lactate and H+ via the monocarboxylate transporters (MCTs; Juel, 1996).
Figure 1. Muscle and blood pH regulation.
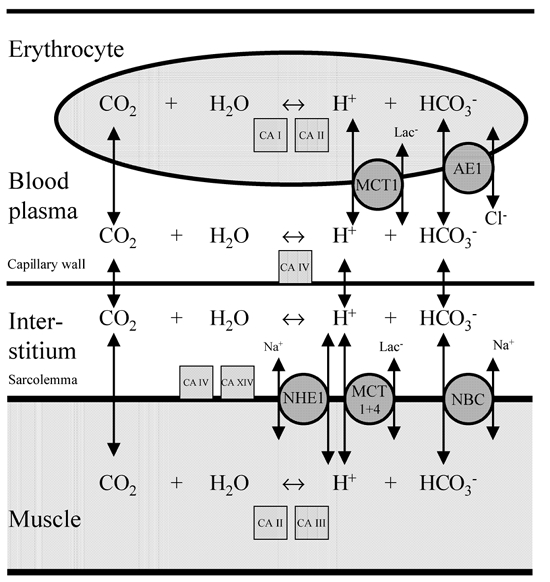
Summary of membrane-bound transport systems (circles) and enzymes (squares) involved in the H+ fluxes between muscle and blood. Carbonic anhydrase (CA) I, II, III, IV and XIV represent cytosolic and membrane-bound CA isoforms present in muscle and erythrocytes. NHE1: Na+–H+ exchanger isoform 1. MCT1 and MCT4: monocarboxylate transporter (lactate-H+ co-transporter) isoform 1 and 4. NBC: Na+-HCO3− co-transporter. AE1: Cl−-HCO3− exchanger 1.
The capacities of the pH-regulating transport systems are not only dependent on the protein density and activation of the individual transport proteins, but also on the carbonic anhydrases (CAs). The reactions catalysed by CA function as H+ acceptors or donors and thereby influence the rate of H+ and HCO3− transport (Geers & Gros, 2000). The CO2 formed in muscle diffuse into the erythrocytes where the high concentration of CA allows the interconversion of CO2 and H2O to HCO3− and H+ to occur within a fraction of a second. The anion (Cl−-HCO3−) exchanger then transports the formed HCO3− from the erythrocyte to plasma, whereas H+ is buffered within the cell by the high concentration of haemoglobin.
Blood and skeletal muscle acid-base control in chronic hypoxia
Chronic heart failure and chronic pulmonary disease are prevalent conditions that are often characterized by chronic hypoxia. In both heart failure (Okita et al. 1998) and lung disease (Maltais et al. 1998) skeletal muscle metabolism is altered and lactic acid is accumulated even during mild exercise. Whether or not hypoxia contributes to these changes in acid-base control, and whether the expression of transporters and enzymes involved in HCO3− and H+ fluxes are altered are unknown. It is very difficult to study these issues in patient groups because of inhomogeneous levels of hypoxia, detraining and medication.
The direct effect of chronic hypoxia can be studied more readily in humans exposed to high altitude. High-altitude natives are generally believed to have adapted to the hypoxic environment, while lowlanders exposed to altitude gradually undergo acclimatization. One acute effect of altitude is an elevated blood lactate concentration in response to a given submaximal workload. After 2–3 weeks exposure to altitude, a reduction in blood lactate concentration has been observed (Brooks et al. 1991), which has been attributed to a reduced net lactate release (Bender et al. 1989; Brooks et al. 1992). However, using 5 weeks of acclimatization to high altitude, another study found no changes in exercise-induced increases in blood lactate compared to sea level (Van Hall et al. 2001). It was suggested that reduced lactate production is a transient phenomenon of acclimatization and it was hypothesized that adaptations in muscle acid-base balance were responsible for the changes (Van Hall et al. 2001). Such modifications in acid-base status and extracellular (dynamic) buffer capacity have been observed during acclimatization (Böning et al. 2001; Wagner et al. 2002). The mechanisms underlying these alterations could involve changes at the protein level of transporters involved in pH regulation and lactate transport in muscle and blood. However, this possibility has never been investigated in man. Furthermore, it can be speculated that the reduced blood HCO3− concentration at altitude triggers adaptive changes in the protein density of the Na+–HCO3− co-transporter.
Thus, we hypothesize that in humans, the enzymes and transporters involved in muscle pH regulation and erythrocyte acid-base handling undergo changes during acclimatization to hypoxia. Therefore, the general aim of the present study was to investigate whether chronic hypoxia induces changes in the protein levels of muscle and blood membrane transport systems and enzymes. To test this we addressed the following questions: (1) Does chronic hypoxia change the expression of proteins involved in lactate and H+ transport? (2) Do changes in the different CA isoforms take place at altitude? (3) Is the density of transport systems mediating HCO3− transport changed at altitude? (4) Can changes in transport systems explain changes in dynamic buffer capacity?
For these purposes we measured the membrane protein densities of the MCTs (MCT1 and MCT4), the Na+–H+ exchanger, the Na+–HCO3− co-transporters, the membrane-bound and cytosolic CAs, and the Na+,K+-pump α1, α2, and β1 subunits in muscle needle biopsy material. Samples were obtained from lowlanders at sea level and after 2 and 8 weeks at an altitude of 4100 m. For comparison, biopsy samples were obtained from natives who were born and reside at an altitude of approximately 4000 m. In order to determine whether any adaptations might be explained by differences in fibre-type expression, we also measured some histochemical parameters (myosin heavy chain (MHC) distribution and lactate dehydrogenase (LDH) isoenzyme distribution). Furthermore, we quantified the CAs, MCT1, as well as the inorganic anion exchange (Cl−-HCO3− exchanger) in red blood cells from the same subjects.
METHODS
Subjects
The subjects of this investigation were six male and two female lowlanders (mean age 25 years, range 22–31 years) from Denmark and eight male (mean age 30 years, range 26–37 years) Bolivian high-altitude natives of Aymaran ancestry, born in and lifetime residents of La Paz/El Alto situated 3700–4100 m above sea level. The study was performed according to the Declaration of Helsinki. All subjects received written and oral information about the study in their native language and provided written consent to participate. The protocol for the Danish subjects was approved by the Ethical Committee of Copenhagen and Frederiksberg (KF 11-050/01) and the protocol for the Danish and Bolivian subjects by El Tribunal de Honor del Colegio Médico Departamental La Paz, and the Ministerio De Previsión Social y Salud Pública, La Paz, Bolivia.
Acclimatization of the lowlanders
We obtained four sets of muscle biopsy and blood samples from all of the Danish subjects. Two biopsy samples and two blood samples were obtained at the Copenhagen Muscle Research Centre approximately 1 month before the subjects flew to La Paz, Bolivia. Upon arrival, the subjects spent ∼4 days in La Paz (∼ 3700 m), whereafter they moved to El Alto (4100 m) for a further 8 weeks. The subjects all lived together in an apartment where they prepared their own meals while maintaining as much as possible their habitual Danish diet. The remaining muscle biopsy and blood samples were obtained at the Dutch Hospital in El Alto. The first sampling period at altitude was between days 11 and 17 (2 weeks) after arrival in La Paz. The second sampling period at altitude was between days 52 and 60 (8 weeks) after arrival in La Paz. Blood samples were collected in ice-cold tubes containing 10 μl 0.33 m EDTA per millilitre of blood and immediately centrifuged, and the packed cells were stored at −50 °C until analysis. Muscle biopsy samples were immediately frozen in liquid N2 and stored at −50 °C for approximately 2 weeks in Bolivia. Upon arrival in Copenhagen the biopsy samples were stored at −80 °C. Muscle biopsy samples were cut at −20 °C, and ∼30 mg of each sample was used in the present study.
Western blotting
The 30 mg of each muscle sample was homogenized in sucrose buffer (250 mm sucrose, 30 mm Hepes, 2 mm EGTA, 40 mm NaCl, 2 mm phenylmethylsulphonyl fluoride (PMSF) pH 7.4) using a Polytron 2100 and centrifuged at 1000 g for 5 min. The pellet was used for determination of myosin isoforms (see below). The supernatant was spun at 190 000 g for 90 min at 4 °C in a high-speed centrifuge equipped with a swing-out bucket rotor. The resulting supernatant (corresponding to the cytosolic fraction) was then frozen for later measurements of cytosolic proteins. The resulting pellet (corresponding to the membrane fraction) was resuspended in Tris-SDS (10 mm Tris, 4 % SDS, 1 mm EDTA, 2 mm PMSF, pH 7.4) and protein content determined with a BSA standard (DC protein assay, Bio-Rad). Samples were mixed 1:1 with sample buffer containing 10 % SDS, 5 % glycerol, 10 mm Tris-HCl, 1 mm EDTA, 10 mm dithiothreitol, and subjected to SDS-PAGE (ExcelGel 7.5 % or 8–18 % gradient gel). The amount of protein per lane was 6 μg. The separated proteins were electroblotted to a Millipore Immobilon-P polyvinylidine diflouride membrane. This membrane was blocked by 1 % BSA, 0.5 % low-fat dry milk, 0.1 % Tween-20, and incubated with the primary antibody diluted in a BSA-containing buffer. After treatment with the HRP-coupled secondary antibody, it was washed repeatedly with distilled water, 0.05 % Tween-20 and 1 m NaCl. The membrane was then incubated with electrochemiluminescence (ECL) or ECL+ reagents (Amersham) and visualized on a film. Scanning the film and analysing band intensities with SigmaGel software (SPSS, Chicago, IL, USA) yielded quantities of protein. Alternatively, the chemiluminescence signal from the ECL-treated membrane was analysed with a Kodak Image Station 440F.
Membranes were used for more than one primary antibody, taking advantage of the different protein molecular weights. Some membranes were re-used after treatment with Re-Blot Plus (Chemicon).
Blood samples
The Drabkin method (Sigma kit no. 525) was used to quantify total haemoglobin in the packed cells used for Western blotting of the cytosolic fraction. Total haemoglobin was used instead of total protein content. Erythrocyte membranes without haemoglobin were obtained from cells hemolysed by freezing, spun down at 20 000 g for 10 min, and diluted. The procedure was repeated four times in order to completely remove soluble proteins. Membrane protein content was determined as above.
Antibodies and identification of proteins
The antibody to the Na+–H+ exchanger isoform NHE1 (Chemicon, no. MAB3140) recognized a single, or in some samples double, band at approximately 100 kDa (Juel, 2000). Both bands are included in the scanning. The antibody to the Na+,K+-pump α1 isoform was from Developmental Studies Hybridoma Bank, University of Iowa (α6F). The antibody to the α2 isoform (Upstate Biotechnology, no. 06–168) was immunoabsorbed against an α1 fusion protein and is therefore considered to be specific for α2. The antibody to the Na+,K+-pump β1 subunit was provided by Professor P. Amstrup Petersen, University of Copenhagen, Denmark. The β1 isoform is the only β isoform in human muscle. The antibodies to the human lactate-H+ co-transporter isoforms MCT1 and MCT4 were provided by Professor A. P. Halestrap, Bristol, UK (Price et al. 1998). The specific antibodies to the membrane-bound CA isoforms IV and XIV were provided by Professor W. Sly, St Louis, MO, USA. These CAs can be distinguished by their different appearance on a gel; the CA IV antibody recognizes a double band at 39 kDa (Waheed et al. 1992; both bands were included in the densitometric scanning), whereas the CA XIV antibody labels a single band at 51 kDa (Fujikawa-Adachi et al. 1999). The antibodies to the cytosolic CAs CA I (Chemicon, no. AB1214), CA II (Chemicon, no. AB1828) and CA III (Spectral Diagnostics, no. 4020) recognize a 31 kDa band. The Na+-HCO3− co-transporters (NBC) were quantified by isoform-unspecific NBC antibodies (Chemicon, no. 3212) produced to a sequence (rat kidney NBC amino acids 338–391) with a high degree of homology to most NBC isoforms that have been cloned. These antibodies recognize a 150 kDa band in Western blots of muscle membranes. The inorganic anion (Cl−-HCO3−) exchanger isoform AE1 (90 kDa) was detected by anti-AE1 (Alpha Diagnostics International, no. AE12-M). The inorganic anion exchanger was also determined by an independent method. Washed erythrocyte membranes were incubated with a tritiated sample of the anion exchange inhibitor H2DIDS (10−5m, specific activity 200 mCi mmol−1, HSC Research and Development) at 37 °C in the dark for 1 h. With this treatment H2DIDS is irreversibly bound to the anion exchanger (Shami et al. 1978). The membranes were then washed four times and the samples divided for both protein determination and liquid scintillation counting. The density of the anion exchanger was expressed as counts per mg protein and calculated relative to the lowlanders at sea level. Glucose transporter 1 (GLUT1) was quantified in the erythrocyte membranes by GLUT1 antibodies (Chemicon, no. 1340), which recognize a broad and diffuse band (45–65 kDa) due to glycosylation.
Fibre-type composition and LDH isoforms
The fibre-type composition of the muscle biopsy samples was determined from the relative occurrence of the MHC isoforms (type I, IIA and IIX) using SDS-PAGE (Smerdu et al. 1994). The cellular distribution of the LDH isoforms (LDH1–5) was measured in the muscle cytosolic fraction. Protein (1.5 mg) was loaded onto a 1 % agarose gel and separated at 90 V for 60 min. LDH Isotrol (Sigma) was used as an internal control. The bands representing the isoenzymes were visualized using the Sigma LDH kit (no. 705) and scanned densitometrically. The percentage of the heart-type LDH (LDH-H) isoform was calculated from 1 LDH1 + 0.75 LDH2 + 0.5 LDH3 + 0.25 LDH4.
Calculations and statistics
The Western blot data were obtained in arbitrary density units. The individual sea-level sample for each of the eight lowlanders was calculated as the mean of the two samples obtained before the altitude stay. The mean of the eight sea-level means was then normalized to give 100 % (±s.e.m.). The 2 and 8 week samples as well as the samples from the natives were calculated relative to the mean sea-level value. One-way analysis of variance for repeated measures was used for comparison of samples obtained at sea level and after 2 and 8 weeks at altitude. Student's paired t test was used to locate the differences if data passed a normality test; otherwise a Wilcoxon rank test was used (SigmaStat software, SPSS). Data from high-altitude natives were compared to values from lowlanders at sea level using the unpaired t test. A level of P < 0.05 was considered statistically significant. Linear regression was used to investigate the correlation between fibre type (X-axis: relative occurrence of fibre type I) and protein content (SigmaStat software).
RESULTS
Blood parameters at altitude
The haematocrit was 41.3 ± 2.4 % at sea level, 47.4 ± 3.9 and 46.8 ± 3.2 % after 2 and 8 weeks at altitude, respectively, and 50.2 ± 3.1 % in the natives. The haemoglobin concentration was 139 ± 2 g l−1 at sea level, 163 ± 3 and 159 ± 3 g l−1 after 2 and 8 weeks at altitude, respectively, and 167 ± 4 g l−1 in the natives. The arterial lactate concentration at rest was 0.8 ± 0.2 mm at sea level, 1.0 ± 0.3 and 1.0 ± 0.1 mm after 2 and 8 weeks at altitude, respectively, and 0.7 ± 0.1 mm in the natives.
Myosin isoforms and LDH distributions are unchanged in chronic hypoxia
The percentage occurrence of the MHC isoforms did not change at altitude, and the distribution in the natives was not different from the lowlanders (Fig. 2). The percentage of LDH-H was 45.8 ± 2.5 % at sea level, 40.0 ± 2.2 % after 2 weeks and 44.6 ± 3.5 % after 8 weeks at altitude. In the natives, the percentage of the LDH-H form was 34.6 ± 6.6 %. The mean values were not significantly different due to the large interindividual variation. There was a positive correlation between percentage myosin type I and LDH-H (linear regression, r = 0.51, y = 0.34x+ 25).
Figure 2. Histochemical properties of muscle samples.
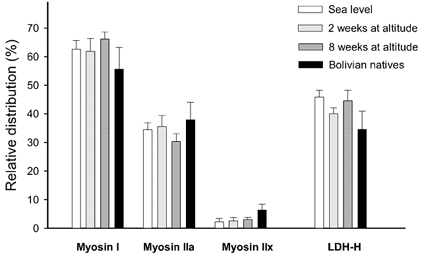
The bars to the left represent means (±s.e.m., n = 8) of the relative occurrence of the three myosin heavy chain isoforms (I, IIA and IIX) in the muscle samples. The bars to the right represent the percentage (of total LDH) of the lactate dehydrogenase heart-form (LDH-H). White bars: muscle samples obtained at sea level. Light grey bars: muscle samples obtained after 2 weeks at altitude. Dark grey bars: muscle samples obtained after 8 weeks at altitude. Black bars: muscle samples from Bolivian natives.
Hypoxia-induced changes in muscle membrane transporters
Lactate-H+ co-transporter proteins. The lactate-H+ co-transporter proteins MCT1 and MCT4 were quantified in the membrane fraction. The mean MCT1 and MCT4 densities measured in the lowlanders at altitude and in the high altitude natives were not different from sea-level samples (Fig. 3).
Figure 3. Muscle membrane transporters.
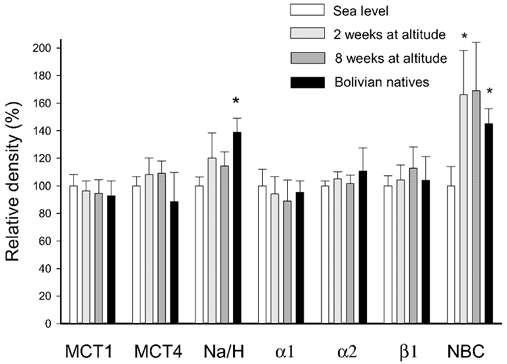
The bars represent the mean density (n = 8, ±s.e.m.) of various membrane-bound transporter proteins. The values are calculated relative to the density in membrane samples obtained from lowlanders before the stay at altitude stay (sea level samples; white bars). Light grey bars: samples obtained after 2 weeks at altitude. Dark grey bars: samples obtained after 8 weeks at altitude. Black bars: samples from Bolivian natives. Abbreviations (from left to right): MCT1: monocarboxylate (lactate-H+) transporter 1. MCT4: monocarboxylate transporter 4. α1: Na+,K+-pump subunit α1. α2: Na+,K+-pump subunit α2. β1: Na+,K+-pump subunit β1. Na/H: Na+–H+ exchanger protein NHE1. NBC: Na+-HCO3− co-transporter. * Significantly different from sea-level values (P < 0.05).
Na+–H+ exchanger proteins. The mean densities of the membrane-bound Na+–H+ exchanger protein NHE1 measured in the lowlanders after 2 and 8 weeks at altitude were not different from the sea-level samples (Fig. 3). In the natives the NHE1 protein density was 39 ± 10 % higher (P < 0.05) than the lowlanders at sea level.
Na+,K+-pump subunits. The Na+,K+-pump subunits α1, α2 and β1 were quantified in the membrane fraction using specific antibodies. None of the mean values for the 2 and 8 week samples and for the natives were significantly different from the mean value of the sea-level samples (Fig. 3).
Na+-HCO3− co-transport. The density of the Na+-HCO3− co-transporter NBC was increased in the samples obtained at 2 weeks (in those taken at 8 weeks, the change did not reach significance). The NBC density was also higher in the natives compared to the sea-level samples obtained from the lowlanders. The linear regression demonstrated a negative correlation (P < 0.05) between percentage fibre-type I and NBC density, which indicates a lower NBC density in muscle fibre type II than in muscle fibre type I.
Hypoxia-induced changes in muscle CAs
CAs were quantified both in the membrane fraction and in the cytosolic phase (Fig. 4). The CA isoforms IV and XIV were quantified in the membrane fraction. In the lowlanders the density of the CA IV protein was increased (P < 0.05) after 8 weeks at altitude. The protein density of CA IV in the natives was not different from the lowlanders at sea level. There was no correlation between fibre types and the density of the CA IV protein.
Figure 4. Muscle CAs.
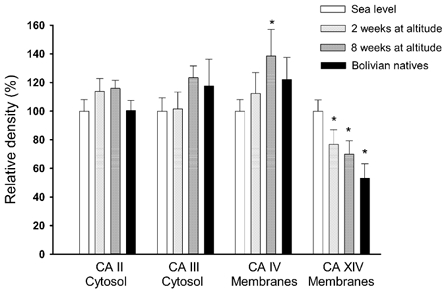
The CA isoforms CA II and CA III were quantified in the cytosolic fraction, whereas the isoforms CA IV and CA XIV were quantified in the membrane fraction. The mean values are calculated relative to the density in muscle samples obtained at sea level. Symbols as in Fig. 3. *Significantly different from sea-level values (P < 0.05).
The other membrane-bound CA, CA XIV, was decreased (P < 0.05) after both 2 and 8 weeks at altitude. In the natives the CA XIV protein density was lower (P < 0.05) than in the lowlanders at sea level. There was a positive correlation (P < 0.001) between percentage type I muscle fibre and the density of CA XIV (linear regression, r = 0.57, y = 1.7x - 5, where x is percentage myosin I). The intercept with the y-axis (approximately 5 % of mean density) was not significantly different from zero, which indicates that the CA XIV is not present or is only present at a low density in type II fibres. CA XIV is therefore an isoform specific for type I muscle fibres.
Two cytosolic CAs were quantified in muscle. The densities of CA II and CA III were not changed by altitude, and the protein levels in natives were not different from the lowlanders at sea level (Fig. 4).
Hypoxia-induced changes in erythrocyte proteins
The lactate-H+ co-transporter proteins were quantified in the purified erythrocyte membrane fraction, which only expresses the MCT1 isoform. The MCT1 content increased considerably at altitude (Fig. 5). After 2 weeks at altitude the density was increased (P < 0.05) to 330 % and after 8 weeks to 505 % compared to sea level. The MCT1 level in erythrocyte membranes obtained from the natives was 424 % compared to the lowlanders at sea level.
Figure 5. Erythrocyte enzymes and transporters.
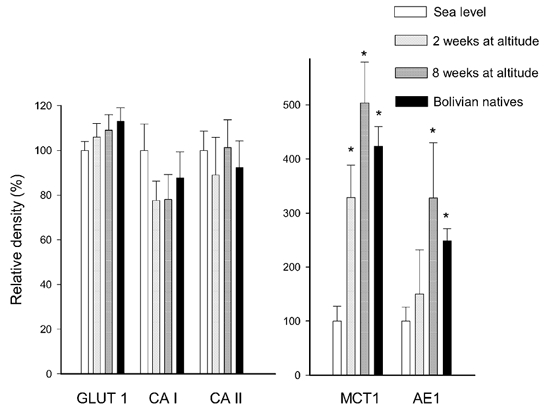
CA isoforms CA I and CA II were quantified in the cytosolic fraction of blood and calculated relative to the haemoglobin concentration. The glucose transporter GLUT1, the monocarboxylate transporter isoform MCT1 and the inorganic anion exchanger AE1 were quantified in erythrocyte membranes (arbitrary density units per milligram of membrane protein). Symbols as in Fig. 3. Note different y-axes. * Significantly different (P < 0.05) from sea-level samples.
The density of the inorganic anion exchanger, AE1 (measured with antibodies), was 150 % after 2 weeks and increased (P < 0.05) to 328 % after 8 weeks at altitude. In addition, the AE1 density in the natives was higher (249 %) compared to the lowlanders at sea level (Fig. 5). An alternative method to identify the AE1 protein required washed intact erythrocyte membranes to be labelled with [3H]H2DIDS, with the results expressed per milligram of membrane protein. Using this method the AE1 values were 209 ± 26 and 278 ± 37 % (P < 0.05) in erythrocytes from the lowlanders after 2 and 8 weeks at altitude, respectively, and 256 ± 27 % (P < 0.05) in the natives. These values are not different from the results obtained with Western blotting of dissolved membranes.
The erythrocyte CAs CA I and CA II were quantified in the cytoplasmic fraction. The mean values of the samples obtained from the lowlanders after 2 and 8 weeks at altitude and in the natives were not different from the sea level samples.
The membrane content of the glucose transporter GLUT1 was 106 ± 6 and 109 ± 7 % in the lowlanders after 2 and 8 weeks at altitude, respectively, and 113 ± 6 % in the natives (Fig. 5). Thus, GLUT1 in the erythrocyte membranes did not change with altitude.
DISCUSSION
This is the first study to investigate the collective effect of chronic hypoxia on the expression of enzymes and transporters involved in ion transport and pH regulation in human skeletal muscle and blood. The study revealed that acclimatization to high-altitude hypoxia involves moderate changes in the expression of muscle transporters with concurrent large changes in erythrocytes. The changes were not secondary to changes in fibre-type composition. The functional significance of the hypoxia-induced changes is likely to increase lactate and H+ fluxes from muscle to plasma and from plasma to erythrocytes, as well as to increase CO2 and HCO3− fluxes in erythrocytes.
Muscle CAs
CA catalyses the interconversion of CO2 and H2O to HCO3− and H+. Since there is no soluble CA activity in the plasma or interstitium, only the sarcolemmal extracellular CA is important for buffering of interstitial pH. It has been reported that extracellular CAs facilitate the lactate-H+ transport across sarcolemma by acting as an interstitial H+ acceptor (Geers & Gros, 2000; Wetzel et al. 2001). In humans, inhibition of CA has been demonstrated to be associated with a lower plasma lactate concentration during exercise (Scheuermann et al. 2000).
The activity of CAs in muscle is mediated by four isoenzymes. The membrane-bound CA IV is present in capillary endothelium of muscle, in the sarcolemma and in the sarcoplasmic reticulum (Decher et al. 1996; Wetzel et al. 2001). In the present study CA IV was found in both oxidative and glycolytic muscle fibres. The density of the CA IV protein was increased after 8 weeks at altitude. It must be noted that these changes in CA IV density in muscle cannot be localized at the subcellular level.
Another membrane-bound isoform, CA XIV, is also present in muscle (Fujikawa-Adachi et al. 1999), but the subcellular localization is unknown. In the present study CA XIV was found to be present exclusively in oxidative fibres. The CA XIV density was clearly reduced in the lowlanders after 2 and 8 weeks at altitude and in the natives compared to lowlanders at sea level. From the present data it can be concluded (with the reservation that no other CA isoforms are present) that the activity of membrane-associated CAs is increased in glycolytic fibres at altitude. The two membrane-bound anhydrases CA IV and XIV, both of which are present in oxidative fibres, were regulated in opposite directions at altitude. It is not possible, therefore, to establish whether the total activity of the membrane-bound CAs in these fibres is reduced or increased at altitude. In contrast, the cytosolic CA II and III in muscle did not change at altitude and the density in the natives was not different from the lowlanders at sea level.
There are examples from non-muscle tissue that CAs are directly coupled to other transport systems. Thus, CA II and CA IV can be coupled to the Cl−-HCO3− exchangers in some tissues (Vince et al. 1998; Sterling et al. 2002). Furthermore, CA II is coupled to some of the Na+-HCO3− co-transporter isoforms (Davis et al. 2002). It is not known whether such binding occurs between other transport systems and CAs or if this binding occurs in muscle. However, these findings raise the possibility that transport systems can be regulated by changes not in the transport system itself, but in the associated CAs. As demonstrated in the present study, hypoxia induced fibre-type-specific and opposing changes in CAs, which could result in very specific modulations of membrane transporters.
Muscle membrane transporters
Previously, one study using the [3H]ouabain-binding technique has reported a 14 % decrease in the Na+,K+-pump density 3 days after a 3 week expedition to 6194 m (Green et al. 2000). In the present study we investigated the density of all three subunits of the Na+,K+-pump present in human skeletal muscle. None of the subunits changed during the 8 weeks at altitude (4100 m) and the Bolivian natives were not different from the lowlanders.
The MCTs, MCT1 and MCT4, are predominantly responsible for lactate transport across the muscle sarcolemma (Wilson et al. 1998). MCT1 has been reported to be present in mitochondria (Brooks et al. 1999), but due to the limited number of sample we did not separate the sarcolemmal and mitochondrial pools of transporters. In the present study we found no changes with altitude of the protein density of MCT1 and MCT4 in the vastus lateralis muscles. Previously, one study in rats exposed for 8 weeks to a hypobaric hypoxic environment equivalent to 4300 m reported muscle-specific changes of up to 47 % in MCT1 and MCT4 (McClelland et al. 2002). It cannot be ruled out that similar fibre-type-dependent changes do occur in humans, as such changes may have been blunted by the mixed fibre-type composition of vastus lateralis muscles. Although the MCT density was unchanged, the changes in CA densities (see above) are likely to alter lactate and H+ transport across the sarcolemma.
Three Na+–HCO3− co-transporter (NBC) isoforms have been identified in muscle. One isoform, NBC3, has been cloned from muscle (Pushkin et al. 1999) and two other isoforms, NBC2 and NBC4c, have been found in muscle at the mRNA level (Ishibashi et al. 1998; Sassani et al. 2002). In the present study the Na+-HCO3− co-transporter proteins were measured in human skeletal muscle for the first time. We used a NBC antibody that does not discriminate between isoforms. Since the antigen sequence is present in most cloned isoforms, the antibodies are expected to recognize the majority of NBC isoforms. There was a moderate upregulation of NBC density in the lowlanders after 2 weeks at altitude. In addition, the NBC in the samples from natives was significantly higher than in the lowlanders at sea level. The highest NBC density was found in type II fibres. However, the changes in NBC distribution cannot be ascribed to altered muscle fibre types. This was supported by the myosin data demonstrating that muscle fibre-type distribution was unaltered by acclimatization.
The Na+–H+ exchanger protein NHE1 was expressed in both oxidative and glycolytic fibres. In muscle with a high percentage of glycolytic fibres the protein appears as a double band. The Na+–H+ exchanger density was elevated in samples from the natives compared to the lowlanders at sea level, which would be expected to improve the transport capacity. Furthermore, since the Na+–H+ exchange system in muscle is dependent on the pH gradient across the sarcolemma (Juel, 1998b), it is likely that the exchanger is also influenced by the activity of the CAs. However, to the best of our knowledge this has not been investigated. The changes with altitude in CA IV and XIV density (see above) could therefore be of importance for muscle pH regulation mediated by Na+–H+ exchange.
Erythrocyte proteins
The most remarkable changes in protein densities at altitude were observed in the erythrocytes. Both the lactate-H+ co-transporter and the anion exchanger were considerably upregulated at altitude. In contrast, the erythrocyte GLUT1 content did not change with altitude and therefore acted as a negative control. The level of the lactate-H+ co-transporter isoform MCT1 was approximately three- and fivefold higher after 2 and 8 weeks at altitude, respectively. In addition, the Bolivian natives had a substantially higher MCT1 level than the lowlanders at sea level. If the extra MCT1 proteins are functional, they are expected to enhance the lactate-H+ transport capacity across the erythrocyte membrane. During exercise, this movement into the erythrocyte reduces the plasma level of lactate and diminishes the pH changes associated with exercise. In normal blood there is a delay in the lactate concentration changes in red blood cells compared to the changes in plasma. The half-time for lactate equilibration across the erythrocyte membrane has been measured at approximately 50 s (Juel et al. 1990). The fivefold increase in erythrocyte MCT1 density after 8 weeks at altitude may therefore reduce the half-equilibration time to approximately 10 s. This improved uptake capacity for lactate and H+ clearly augments the ability of the erythrocytes to function as an important dilution space during intense exercise with fast changes in plasma lactate and pH. Concurrently, the storage of lactate and H+ in erythrocytes reduces the accumulation of these ions in blood plasma and thereby increases the gradients from muscle to plasma. Following on, these increases in ionic movement potentially improve the rate of release from muscle.
The strong upregulation of the erythrocyte Cl−-HCO3− exchanger (AE1) with altitude was demonstrated both by the use of antibodies and by H2DIDS labelling. H2DIDS may also label the MCT1 protein, but since AEI is by far the most abundant membrane protein in erythrocytes the changes in binding are expected to mainly represent modifications in AE1. These changes in AE1 may be of importance for the CO2 dynamics. In the present study the CAs in erythrocytes did not change at altitude. However, since the CA activity in erythrocytes is very high, the anion exchange is considered to be the rate-limiting step in the formation and elimination of bicarbonate in erythrocytes (Reitmeier, 2001). It is therefore tempting to assume that the increased level of AE1 is an adaptation that facilitates the uptake and release of CO2 in the erythrocyte. The opposite reactions take place in the lungs, where an improved erythrocyte CO2-unloading capacity could be of importance for O2 uploading.
Mechanisms underlying the altitude-induced changes in erythrocytes and muscle
The present study demonstrated that high-altitude acclimatization influences the transport capacity of the erythrocytes. The changes in erythrocyte AE1 and MCT1 proteins took place within the 1st weeks at altitude. This hypoxia-induced increase in transporter proteins may have two explanations: either an increased incorporation of transporter proteins during erythrocyte formation or an increased fraction of new erythrocytes.
Assuming that blood volume is constant, with a mean life span of 120 days for erythrocytes the more than threefold increase in MCT1 protein content after only 2 weeks at altitude could mean that the MCT1 incorporation in the new erythrocytes is increased by a factor of approximately 30. Furthermore, the finding that the MCT1 content was increased by a factor of 5 after 8 weeks at altitude, where approximately half of the erythrocytes are produced at altitude, could mean that the rate of MCT1 incorporation had decreased. Thus, the increased rate of MCT1 incorporation is likely to be transient in nature and levels off after 2–3 weeks at altitude. Alternatively, the increased mean density of transporter proteins could be due to a larger fraction of young erythrocytes. This explanation is based on the finding that haematocrit was increased at the beginning of the altitude stay. It is furthermore assumed that the densities of the AE1 and MCT1 transporters are reduced during the life-span of the single erythrocyte. This last assumption is supported by the findings that erythrocyte cell density and the density of some membrane components and enzymes are reported to undergo dramatic reductions with erythrocyte age (Piomelli & Seaman, 1993). The two explanations for the increased erythrocyte transporter densities are not exclusive. Both could be involved in the hypoxia-induced increase in erythrocyte membrane transporters in lowlanders undergoing acclimatization. In the present study both the MCT1 and the AE1 levels in erythrocytes were also elevated in the Bolivian natives living permanently at high altitude. It would seem that this finding supports the theory that more transporters are incorporated during erythrocyte formation at altitude.
It is striking that the two membrane transporters (muscle NBC and erythrocytes AE1) that have HCO3− as a substrate were upregulated in the lowlanders at altitude as well as in the natives. At an altitude of 4100 m, the arterial HCO3− concentration at rest is reduced from the 26–27 mm found at sea level to 20 mm in lowlanders at altitude and 23 mm in high-altitude natives (present study). Thus, the protein density of the two transporters seems to be negatively correlated to the blood HCO3− concentration. It can therefore be speculated that the reduced level of substrate is the common signal initiating an increased density at the protein level, a mechanism counteracting the reduced HCO3− gradient.
Extracellular pH defence
In exercise experiments, the total extracellular HCO3−-dependent and non-HCO3−-dependent pH defence against lactic acidosis can be evaluated from the ratios Δ[HCO3−]×ΔpH−1 and Δ[lactate]×ΔpH−1 (Böning et al. 2001). The last value is also called the dynamic buffer capacity. It is important to note that this ratio not only consists of the physical buffer capacity obtained by titration of plasma and red blood cells, but is also influenced by the membrane transport of H+, HCO3− and lactate from muscle to blood and from blood to other tissues during exercise. The buffer capacity has been demonstrated to increase when calculated for an incremental test before and after a Himalayan expedition (Böning et al. 2001). This effect can probably be explained by an increased amount of haemoglobin (buffer) and an increased capacity for lactate, H+ or HCO3− transport into the red blood cells after the altitude stay. In another study, the relationship between arterial lactate and arterial base deficit was used to evaluate the buffer capacity. It was concluded that the acid-base control mechanisms in natives were more effective than in lowlanders exposed to altitude for 8 weeks. The explanation for this discrepancy is more likely to be the differences in arterial pH, HCO3− and in pulmonary gas exchange (Wagner et al. 2002).
Conclusion
In conclusion, acclimatization to high altitude involves moderate changes in various transporters and enzymes in muscle and relatively large changes in erythrocytes. These changes may influence lactate and H+ fluxes from muscle to blood, from blood to erythrocytes and CO2-HCO3− fluxes in erythrocytes. In response to the specific questions raised in the introduction: (1) chronic hypoxia does change the lactate and H+ transport capacities in muscle and erythrocytes; (2) specific changes in muscle CA expression occur at altitude; (3) the transport systems mediating HCO3− transport are upregulated at altitude where the HCO3− concentration is lowered; and (4) alterations in transport systems are probably involved in the changes in dynamic buffer capacity.
Acknowledgments
The Copenhagen Muscle Research Centre is supported by the Danish National Research Foundation (grant no. 504–14).
references
- Bender PR, Groves BM, McCullough RE, McCullough RG, Trad L, Young AJ, Cymerman A, Reeves JT. Decreased exercise muscle lactate release after high altitude acclimatization. J Appl Physiol. 1989;67:1456–1462. doi: 10.1152/jappl.1989.67.4.1456. [DOI] [PubMed] [Google Scholar]
- Böning D, Maassen N, Thomas A, Steinacker JM. Extracellular pH defense against lactic acid in normoxia and hypoxia before and after a Himalayan expedition. Eur J Appl Physiol. 2001;84:78–86. doi: 10.1007/s004210000335. [DOI] [PubMed] [Google Scholar]
- Brooks GA, Brown MA, Butz CE, Sicurello JP, Dubouchaud H. Cardiac and skeletal muscle mitochondria have a monocarboxylate transporter MCT1. J Appl Physiol. 1999;87:1713–1718. doi: 10.1152/jappl.1999.87.5.1713. [DOI] [PubMed] [Google Scholar]
- Brooks GA, Butterfield GE, Wolfe RR, Groves BM, Mazzeo RS, Sutton JR, Wolfel EE, Reeves JT. Decreased reliance on lactate during exercise after acclimatization to 4300 m. J Appl Physiol. 1991;71:333–341. doi: 10.1152/jappl.1991.71.1.333. [DOI] [PubMed] [Google Scholar]
- Brooks GA, Wolfel EE, Groves BM, Bender PR, Butterfield GE, Cymerman A, Mazzeo RS, Sutton JR, Wolfe RR, Reeves JT. Muscle accounts for glucose disposal but not blood lactate appearance during exercise after acclimatization to 4300 m. J Appl Physiol. 1992;72:2435–2445. doi: 10.1152/jappl.1992.72.6.2435. [DOI] [PubMed] [Google Scholar]
- Davis BA, Choi I, Rojas JD, Virkki LV, Boron WF. Binding of carbonic anhydrase II to C termini of the Na-coupled HCO3 transporter NBCe1, NBCn1 and NDCBE1. FASEB J. 2002;16:621.7 (abstract). [Google Scholar]
- Decher B, Sender S, Gros G. Membrane-associated carbonic anhydrase IV in skeletal muscle - subcellular localization. Histochem Cell Biol. 1996;106:405–411. doi: 10.1007/BF02473299. [DOI] [PubMed] [Google Scholar]
- Fujikawa-Adachi K, Nishimori I, Taguchi T, Onishi S. Human carbonic anhydrase XIV (CA14): cDNA cloning, mRNA expression, and mapping to chromosome 1. Genomics. 1999;61:74–81. doi: 10.1006/geno.1999.5938. [DOI] [PubMed] [Google Scholar]
- Geers C, Gros G. Carbon dioxide transport and carbonic anhydrase in blood and muscle. Physiol Rev. 2000;80:681–715. doi: 10.1152/physrev.2000.80.2.681. [DOI] [PubMed] [Google Scholar]
- Green H, Roy B, Grant S, Burnett M, Tupling R, Otto C, Pipe A, McKenzie D. Downregulation in muscle Na+–K+-ATPase following a 21-day expedition to 6194 m. J Appl Physiol. 2000;88:634–640. doi: 10.1152/jappl.2000.88.2.634. [DOI] [PubMed] [Google Scholar]
- Ishibashi K, Sasaki S, Marumo F. Molecular cloning of a new sodium bicarbonate cotransporter cDNA from human retina. Biochim Biophys Res Commun. 1998;246:535–538. doi: 10.1006/bbrc.1998.8658. [DOI] [PubMed] [Google Scholar]
- Juel C. Lactate/H+ co-transport in skeletal muscle: regulation and importance for pH homeostasis. Acta Physiol Scand. 1996;156:369–374. doi: 10.1046/j.1365-201X.1996.206000.x. [DOI] [PubMed] [Google Scholar]
- Juel C. Muscle pH regulation: role of training. Acta Physiol Scand. 1998a;162:359–366. doi: 10.1046/j.1365-201X.1998.0305f.x. [DOI] [PubMed] [Google Scholar]
- Juel C. Skeletal muscle Na+/H+ exchange in rats: pH dependency and the effect of training. Acta Physiol Scand. 1998b;164:135–140. doi: 10.1046/j.1365-201X.1998.00417.x. [DOI] [PubMed] [Google Scholar]
- Juel C. Expression of the Na+/H+ exchanger isoform NHE1 in rat skeletal muscle and effect of training. Acta Physiol Scand. 2000;170:59–63. doi: 10.1046/j.1365-201x.2000.00759.x. [DOI] [PubMed] [Google Scholar]
- Juel C, Bangsbo J, Graham T, Saltin B. Lactate and potassium fluxes from human skeletal muscle during and after intense, dynamic, knee extensor exercise. Acta Physiol Scand. 1990;140:147–159. doi: 10.1111/j.1748-1716.1990.tb08986.x. [DOI] [PubMed] [Google Scholar]
- McClelland GB, Brooks GA. Changes in MCT 1, MCT 4, and LDH expression are tissue specific in rats after long-time hypobaric hypoxia. J Appl Physiol. 2002;92:1573–1584. doi: 10.1152/japplphysiol.01069.2001. [DOI] [PubMed] [Google Scholar]
- Maltais F, Jobin J, Sullivan MJ, Bernard S, Whittom F, Killian KJ, Desmeules M, Belanger M, Leblanc P. Metabolic and hemodynamic responses of lower limb during exercise in patients with COPD. J Appl Physiol. 1998;84:1573–1580. doi: 10.1152/jappl.1998.84.5.1573. [DOI] [PubMed] [Google Scholar]
- Okita K, Yonezawa K, Nishijima H, Hanada A, Ohtsubo M, Kohya T, Murakami T, Kitabatake A. Skeletal muscle metabolism limits exercise capacity in patients with chronic heart failure. Circulation. 1998;98:1886–1891. doi: 10.1161/01.cir.98.18.1886. [DOI] [PubMed] [Google Scholar]
- Piomelli S, Seman C. Mechanisms of red blood cell aging: relationship of cell density and cell age. Am J Hematol. 1993;42:46–52. doi: 10.1002/ajh.2830420110. [DOI] [PubMed] [Google Scholar]
- Price NT, Jackson VN, Halestrap AP. Cloning and sequencing of four new mammalian monocarboxylate transporter (MCT) homologues confirm the existence of transporter family with an ancient past. Biochem J. 1998;329:321–328. doi: 10.1042/bj3290321. [DOI] [PMC free article] [PubMed] [Google Scholar]
- Pushkin A, Abuladze N, Lee I, Newman D, Hwang J, Kurtz I. Cloning, tissue distribution, genomic organization, and functional characterization of NBC3, a new member of the sodium bicarbonate co-transporter family. J Biol Chem. 1999;274:116569–16575. doi: 10.1074/jbc.274.23.16569. [DOI] [PubMed] [Google Scholar]
- Reitmeier RAF. A membrane metabolon linking carbonic anhydrase with chloride/bicarbonate anion exchangers. Blood Cells Mol Dis. 2001;27:85–89. doi: 10.1006/bcmd.2000.0353. [DOI] [PubMed] [Google Scholar]
- Sassani P, Pushkin A, Gross E, Gomer A, Abuladze N, Dukkipati R, Cerpenito G, Kurtz I. Functional characterization of NBC4: a new electrogenic sodium-bicarbonate cotransporter. Am J Physiol. 2002;282:C408–416. doi: 10.1152/ajpcell.00409.2001. [DOI] [PubMed] [Google Scholar]
- Scheuermann BW, Kowalchuk JM, Paterson DH, Cunningham DA. Carbonic anhydrase inhibition delays plasma lactate appearance with no effect on ventilatory threshold. J Appl Physiol. 2000;88:713–721. doi: 10.1152/jappl.2000.88.2.713. [DOI] [PubMed] [Google Scholar]
- Shami Y, Rothstein A, Knauf PA. Identification of the Cl− transport site in human red blood cells by a kinetic analysis of the inhibitory effects of a chemical probe. Biochim Biophys Acta. 1978;508:357–363. doi: 10.1016/0005-2736(78)90337-1. [DOI] [PubMed] [Google Scholar]
- Smerdu V, Karch-Mizachi I, Campoine M, Leinwand LA, Schiaffino S. Type IIx myosin heavy chain transcripts are expressed in type IIb fibres in human skeletal muscle. Am J Physiol. 1994;267:C1723–1728. doi: 10.1152/ajpcell.1994.267.6.C1723. [DOI] [PubMed] [Google Scholar]
- Sterling D, Alvarez BV, Casey JR. The extracellular component of a transport metabolon: Extracellular loop 4 of the human AE1 Cl−/HCO3− exchanger binds carbonic anhydrase IV. J Biol Chem. 2002;277:25239–25246. doi: 10.1074/jbc.M202562200. [DOI] [PubMed] [Google Scholar]
- Van Hall G, Calbet JAL, Sødergaard H, Saltin B. The re-establishment of the normal blood lactate response to exercise in humans after prolonged acclimatization to altitude. J Physiol. 2001;536:963–975. doi: 10.1111/j.1469-7793.2001.00963.x. [DOI] [PMC free article] [PubMed] [Google Scholar]
- Vince JW, Reithmeier RA. Carbonic anhydrase II binds to the carboxyl-terminus of human band 3, the erythrocyte Cl−/HCO3− exchanger. J Biol Chem. 1998;273:28430–28437. doi: 10.1074/jbc.273.43.28430. [DOI] [PubMed] [Google Scholar]
- Wagner PD, Araoz M, Boushel R, Calbet JAL, Jessen B, Rådegran J, Spielvogel H, Sødergaard H, Wagner H, Saltin B. Pulmonary gas exchange and acid-base state at 5,260 m in high-altitude Bolivians and acclimatized lowlanders. J Appl Physiol. 2002;92:1393–1400. doi: 10.1152/japplphysiol.00093.2001. [DOI] [PubMed] [Google Scholar]
- Waheed A, Zhu XL, Sly WS, Wetzel P, Gros G. Rat skeletal muscle membrane associated carbonic anhydrase is 39-kDa, glycosylated, GPI-anchored CA IV. Arch Biochem Biophys. 1992;294:550–556. doi: 10.1016/0003-9861(92)90724-b. [DOI] [PubMed] [Google Scholar]
- Wetzel P, Hasse A, Papadopoulos S, Voipio J, Kaila K, Gros G. Extracellular carbonic anhydrase activity facilitates lactic acid transport in rat skeletal muscle fibers. J Physiol. 2001;531:743–756. doi: 10.1111/j.1469-7793.2001.0743h.x. [DOI] [PMC free article] [PubMed] [Google Scholar]
- Wilson MC, Jackson VN, Heddle C, Price NT, Pilegaard H, Juel C, Bonen A, Montgommery I, Hutter OF, Halestrap AP. Lactic acid efflux from white skeletal muscle is catalyzed by the monocarboxylate transporter isoform MCT3. J Biol Chem. 1998;273:15920–15926. doi: 10.1074/jbc.273.26.15920. [DOI] [PubMed] [Google Scholar]