

Abstract
Flux through anaplerotic pathways in skeletal muscle has not been evaluated quantitatively during both rest and contraction, nor have fibre type-specific rates of anaplerotic flux been studied. Steady-state analysis using 13C NMR spectroscopy enables calculation of Y (flux rate through anaplerotic pathways relative to tricarboxylic acid (TCA) cycle flux). Under inhalation anaesthesia, [2,4,6,8-13C4]octanoate was infused into the jugular vein of the intact rat (n = 10) and the sciatic nerve of one limb was stimulated at the voltage required to elicit maximal force output at 0.5 Hz. In resting muscle, Y was higher in soleus (0.41 ± 0.22) versus white gastrocnemius (WG) (0.18 ± 0.11). Y was 0.29 ± 0.06 in the predominantly red portion of the gastrocnemius (RG) during rest. During contraction, Y was similar to the resting value in soleus (0.34 ± 0.14), RG (0.20 ± 0.04) and WG (0.15 ± 0.08); Y was higher in soleus versus both RG and WG during contraction. These results demonstrate: (1) relative flux through anaplerotic pathways is 15–41 % of TCA cycle flux at rest and during muscle contraction, (2) higher relative anaplerotic flux in oxidative (soleus) versus glycolytic muscle (WG) during rest and in slow-twitch (soleus) versus fast-twitch (RG and WG) muscle during contraction, and (3) relative flux through anaplerotic pathways is maintained in all muscle fibre types during contraction, which indicates that absolute rates of anaplerotic flux rise in proportion to increased oxidation rates during contraction. These results are consistent with a sustained increase in substrate entry into and exit from the TCA cycle through anaplerotic pathways during contraction.
Carbon may enter the tricarboxylic acid (TCA) cycle via acetyl-CoA and through use of anaplerotic pathways in muscle (Fig. 1). From rest to maximal exercise, skeletal muscle is capable of increasing carbon flux through the TCA cycle by almost 100-fold (Gibala et al. 1998). Although TCA cycle intermediates (TCAI) have been demonstrated to increase with exercise (Aragón & Lowenstein, 1980; Gibala et al. 1997), the magnitude of this increase does not provide information about the rate of anaplerotic flux in relation to the rate of oxidative entry of substrate into the TCA cycle during contraction. Data regarding rates of flux through anaplerotic pathways relative to TCA cycle flux at rest are sparse, and no studies have quantified rates of anaplerotic flux during muscle contraction or examined the influence of differing muscle fibre types.
Figure 1. Pathways and sources of substrates entering the TCA cycle.

Carbohydrates and fats are the primary substrates of muscle (Gollnick & Saltin, 1988; Saltin & Gollnick, 1988) and contribute to oxidative metabolism via oxidation through acetyl-CoA. Other biochemical pathways that can be used to increase TCA cycle intermediates in skeletal muscle are depicted and include pyruvate carboxylation and the alanine aminotransferase reaction. α-kg, α-ketoglutarate.
13C magnetic resonance spectroscopy (MRS) techniques allow calculation of relative flux rates through multiple pathways as well as permitting detection of successive biochemical events (Sherry & Malloy, 1996). Analysis of the 13C isotope isomers (isotopomers) of glutamate has been central in the development of complex analysis models for calculating TCA cycle flux and the rate of flux through anaplerotic pathways (Sherry & Malloy, 1998). The use of 13C analysis methods to determine anaplerotic flux through combined anaplerotic reactions relative to TCA cycle flux (Y) is well established (Jeffrey et al. 1996; Jones et al. 1997; Malloy et al. 1987, 1988; Szczepaniak et al. 1996). The Y value reflects flux through metabolic pathways other than citrate synthase entering the TCA cycle, as well as flux through cataplerotic reactions exiting the TCA cycle, which are equal at metabolic steady state. Calculation of Y requires that the tissue being measured has achieved 13C isotopic steady state (ISS), which refers to the metabolic condition when the quantity of 13C label entering the TCA cycle is equivalent to 13C label exiting the TCA cycle. In tissue undergoing metabolic transition (e.g. due to a change in substrate availability or the onset of contraction), ISS will occur after TCA cycle fluxes and TCAI concentrations have reached their new metabolic steady state (Malloy et al. 1988). In 13C studies, ISS is indicated by no change in 13C spectra at sequential time points, and no difference in non-steady-state versus steady-state isotopomer analysis at a given time point (Malloy et al. 1987; Szczepaniak et al. 1996).
Previous studies in resting skeletal muscle of mixed fibre type have reported relative anaplerotic flux values (Y) ranging from 0.18 to 0.26 (Szczepaniak et al. 1996; Jucker et al. 1997; Mezzarobba et al. 2000). However, relative anaplerotic flux has not been determined in muscle fibre types of differing oxidative capacity. Additionally, the effect of muscle contraction upon levels of relative anaplerotic flux in muscle of differing fibre composition is unknown. TCA cycle intermediate concentrations rise at the onset of exercise (Aragón & Lowenstein, 1980; Gibala et al. 1997, 1998), presumably due to increased anaplerotic influx. It is not known if anaplerotic flux remains high throughout the exercise period or if this flux returns to basal (rested) values once the muscle has achieved its new contracting metabolic steady state. We hypothesized that absolute anaplerotic flux would be higher during sustained steady-state contraction than during rest, which would be reflected in a similar or higher relative anaplerotic flux value (Y) in contracted muscle. To address these issues, we evaluated relative anaplerotic flux in muscle of differing fibre types at rest and during muscle contraction in the intact rat.
METHODS
All experimental procedures were approved by the Institutional Animal Care and Use Committee at the Veterans Affairs North Texas Health Care System (VANTHCS) and conformed with national guidelines.
Experimental design
We used octanoate as a tool to examine relative anaplerotic flux in rested and contracted predominantly red (RG) and white (WG) gastrocnemius and soleus muscle. Preliminary work demonstrated that only contracted WG muscle achieves ISS by 60 min of octanoate infusion. Therefore, we infused [2,4,6,8-13C4]octanoate into the jugular vein of the intact rat for 90 or 105 min to examine relative flux through anaplerotic pathways in gastrocnemius and soleus muscles during rest and during a contraction protocol of moderate intensity.
Initially, 220 mm unlabelled sodium octanoate (Aldrich, Milwaukee, WI, USA) was infused at a rate of 2.67 ml h−1. At time zero (after approximately 30 min of unlabelled octanoate infusion), the infusate was changed to 220 mm sodium [2,4,6,8-13C4]octanoate (Cambridge Isotope Laboratories (CIL), Andover, MA, USA) and the muscles of the left limb were contracted via direct electrical stimulation to the sciatic nerve. The muscles of the non-contracted right limb were considered resting and results in these muscles were compared to the contralateral contracted muscles.
Animal preparation
Male Sprague-Dawley rats (343.2 ± 20 g, Charles River, Kingston, MA, USA) were housed in the VANTHCS Animal Resources Centre with a 12 h-12 h light-dark cycle and had access to water and lab chow ad libitum.
Rats were weighed and anaesthetized with an intraperitoneal injection of 1–3 ml kg−1 ketamine-xylazine mixture (6 mg ml−1 xylazine, 94 mg ml−1 ketamine). After a tracheotomy was performed, 1–3 % isoflurane (Isotec 3 vaporizer, Matrx Medical Inc., Buffalo, NY, USA) in a 100 % O2 mixture was used to maintain anaesthesia and was delivered via a positive pressure ventilator (model 683 Small Animal Ventilator, Harvard Apparatus Inc., South Natick, MA, USA) at a rate of 1.25 ml min−1, ∼100 breaths min−1. The right carotid artery was catheterized and connected to a fluid-filled pressure transducer (model P23XL Gould Transducer, Future Tech, Birmingham, AL, USA) to continuously monitor heart rate and blood pressure throughout the surgical procedure. Systemic arterial blood gases were monitored using a blood gas analyser (ABL-4, Radiometer, Westlake, OH, USA). The gas mixture and/or ventilation rate was adjusted to maintain physiological blood pH (end pH 7.3 ± 0.09) and arterial O2 saturation to > 99%. Following arterial cannulation, the jugular vein was cannulated and connected to an infusion pump (model 22, Harvard Apparatus Inc., South Natick, MA, USA) for the administration of labelled and unlabelled octanoate. Temperature was maintained at 37 °C with an external heating pad placed under the rat, in combination with the heat radiating from the incandescent light source illuminating the surgical field. Both calcaneal tendons and the left sciatic nerve pocket were surgically isolated. The left sciatic nerve was bathed in mineral oil and isolated from surrounding tissue. The left calcaneal tendon was attached to a force transducer (Grass model FT-10, New Astromed Inc., West Warwick, RI, USA) and the output was recorded using PolyVIEW software (Grass, New Astromed Inc., West Warwick, RI, USA). Nerve viability was maintained by regular topical application of mineral oil during the remainder of the experiment. Custom-built silver electrodes connected to an electrical stimulator and isolation unit (Grass models S88 and S7, New Astromed Inc., West Warwick, RI, USA) were used to deliver 100 ms trains of pulses (100 Hz, 0.2 ms duration, no delay) at the voltage required to elicit maximal force output (3.2–5.0 V) at 0.5 Hz for 90 or 105 min. Force drop-off to 85 ± 17 % of the original value occurred by the end of the experiment. At the end of 90 or 105 min of 13C-octanoate infusion, gastrocnemius and soleus muscles were isolated from the contracted hindlimb, and then from the contralateral resting hindlimb. Isolated tissue was immediately frozen in liquid nitrogen and stored at −80 ° C until extraction. The rat was killed by removal of the heart under deep anaesthesia.
Tissue preparation
Immediately prior to extraction, gastrocnemius muscles were immersed in ice-cold saline and separated into white (primarily type IIb fibres; Dyck et al. 1997) and predominantly red (mostly type IIa muscle fibres; Dyck et al. 1997) components. The soleus (mainly type I muscle fibres; Dyck et al. 1997) and gastrocnemius muscles were extracted by homogenization with a motor-driven tissue grinder (model 985–370, Biospec Products Inc., Bartlesville, OK, USA) in ice-cold 3.6 % perchloric acid, and spun for 15 min at 20 000 g. The supernatant was neutralized with a 22:78 solution of tri-n-octylamine:chloroform, spun for 15 min at 20 000 g, and lyophilized overnight in a rotary evaporator (speedvac: Savant Instruments Inc., Farmingdale, NY, USA; Flexi-Dry microprocessor lyophilizer: FTS Systems, Stone Ridge, NY, USA). The lyophilate was then brought to a volume of approximately 550 μl in deuterium oxide (CIL).
NMR spectroscopy
Proton-decoupled 13C NMR spectra of the tissue extracts were collected at 37 °C on a Varian INOVA 600 MHz spectrometer (Varian Inc, Palo Alto, CA, USA) in a 5 mm broadband probe using a 30 000 sweep width, 45 deg pulse, 1.5 s pulse delay, and bilevel proton decoupling. Since the longitudinal relaxation time (T1) of the protonated carbons is less than 1 s no correction for partial saturation was necessary using these pulsing conditions. To achieve adequate signal-to-noise, the number of scans acquired was typically 8000 for the predominantly red portion of the gastrocnemius muscle, 10 000 for soleus muscle, and 12 000 for the white portion of the gastrocnemius muscle. Free induction decays were baseline corrected and multiplied by an exponential function prior to Fourier transformation; 0.5 Hz line broadening was used for all extracts. The areas and intensities of all 13C spectra were quantified using a curve-fitting program (NUTS, Acorn Inc., Livermore, CA, USA). The line fit was considered adequate if the difference spectra were indistinguishable from spectral regions with no visible peaks. Each multiplet area was normalized and reported as a fraction of the total area for that specific carbon resonance.
13C isotopomer and pathway flux analysis
Steady-state isotopomer analysis (Malloy et al. 1987, 1988) was used to determine flux through combined anaplerotic reactions relative to TCA cycle flux (Y) as well as acetyl-CoA fractional enrichments. Isotopomer analysis is based on the evolution of 13C label in glutamate, which is in rapid exchange with the TCA cycle intermediate, α-ketoglutarate. By examining the 13C spectra of gastrocnemius and soleus muscles and determining: (1) the fractional contribution of multiplet areas within a given glutamate carbon resonance and (2) ratios of all peak areas in different glutamate carbons, Y and acetyl-CoA fractional enrichments can be ascertained. In these experiments, metabolism of the exogenously administered [2,4,6,8-13C4]octanoate is such that only carbon 2 of the acetyl-CoA pool is labelled. The fractional contribution of this singly labelled acetyl-CoA (in carbon 2) to the entire acetyl-CoA pool is designated FC2. FC0 represents the remaining fraction of the unlabelled acetyl-CoA pool coming from unlabelled sources. Determination of isotopic steady state was accomplished by comparing differences in the calculated fractional enrichment values using non-steady-state (Malloy et al. 1990) versus steady-state (Malloy et al. 1987, 1988) analysis at a given time point as well as comparing steady-state values at different time points. We used the following non-steady-state equation to calculate FC2: FC2= (C4/C3)(C4D34) (Malloy et al. 1990), where C4/C3 represents the ratio of the area under all of the peaks in the glutamate carbon 4 region versus those of the glutamate carbon 3 resonance, and C4D34 refers to the fractional contribution of the doublet 34 (arising from carbon-carbon coupling of carbons 3 and 4 of glutamate) to the entire peak area of the glutamate carbon 4 region. The contribution to the acetyl-CoA pool from endogenous unlabelled sources (FC0) was calculated using the non-steady-state equation: FC0= 1 –FC2 (Malloy et al. 1990). Steady-state values were obtained using the program TCAcalc (http://www2.swmed.edu/rogersmr/available-products.htm), a program which analyses a set of simultaneous non-linear equations to solve for relative fluxes through pathways intersecting the TCA cycle (Malloy et al. 1988; Jeffrey et al. 1996). Since neither 13C-octanoate nor the possible 13C-ketones arising from ketogenesis of 13C-octanoate can enter the TCA cycle through anaplerotic pathways, all flux through these pathways was due to unlabelled endogenous substrate(s). This simplifies the calculation of Y: Y =A/C = ((C4/C3) – 1)/2 (Malloy et al. 1987), where A represents flux through anaplerotic pathways and C refers to TCA cycle flux.
Statistics
Results are reported as means ±s.d. A two-factor repeated measures ANOVA was used (α= 0.05) followed if necessary by a Tukey's honestly significant difference test with a confidence range of 95 %. n = 5 for each data point except reported Y values: once it was determined that all muscles had achieved isotopic steady state by 90 min, Y was calculated using data from both 90 and 105 min data (n = 10).
RESULTS
Establishment of isotopic steady state
Representative 13C spectra of extracts of rested and contracted gastrocnemius and soleus muscle infused with [2,4,6,8-13C4]octanoate for 90 or 105 min are shown in Fig. 2A–F. The glutamate carbon 2 (C2), C3 and C4 regions are shown in each panel (Fig. 2). 13C label from the exogenously administered [2,4,6,8-13C4]octanoate was avidly incorporated into all of these muscles, resulting in multiple peaks (multiplets) in each resonance area. There were no visible differences between the spectra from 90 versus 105 min 13C-labelled octanoate infusions (Fig. 2), suggesting that ISS had been reached by 90 min in all muscles examined.
Figure 2. 13C spectra from rested and contracted gastrocnemius and soleus muscles.
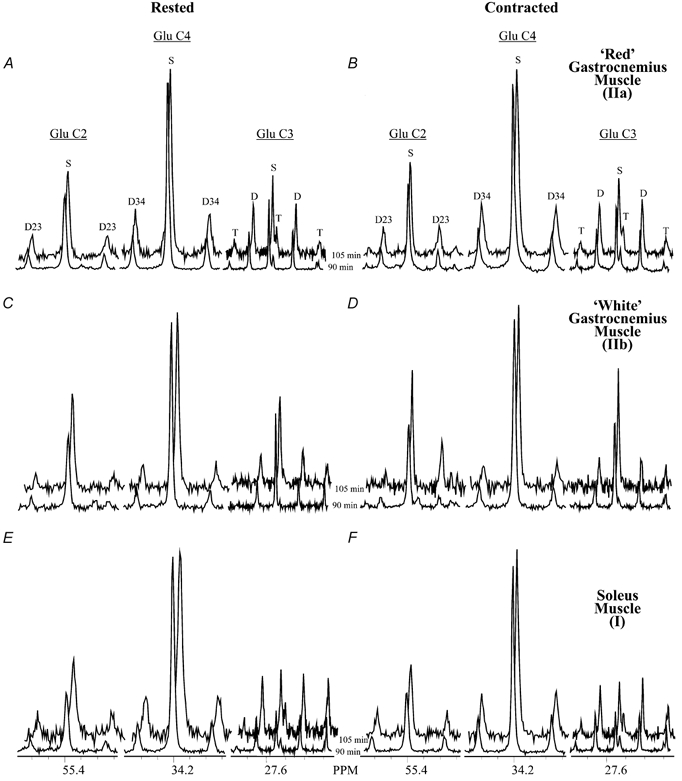
Glutamate carbon 2 (C2), C4 and C3 resonances are shown from 13C spectra of representative extracts of rested and contracted muscles infused with [2,4,6,8-13C4]octanoate for 90 or 105 min. A and B, predominantly red rested (A) and contracted (B) gastrocnemius muscle (IIa); C and D, rested (C) and contracted (D) white gastrocnemius muscle (IIb); E and F, rested (E) and contracted (F) soleus muscle (I). Visible multiplets are as follows: the C2 singlet (S) and the doublet resulting from carbon-carbon coupling of carbons 2 and 3 (D23) in the glutamate C2 region, the C4S and doublet 34 (D34) in the glutamate C4 area, and the S, D and triplet (T) in the glutamate C3 region.
Fractional enrichment of acetyl-CoA pools was calculated using non-steady-state and steady-state isotopomer analysis for 90 and 105 min 13C-labelled octanoate infusions (Table 1). Metabolism of 13C-labelled octanoate accounted for about half of acetyl-CoA production (FC2) in soleus (mainly type I muscle fibres) and predominantly red gastrocnemius muscle (mostly type IIa muscle fibres) during both rest and contraction; this was higher than the contribution of 25–30 % in rested and contracted white gastrocnemius muscle (primarily type IIb fibres) (Table 1). There were no differences in FC2 or the fractional contribution of endogenous unlabelled substrates (FC0) to the acetyl-CoA pool using the non-steady-state versus steady-state analysis at either the 90 or 105 min infusion times (Table 1). Additionally, no differences were found using non-steady-state or steady-state isotopomer analysis in the 90 versus 105 min infusion times in any of the muscles examined (Table 1). These combined data establish that ISS occurs by 90 min in rested and contracted gastrocnemius and soleus muscles.
Table 1.
Non-steady-state and steady-state analyses after infusion of [2,4,6,8-13C4]octanoate for 90 or 105 min
| Gastrocnemius | ||||||
|---|---|---|---|---|---|---|
| Red (IIa) | White (IIb) | Soleus (I) | ||||
| Rested | Contracted | Rested | Contracted | Rested | Contracted | |
| Non-steady-state analysis (90 min) | ||||||
| FC2 | 0.502 ± 0.067b | 0.483 ± 0.050b | 0.296 ± 0.018ac | 0.278 ± 0.065ac | 0.516 ± 0.15b | 0.550 ± 0.072b |
| FCO | 0.498 ± 0.067b | 0.517 ± 0.050b | 0.704 ± 0.018ac | 0.722 ± 0.065ac | 0.484 ± 0.15b | 0.450 ± 0.072b |
| Steady-state analysis (90 min) | ||||||
| FC2 | 0.442 ± 0.063b | 0.432 ± 0.043b | 0.274 ± 0.044ac | 0.265 ± 0.046ac | 0.482 ± 0.11b | 0.477 ± 0.089b |
| FCO | 0.558 ± 0.063b | 0.568 ± 0.043b | 0.726 ± 0.044ac | 0.735 ± 0.046ac | 0.518 ± 0.11b | 0.523 ± 0.089b |
| Non-steady-state analysis (105 min) | ||||||
| FC2 | 0.592 ± 0.12b | 0.526 ± 0.071b | 0.250 ± 0.035ac | 0.258 ± 0.10ac | 0.594 ± 0.099b | 0.588 ± 0.11b |
| FCO | 0.408 ± 0.12b | 0.474 ± 0.071b | 0.750 ± 0.035ac | 0.742 ± 0.10ac | 0.406 ± 0.099b | 0.412 ± 0.11b |
| Steady-state analysis (105 min) | ||||||
| FC2 | 0.489 ± 0.070b | 0.469 ± 0.051b | 0.252 ± 0.030ac | 0.285 ± 0.072ac | 0.555 ± 0.089b | 0.550 ± 0.072b |
| FCO | 0.511 ± 0.070b | 0.531 ± 0.051b | 0.748 ± 0.030ac | 0.715 ± 0.072ac | 0.445 ± 0.089b | 0.450 ± 0.072b |
Results are listed as means ±s.d. (n = 5). FC2 represents the fractional enrichment of the acetyl-CoA pool from metabolism of [2,4,6,8-13C4]octanoate and FCO corresponds to the contribution from unlabelled endogenous substrates to the acetyl-CoA pool. No differences were found between non-steady-state and steady-state analyses in either 90 or 105 min infusions, nor were any differences found in 90 versus 105 min non-steady-state or steady-state values.
Different from predominantly red gastrocnemius muscle type Ha (Ha) same condition (rested or contracted)
different from white gastrocnemius muscle type IIb (IIb) same condition
different from soleus muscle same condition.
Relative anaplerotic flux during rest and contraction
Once it was determined that isotopic steady state had been achieved in rested and contracted gastrocnemius and soleus muscle, steady-state isotopomer analysis was used to determine flux through combined anaplerotic reactions relative to TCA cycle flux (Y). At rest, flux through anaplerotic pathways was 18–41 % of TCA cycle flux in skeletal muscle (Table 2). Y was higher in oxidative muscle (fibre type I) than in glycolytic muscle (fibre type IIb) with Y from fibre type IIa falling between the two (Table 2). During contraction, relative anaplerotic flux remained high (Table 2). Y was not different from rest in any of the muscles examined (Table 2). During contraction Y was higher in slow-twitch (soleus) than in fast-twitch (gastrocnemius) muscle (Table 2).
Table 2.
Relative anaplerotic flux (Y) in gastrocnemius and soleus muscles after infusion of [2,4,6,8-13C4]octanoate
| Gastrocnemius | ||||||
|---|---|---|---|---|---|---|
| Red (IIa) | White (IIb) | Soleus (I) | ||||
| Rested | Contracted | Rested | Contracted | Rested | Contracted | |
| Y | 0.29 ± 0.06 | 0.20 ± 0.04c | 0.18 ± 0.11c | 0.15 ± 0.08c | 0.41±0.22b | 0.34±0.14ab |
Results are listed as means ±s.d. (n = 10). Y depicts flux through anaplerotic pathways relative to TCA cycle flux.
Different from predominantly red gastrocnemius muscle type IIa (IIa) same condition (rested or contracted)
different from white gastrocnemius muscle type IIb (IIb) same condition
different from soleus muscle same condition.
DISCUSSION
The main findings of this study were: (1) flux through anaplerotic pathways was 18–41 % of TCA cycle flux at rest, with higher relative anaplerotic flux in oxidative versus glycolytic fibre types (Table 2), (2) fibre type differences in rates of relative anaplerotic flux persisted during muscle contraction with higher levels in soleus compared to predominantly red and white gastrocnemius (Table 2), and (3) during contraction, Y is maintained in soleus and gastrocnemius muscle (Table 2), indicating that absolute rates of anaplerotic flux rise in proportion to increased oxidation rates during contraction.
Relative anaplerotic flux in the different muscles examined ranged from 0.18–0.41 at rest after infusion with 13C-octanoate (Table 2). Results from previous studies in resting skeletal muscle using 13C-acetate showed relative anaplerotic flux values of 0.18 in combined quadriceps and gastrocnemius muscle (Jucker et al. 1997), 0.21 in mixed biceps femoris and tibialis anterior (Mezzarobba et al. 2000), and 0.26 in biceps femoris (Szczepaniak et al. 1996), which are in the lower range of our results (Table 2). During rest, Y is higher in oxidative versus glycolytic fibre types (Table 2), thus the lower range reported previously in resting muscle of mixed fibre type is probably due to the preponderance of type IIb fibres in the muscles examined.
The metabolic basis of increased flux through anaplerotic pathways relative to TCA cycle flux in oxidative versus glycolytic muscle fibres is uncertain. Enzymes believed to be critical for normal anaplerosis are mitochondrial (e.g. pyruvate carboxylase) or have mitochondrial as well as cytoplasmic forms (e.g. alanine aminotransferase), and higher levels of mitochondria and mitochondrial enzymes are characteristic of more oxidative muscle fibres. However, there are no data to our knowledge that indicate that there is greater expression of these enzymes per unit of mitochondria in oxidative muscle. It may be that many of the anaplerotic enzymes are regulated by substrate availability in vivo. Maximal enzyme activity assays performed on muscle homogenates in vitro primarily reflect the quantity of the active enzyme present and are not sensitive to substrate regulation. It remains to be determined which intrinsic characteristics of the different skeletal muscles examined contribute to the observed fibre type-specific anaplerotic flux rates during rest.
Many studies have examined the increase in TCAI at the onset of exercise (Aragón & Lowenstein, 1980; Sahlin et al. 1990; Gibala et al. 1997, 1998) but none have quantified the anaplerotic flux that produces these dramatic changes in muscle. It has been speculated that the increase in TCAI is a function of pyruvate availability and not of much functional significance to TCA cycle flux (Gibala et al. 1998; Graham & Gibala, 1998; Constantin-Teodosiu et al. 1999). The initial increased utilization of anaplerotic pathways at the onset of exercise may be related to excess pyruvate availability. However, if pyruvate availability were the prevailing determinant of flux through anaplerotic pathways, it would be expected that, once a new metabolic steady state was reached, flux through anaplerotic pathways would revert to original values. Although our study does not examine events in the initial minutes of muscle contraction, maintained relative flux through anaplerotic pathways was observed in soleus and gastrocnemius muscle during a contracting metabolic steady state (Table 2). These results indicate there is a sustained increase in the absolute rate of anaplerotic flux that is proportional to the increase in oxidation rate during contraction.
Absolute anaplerotic flux rates can be calculated using estimates of oxygen consumption based on previous results using a similar protocol (Hood et al. 1986). Oxygen consumption attributed to WG muscle was calculated to be 4-fold higher than that of the rested muscle, while oxygen consumption ascribed to RG muscle was calculated to increase approximately 20-fold during contraction (Hood et al. 1986). Blood flow and oxygen delivery were slightly higher in soleus versus RG muscle (Hood et al. 1986), therefore it is likely that soleus would have the same or higher oxygen consumption as RG muscle. Oxygen consumption is related to TCA cycle flux by a proportionality factor (R). R varies depending on the substrate being oxidized and considers the stoichiometry of O2 consumed to the reducing equivalents generated in the production of a single acetyl-CoA unit (from a given substrate) and its subsequent oxidation by the TCA cycle. R for these experiments can be described by the equation: Rtotal=FC0R0+FC2R2 (Malloy et al. 1996), where the FC0R0 term reflects endogenous unlabelled substrate contribution and the FC2R2 term arises from 13C-labelled octanoate. For octanoate R2 is 2.75 (Malloy et al. 1996). If all of the unlabelled endogenous substrate oxidized (FC0) is considered to have come from carbohydrate (i.e. glucose, glycogen, and/or lactate), R0 is 3. Rtotal was 2.88 and 2.89 for the predominantly red portion of the gastrocnemius muscle during rest and contraction, respectively. Rtotal was the same during rest and contraction for the white portion of the gastrocnemius and soleus (2.93 and 2.87, respectively). R values will be underestimated to the extent that substrate other than carbohydrate contributed to the unlabelled fraction (FC0) of oxidative energy production. With these R values and fold oxygen consumption reported by Hood et al. (1986), Y values (Table 2) can be used to calculate increases in absolute anaplerotic flux. Flux through anaplerotic pathways increases similarly to that of TCA cycle flux and oxygen consumption, with a 3.3-fold increase in the white portion of the gastrocnemius, a 13.9-fold increase in the predominantly red portion of the gastrocnemius, and a 16.6-fold increase in soleus muscle. Recently, 13C MRS techniques have been developed to measure oxygen consumption in heart (Jeffrey et al. 1999). Although application of this methodology in rested and contracted skeletal muscle is technically more challenging, it could be employed in the future to allow changes in oxygen consumption to be unambiguously defined for each muscle. This would allow a more quantitative assessment of absolute increases in TCA cycle flux and flux through anaplerotic pathways during rest and contraction.
The possible role of anaplerosis in maintaining optimal levels of TCA cycle flux to support oxidative phosphorylation is controversial (Gollnick, 1985; Constantin-Teodosiu et al. 1999; Gibala et al. 2000). The observation that absolute levels of TCA cycle intermediates decline with fatiguing exercise, and the link between impaired TCA cycle expansion and impaired oxidative phosphorylation due to blocked glycogenolysis in muscle phosphorylase deficiency (Sahlin et al. 1990, 1995), support such a relationship. However, a recent study in healthy individuals demonstrated that, although the sum of TCAI increased almost 3-fold within the first few minutes of exercise, TCAI measurements after 60 and 90 min of sustained non-fatiguing exercise were not different from resting values (Gibala et al. 2002). Additionally, oxygen uptake in the exercising limb remained consistently high throughout the exercise period (Gibala et al. 2002). It may be that the ability to sustain flux through anaplerotic pathways is more important for normal oxidative metabolism in muscle than expansion of the TCAI pool per se. The purpose of anaplerotic flux into the TCA cycle may be to continually replenish key intermediates of low concentration such as oxaloacetate, while a function of TCA cycle efflux may be to aid in the removal of ammonia from exercising muscle. We consider that our finding of proportional increases in flux through anaplerotic pathways and oxidative carbon entry into the TCA cycle with muscle contraction supports the hypothesis that anaplerotic flux plays an important role in maintaining overall TCA cycle function and energy transduction during exercise.
In conclusion, fibre-type specific rates of relative anaplerotic flux were observed during both rest and contraction and correlated well with muscle oxidative capacity. Relative rates of anaplerotic flux were maintained during contraction, suggesting an association between TCA cycle oxidative and anaplerotic fluxes. Absolute rates of anaplerotic flux therefore rise in proportion to increased oxidation rates during contraction, which is consistent with a sustained increase in substrate entry into and exit from the TCA cycle through anaplerotic pathways during contraction.
Acknowledgments
This study was supported by an Associate Investigator award and Merit (No. 98–139) and VISN17 grants (No. 99–89) from the Department of Veterans Affairs.
references
- Aragón JJ, Lowenstein JM. The purine nucleotide cycle: comparison of the levels of citric acid cycle intermediates with the operation of the purine nucleotide cycle in rat skeletal muscle during exercise and recovery from exercise. Eur J Biochem. 1980;110:371–377. doi: 10.1111/j.1432-1033.1980.tb04877.x. [DOI] [PubMed] [Google Scholar]
- Constantin-Teodosiu D, Simpson EJ, Greenhaff PL. The importance of pyruvate availability to PDC activation and anaplerosis in human skeletal muscle. Am J Physiol. 1999;276:E472–478. doi: 10.1152/ajpendo.1999.276.3.E472. [DOI] [PubMed] [Google Scholar]
- Dyck DJ, Peters SJ, Glatz J, Gorski J, Keizer H, Kiens B, Liu S, Richter EA, Spriet LL, van der Vusse GJ, Bonen A. Functional differences in lipid metabolism in resting skeletal muscle of various fiber types. Am J Physiol. 1997;272:E340–351. doi: 10.1152/ajpendo.1997.272.3.E340. [DOI] [PubMed] [Google Scholar]
- Gibala MJ, González-Alonso J, Saltin B. Dissociation between muscle tricarboxylic acid cycle pool size and aerobic energy provision during prolonged exercise in humans. J Physiol. 2002;545:705–713. doi: 10.1113/jphysiol.2002.028084. [DOI] [PMC free article] [PubMed] [Google Scholar]
- Gibala MJ, MacLean DA, Graham TE, Saltin B. Tricarboxylic acid cycle intermediate pool size and estimated cycle flux in human muscle during exercise. Am J Physiol. 1998;275:E235–242. doi: 10.1152/ajpendo.1998.275.2.E235. [DOI] [PubMed] [Google Scholar]
- Gibala MJ, Tarnopolsky MA, Graham TE. Tricarboxylic acid cycle intermediates in human muscle at rest and during prolonged cycling. Am J Physiol. 1997;272:C834–841. doi: 10.1152/ajpendo.1997.272.2.E239. [DOI] [PubMed] [Google Scholar]
- Gibala MJ, Young ME, Taegtmeyer H. Anaplerosis of the citric acid cycle: role in energy metabolism of heart and skeletal muscle. Acta Physiol Scand. 2000;168:657–665. doi: 10.1046/j.1365-201x.2000.00717.x. [DOI] [PubMed] [Google Scholar]
- Gollnick PD. Metabolism of substrates: energy substrate metabolism during exercise and as modified by training. Fed Proc. 1985;44:353–357. [PubMed] [Google Scholar]
- Gollnick PD, Saltin B. Fuel for muscular exercise: Role of fat. In: Horton ES, Terjung RL, editors. Exercise, Nutrition, and Energy Metabolism. New York: Blackwell Science Inc; 1988. pp. 72–88. chap. 5. [Google Scholar]
- Graham TE, Gibala MJ. Anaplerosis of the tricarboxylic acid cycle in human skeletal muscle during exercise. Magnitude, sources and potential physiological significance. Adv Exp Med Biol. 1998;441:271–286. doi: 10.1007/978-1-4899-1928-1_25. [DOI] [PubMed] [Google Scholar]
- Hood DA, Górski J, Terjung RL. Oxygen cost of twitch and tetanic isometric contractions of rat skeletal muscle. Am J Physiol. 1986;250:E449–456. doi: 10.1152/ajpendo.1986.250.4.E449. [DOI] [PubMed] [Google Scholar]
- Jeffrey FMH, Reshetov A, Storey CJ, Carvalho RA, Sherry AD, Malloy CR. Use of a single 13C NMR resonance of glutamate for measuring oxygen consumption in tissue. Am J Physiol. 1999;277:E1111–1121. doi: 10.1152/ajpendo.1999.277.6.E1111. [DOI] [PubMed] [Google Scholar]
- Jeffrey FMH, Storey CJ, Sherry AD, Malloy CR. 13C isotopomer model for estimation of anaplerotic substrate oxidation via acetyl-CoA. Am J Physiol. 1996;271:E788–799. doi: 10.1152/ajpendo.1996.271.4.E788. [DOI] [PubMed] [Google Scholar]
- Jones JG, Naidoo R, Sherry AD, Jeffrey FMH, Cottam GL, Malloy CR. Measurement of gluconeogenesis and pyruvate recycling in the rat liver: a simple analysis of glucose and glutamate isotopomers during metabolism of [1,2,3-13C]propionate. FEBS Lett. 1997;412:131–137. doi: 10.1016/s0014-5793(97)00764-3. [DOI] [PubMed] [Google Scholar]
- Jucker BM, Rennings AJM, Cline GW, Petersen KF, Shulman GI. In vivo NMR investigation of intramuscular glucose metabolism in conscious rats. Am J Physiol. 1997;273:E139–148. doi: 10.1152/ajpendo.1997.273.1.E139. [DOI] [PubMed] [Google Scholar]
- Malloy CR, Jones JG, Jeffrey FM, Jessen ME, Sherry AD. Contribution of various substrates to total citric acid cycle flux and anaplerosis as determined by 13C isotopomer analysis and O2 consumption in the heart. MAGMA. 1996;4:35–46. doi: 10.1007/BF01759778. [DOI] [PubMed] [Google Scholar]
- Malloy CR, Sherry AD, Jeffrey FMH. Carbon flux through citric acid cycle pathways in perfused heart by 13C NMR spectroscopy. FEBS Lett. 1987;212:58–62. doi: 10.1016/0014-5793(87)81556-9. [DOI] [PubMed] [Google Scholar]
- Malloy CR, Sherry AD, Jeffrey FMH. Evaluation of carbon flux and substrate selection through alternate pathways involving the citric acid cycle of the heart by 13C NMR spectroscopy. J Biol Chem. 1988;263:6964–6971. [PubMed] [Google Scholar]
- Malloy CR, Thompson JR, Jeffrey FMH, Sherry AD. Contribution of exogenous substrates to acetyl coenzyme A: measurement by 13C NMR under non-steady-state conditions. Biochemistry. 1990;29:6756–6761. doi: 10.1021/bi00481a002. [DOI] [PubMed] [Google Scholar]
- Mezzarobba V, Bielicki G, Jeffrey FMH, Mignon M, Renou JP, Grizard J, Meynial-Denis D. Lack of effect of ageing on acetate oxidation by rat skeletal muscle during starvation: a 13C NMR study. J Exp Biol. 2000;203:995–1001. doi: 10.1242/jeb.203.6.995. [DOI] [PubMed] [Google Scholar]
- Sahlin K, Jorfeldt L, Henriksson K-G, Lewis SF, Haller RG. Tricarboxylic acid cycle intermediates during incremental exercise in healthy subjects and in patients with McArdle's disease. Clin Sci. 1995;88:687–693. doi: 10.1042/cs0880687. [DOI] [PubMed] [Google Scholar]
- Sahlin K, Katz A, Broberg S. Tricarboxylic acid cycle intermediates in human muscle during prolonged exercise. Am J Physiol. 1990;259:C834–C841. doi: 10.1152/ajpcell.1990.259.5.C834. [DOI] [PubMed] [Google Scholar]
- Saltin B, Gollnick PD. Fuel for muscular exercise: Role of carbohydrate. In: Horton ES, Terjung RL, editors. Exercise, Nutrition, and Energy Metabolism. New York: Blackwell Science Inc; 1988. pp. 45–71. chap. 4. [Google Scholar]
- Sherry AD, Malloy CR. Isotopic methods for probing organization of cellular metabolism. Cell Biochem Funct. 1996;14:259–268. doi: 10.1002/cbf.700. [DOI] [PubMed] [Google Scholar]
- Sherry AD, Malloy CR. 13C isotopomer analysis of glutamate: a NMR method to probe metabolic pathways intersecting the citric acid cycle. In: Berliner LJ, Robitaille P-ML, editors. Biological Magnetic Resonance in vivo Carbon-13 NMR. vol. 15. New York: Blackwell Science Inc; 1998. pp. 59–97. [Google Scholar]
- Szczepaniak L, Babcock EE, Malloy CR, Sherry AD. Oxidation of acetate in rabbit skeletal muscle: Detection by 13C NMR spectroscopy in vivo. Magn Reson Med. 1996;36:451–457. doi: 10.1002/mrm.1910360318. [DOI] [PubMed] [Google Scholar]